


|
시장보고서
상품코드
2019236
제어 환경 농업(CEA) 시장기회, 성장요인, 업계 동향 분석 및 예측(2026-2035년)Controlled Environment Agriculture (CEA) Market Opportunity, Growth Drivers, Industry Trend Analysis, and Forecast 2026 - 2035 |
||||||
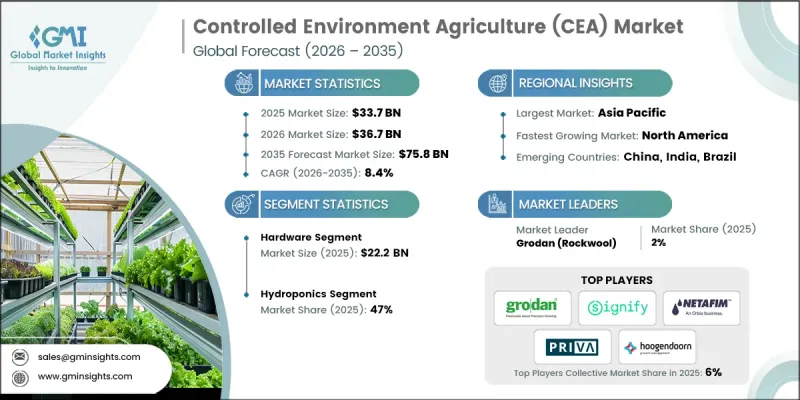
세계의 제어 환경 농업(CEA) 시장은 2025년에 337억 달러로 평가되었고, CAGR 8.4%로 성장하여 2035년까지 758억 달러에 이를 것으로 추정되고 있습니다.
이 산업은 날씨, 토양, 계절적 조건에 의존하는 전통적인 농업 방식을 완전히 통제된 지속 가능한 생산 환경으로 대체하는 변화를 겪고 있습니다. CEA를 통해 생산자는 자연적 요인에 대한 의존도를 낮추면서 연중 안정적인 고품질 작물을 생산할 수 있습니다. 이러한 변화의 주요 요인으로는 농지 감소, 추적 가능성과 신선도를 중시하는 소비자 수요 증가, 자원 사용량 및 화학물질 사용 감소에 대한 관심 등을 꼽을 수 있습니다. 생산자들은 생산 효율을 최적화하기 위해 온실, 수직농법, 하이브리드 시설 등을 시범적으로 도입하고 있으며, 기술 투자, 운영비, 작물별 요구사항의 균형을 맞추기 위해 노력하고 있습니다. 소매업체와 식품 기업들은 신뢰할 수 있는 현지 농산물을 확보하기 위해 CEA 공급업체와 협력하고 있으며, 신규 진출기업들은 생산성과 지속가능성을 향상시키기 위해 에너지 절약형 조명, 자동화 시스템, 혁신적인 노동력 절감 기술을 도입하고 있습니다. 대규모 설비투자와 숙련된 인력 부족 등의 과제는 여전히 남아있지만, 시장은 꾸준히 성숙해 가고 있습니다.
| 시장 범위 | |
|---|---|
| 개시 연도 | 2025년 |
| 예측 기간 | 2026-2035년 |
| 개시 연도 시장 규모 | 337억 달러 |
| 예측액 | 758억 달러 |
| CAGR | 8.4% |
2025년 하드웨어 부문 시장 규모는 222억 달러에 달했습니다. 하드웨어는 빛, 온도, 습도, 공기 흐름 및 영양분 공급을 제어하는 현대 실내 농업 시스템의 기초를 이룹니다. 안정적인 재배 환경을 유지하기 위해서는 안정적인 하드웨어가 필수적이며, 온실, 수직농장, 식물공장에서의 지속적인 작물 생산에 필수적입니다. 신뢰할 수 있는 하드웨어가 없으면 생산자는 안정적인 수확량을 얻거나 최적의 작물 품질을 유지할 수 없기 때문에 CEA(폐쇄 환경 농업) 운영에서 하드웨어의 중요한 역할이 부각되고 있습니다.
2025년 수경재배 부문은 47%의 점유율을 차지했습니다. 수경재배 시스템은 흙을 사용하지 않고 고도로 제어된 환경을 제공하며, 식물에 물, 영양분, 산소를 직접 공급합니다. 이 방법은 자원 효율성을 극대화하는 동시에 토양 전염병, 해충, 날씨 변동과 같은 일반적인 농업 문제를 줄일 수 있습니다. 수경재배는 투입물 공급을 조절함으로써 양과 질 모두에서 안정적인 수확량을 확보할 수 있기 때문에 연중 안정적인 생산을 원하는 생산자에게 최적의 선택이 될 수 있습니다. 또한, 수경재배는 공간과 빛의 활용을 최적화하여 기존 농법에 비해 평방미터당 생산성을 높일 수 있습니다.
미국 제어환경농업(CEA) 시장은 78%의 점유율을 차지하고 있으며, 2025년에는 60억 달러 규모에 도달할 것으로 예측됩니다. 소매업체와 외식업계가 신뢰할 수 있는 고품질 농산물을 찾는 가운데, 현지산 무농약 농산물에 대한 수요가 성장을 주도하고 있습니다. 온실 및 수직 농장의 생산 능력 확대가 이러한 수요를 뒷받침하고 있으며, 숙련된 생산자, 기술 제공업체 및 자동화 전문가가 존재하여 신규 프로젝트의 빠른 확장을 촉진하고 있습니다. 북미의 탄탄한 인프라, 숙련된 인력, 성숙한 공급망은 첨단 CEA 솔루션의 신속한 도입과 배포를 용이하게 하여 이 지역 시장 성장과 안정성을 향상시키고 있습니다.
자주 묻는 질문
목차
제1장 조사 방법
제2장 주요 요약
제3장 업계 인사이트
제4장 경쟁 구도
제5장 시장 추산 및 예측 : 컴포넌트별, 2022-2035
제6장 시장 추산 및 예측 : 시설 유형별, 2022-2035
제7장 시장 추산 및 예측 : 기술별, 2022-2035
제8장 시장 추산 및 예측 : 작물별, 2022-2035
제9장 시장 추산 및 예측 : 최종 용도별, 2022-2035
제10장 시장 추산 및 예측 : 지역별, 2022-2035
제11장 기업 개요
LSHThe Global Controlled Environment Agriculture (CEA) Market was valued at USD 33.7 billion in 2025 and is estimated to grow at a CAGR of 8.4% to reach USD 75.8 billion by 2035.

The industry is undergoing a transformation where traditional farming methods reliant on weather, soil, and seasonal conditions are being replaced with fully controlled and sustainable production environments. CEA enables growers to produce consistent, high-quality crops year-round while reducing dependence on natural factors. Key drivers of this shift include the declining availability of farmland, rising consumer demand for traceable and fresh produce, and a focus on reducing resource use and chemical inputs. Growers are experimenting with greenhouses, vertical farms, and hybrid facilities to optimize production efficiency, balancing technology investments, operating costs, and crop-specific needs. Retailers and food companies are partnering with CEA providers to secure dependable, locally sourced produce, while new entrants are introducing energy-efficient lighting, automation systems, and innovative labor-saving technologies to improve productivity and sustainability. Although high capital investments and skilled labor shortages remain challenges, the market continues to mature steadily.
| Market Scope | |
|---|---|
| Start Year | 2025 |
| Forecast Year | 2026-2035 |
| Start Value | $33.7 Billion |
| Forecast Value | $75.8 Billion |
| CAGR | 8.4% |
The hardware segment accounted for USD 22.2 billion in 2025. Hardware forms the backbone of modern indoor farming systems, controlling light, temperature, humidity, airflow, and nutrient delivery. Reliable hardware is essential to maintain stable growing conditions, making it indispensable for continuous crop production across greenhouses, vertical farms, and plant factories. Without dependable hardware, growers cannot achieve consistent yields or maintain optimal crop quality, highlighting its critical role in CEA operations.
The hydroponics segment held a 47% share in 2025. Hydroponic systems provide a soil-free, highly controlled environment, supplying plants with water, nutrients, and oxygen directly. This method maximizes resource efficiency while mitigating common agricultural challenges such as soil-borne diseases, pests, and weather variability. Controlled input delivery ensures stable yields in both quantity and quality, making hydroponics the preferred choice for growers aiming for reliable, year-round production. Hydroponics also optimizes space and light usage, enabling higher productivity per square meter compared to traditional farming methods.
U.S. Controlled Environment Agriculture (CEA) Market held 78% share, generating USD 6 billion in 2025. Demand for locally grown, pesticide-free produce drives growth, as retailers and food service providers seek reliable, high-quality crops. Expansion in greenhouse and vertical farm capacities supports this demand, while the presence of experienced growers, technology providers, and automation experts helps new projects scale quickly. North America's strong infrastructure, skilled workforce, and mature supply chain facilitate rapid adoption and deployment of advanced CEA solutions, enhancing market growth and stability in the region.
Key players operating in the Global Controlled Environment Agriculture (CEA) Market include Heliospectra, Netafim, Freight Farms, iFarm, Koidra, Urban Crop Solutions, Agritecture, Priva, Signify, Fluence, Grodan, OSRAM, Hoogendoorn, Argus Controls, and Ridder. Companies in the Controlled Environment Agriculture (CEA) Market are adopting multiple strategies to strengthen their presence and expand market foothold. They are investing heavily in research and development to improve energy-efficient lighting, climate control systems, and automation technologies, enhancing crop yield and consistency. Strategic collaborations with retailers, foodservice operators, and technology partners help integrate innovative solutions into commercial operations. Geographic expansion into high-demand regions and targeting urban areas enables better access to end consumers. Firms are also emphasizing sustainability by optimizing water, nutrient, and energy usage while adopting eco-friendly materials.
Table of Contents
Chapter 1 Research Methodology
- 1.1 Research approach
- 1.2 Quality Commitments
- 1.2.1 GMI AI policy & data integrity commitment
- 1.2.1.1 Source consistency protocol
- 1.2.1 GMI AI policy & data integrity commitment
- 1.3 Research Trail & Confidence Scoring
- 1.3.1 Research Trail Components
- 1.3.2 Scoring Components
- 1.4 Data Collection
- 1.4.1 Partial list of primary sources
- 1.5 Data mining sources
- 1.5.1 Paid sources
- 1.5.1.1 Sources, by region
- 1.5.1 Paid sources
- 1.6 Base estimates and calculations
- 1.6.1 Base year calculation for any one approach
- 1.7 Forecast model
- 1.7.1 Quantified market impact analysis
- 1.7.1.1 Mathematical impact of growth parameters on forecast
- 1.7.1 Quantified market impact analysis
- 1.8 Research transparency addendum
- 1.8.1 Source attribution framework
- 1.8.2 Quality assurance metrics
- 1.8.3 Our commitment to trust
Chapter 2 Executive Summary
- 2.1 Industry 360° synopsis, 2022 - 2035
- 2.2 Key market trends
- 2.2.1 Country
- 2.2.2 Component
- 2.2.3 Facility Type
- 2.2.4 Technology
- 2.2.5 Crop
- 2.2.6 End use
Chapter 3 Industry Insights
- 3.1 Industry ecosystem analysis
- 3.1.1 Raw material suppliers
- 3.1.2 Component manufacturers
- 3.1.3 Technology providers
- 3.1.4 System integrators
- 3.1.5 Consulting & engineering firms
- 3.1.6 Distributors & retailers
- 3.1.7 End users
- 3.1.8 Value addition by stage
- 3.2 Industry impact forces
- 3.2.1 Growth drivers
- 3.2.1.1 Rising Demand for Clean and Traceable Produce
- 3.2.1.2 Declining Availability of Arable Land and Unpredictable Climate
- 3.2.1.3 Advancements in Indoor Farming Technologies
- 3.2.2 Industry pitfalls & challenges
- 3.2.2.1 High Initial Investment and Operating Costs
- 3.2.2.2 Need for Skilled Technical Expertise
- 3.2.3 Opportunities
- 3.2.3.1 Expansion of Urban and On-Site Food Production
- 3.2.3.2 Integration of Renewable Energy and Smart Automation
- 3.2.1 Growth drivers
- 3.3 Growth potential analysis
- 3.4 Future market trends
- 3.5 Technology and innovation landscape
- 3.5.1 LED lighting technology evolution
- 3.5.2 Climate control system advancements [solution core]
- 3.5.2.1 Precision temperature & humidity control requirements
- 3.5.2.2 Energy efficiency standards & benchmarks (kW per sq ft)
- 3.5.2.3 CO2 enrichment & management systems
- 3.5.2.4 Integration with IoT & building automation platforms
- 3.5.2.5 HVAC system sizing & specification by facility type
- 3.5.2.6 Competitive landscape for CEA climate control suppliers
- 3.5.3 Automation & robotics integration
- 3.5.4 IoT & sensor technology
- 3.5.5 Nutrient delivery system innovations
- 3.5.6 Water management technologies
- 3.6 Patent landscape (driven by primary research)
- 3.6.1 Patent filing trends (2018-2024)
- 3.6.2 Key technology areas (lighting, climate control, automation)
- 3.6.3 Geographic patent distribution
- 3.6.4 Top patent assignees
- 3.6.5 Emerging innovation clusters
- 3.7 Pricing analysis (driven by primary research)
- 3.7.1 Historical price trend analysis (driven by primary research)
- 3.7.2 Pricing strategy by player type (premium / value / cost-plus) (driven by primary research)
- 3.7.3 Regional price variations
- 3.7.4 Component cost structure
- 3.7.5 Price elasticity analysis
- 3.8 Regulatory landscape
- 3.8.1 Standards and compliance requirements
- 3.8.2 Regional regulatory frameworks
- 3.8.3 Certification standards
- 3.9 Trade data analysis (driven by primary research)
- 3.9.1 Import / export volume & value trends (driven by primary research)
- 3.9.2 Key trade corridors & tariff impact (driven by primary research)
- 3.9.3 Equipment trade flows by region
- 3.9.4 Regulatory barriers to trade
- 3.10 Impact of ai & generative ai on the market
- 3.10.1 AI-driven disruption of existing business models
- 3.10.2 Genai use cases & adoption roadmap by segment
- 3.10.3 Risks, limitations & regulatory considerations
- 3.11 Porter's analysis
- 3.12 PESTEL analysis
- 3.13 Capacity & production landscape (Driven by Primary Research)
- 3.13.1 Installed capacity by region & key producer (Driven by Primary Research)
- 3.13.2 Capacity utilization rates & expansion pipelines (Driven by Primary Research)
Chapter 4 Competitive Landscape, 2025
- 4.1 Introduction
- 4.2 Company market share analysis
- 4.2.1 North America
- 4.2.2 Europe
- 4.2.3 Asia Pacific
- 4.2.4 Latin America
- 4.2.5 Middle East and Africa
- 4.3 Company matrix analysis
- 4.4 Competitive analysis of major market players
- 4.4.1 Product portfolio comparison
- 4.4.2 Geographic footprint analysis
- 4.4.3 Financial performance benchmarking
- 4.4.4 Technology partnerships & component suppliers
- 4.5 Competitive positioning matrix
- 4.6 Key developments
- 4.6.1 Mergers & acquisitions
- 4.6.2 Partnerships & collaborations
- 4.6.3 New product launches
- 4.6.4 Expansion plans
Chapter 5 Market Estimates & Forecast, By Component, 2022-2035 ($Bn)
- 5.1 Key trends
- 5.2 Hardware
- 5.2.1 Lighting
- 5.2.2 Climate control systems
- 5.2.2.1 HVAC Systems
- 5.2.2.2 Humidity Control
- 5.2.2.3 CO2 Management
- 5.2.3 Sensors
- 5.2.4 Irrigation systems
- 5.2.5 Research & Institutional
- 5.3 Software
- 5.3.1 Farm management software
- 5.3.2 Data analytics
- 5.3.3 Remote monitoring
- 5.3.4 Others
- 5.4 Service
- 5.4.1 Installation
- 5.4.2 Maintenance
- 5.4.3 Consulting
Chapter 6 Market Estimates & Forecast, By Facility Type, 2022-2035 ($Bn)
- 6.1 Key trends
- 6.2 Green House
- 6.3 Vertical Farms
- 6.4 Others
Chapter 7 Market Estimates & Forecast, By Technology, 2022-2035 ($Bn)
- 7.1 Key trends
- 7.2 Hydroponics
- 7.3 Aeroponics
- 7.4 Soil-Based Under Cover
Chapter 8 Market Estimates & Forecast, By Crop, 2022-2035 ($Bn)
- 8.1 Key trends
- 8.2 Vegetables
- 8.3 Fruits
- 8.4 Soil-Based Under Cover
Chapter 9 Market Estimates & Forecast, By End use, 2022-2035 ($Bn)
- 9.1 Key trends
- 9.2 Commercial
- 9.2.1 Large-scale commercial (>50,000 sq ft)
- 9.2.2 Small-scale commercial (<50,000 sq ft)
- 9.3 Residential
- 9.4 Others
Chapter 10 Market Estimates & Forecast, By Region, 2022-2035 ($Bn)
- 10.1 Key trends
- 10.2 North America
- 10.2.1 U.S.
- 10.2.2 Canada
- 10.3 Europe
- 10.3.1 UK
- 10.3.2 Germany
- 10.3.3 France
- 10.3.4 Italy
- 10.3.5 Spain
- 10.3.6 Russia
- 10.3.7 Netherlands
- 10.3.8 Rest of Europe
- 10.4 Asia Pacific
- 10.4.1 China
- 10.4.2 India
- 10.4.3 Japan
- 10.4.4 South Korea
- 10.4.5 Australia
- 10.4.6 Rest of Asia Pacific
- 10.5 Latin America
- 10.5.1 Brazil
- 10.5.2 Mexico
- 10.5.3 Argentina
- 10.5.4 Rest of Latin America
- 10.6 MEA
- 10.6.1 South Africa
- 10.6.2 Saudi Arabia
- 10.6.3 UAE
- 10.6.4 Rest of MEA
Chapter 11 Company Profiles
- 11.1 Heliospectra
- 11.2 Netafim
- 11.3 Freight Farms
- 11.4 iFarm
- 11.5 Koidra
- 11.6 Urban Crop Solutions
- 11.7 Agritecture
- 11.8 Priva
- 11.9 Signify
- 11.10 Fluence
- 11.11 Grodan
- 11.12 OSRAM
- 11.13 Hoogendoorn
- 11.14 Argus Controls
- 11.15 Ridder
