
|
시장보고서
상품코드
2027454
진공 밸브 : 시장 기회, 성장 촉진요인, 업계 동향 분석 및 예측(2026-2035년)Vacuum Valve Market Opportunity, Growth Drivers, Industry Trend Analysis, and Forecast 2026 - 2035 |
||||||
세계의 진공 밸브 시장은 2025년에 29억 달러로 평가되었고, 2035년까지 연평균 복합 성장률(CAGR) 10.2%를 나타내 81억 달러에 이를 것으로 추정되고 있습니다.
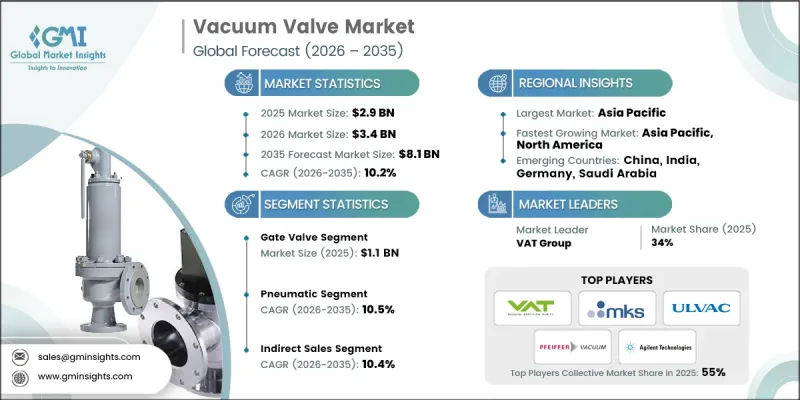
이러한 성장은 반도체 제조, 제약, 화학 처리 등의 산업에서 채택이 확대되면서 성장세를 견인하고 있습니다. 반도체 생산, 특히 첨단 칩 제조의 복잡성 증가로 인해 정밀한 진공 제어 시스템의 필요성이 크게 증가하고 있습니다. 동시에 각국 정부는 공급망 복원력을 강화하기 위해 국내 제조 역량에 대한 투자를 우선시하고 있으며, 이는 수요를 더욱 가속화시키고 있습니다. 제약 산업에서도 중요한 생산 응용 분야에서 진공 기반 공정의 사용 확대를 통해 시장 확대에 기여하고 있습니다. 또한, 각 산업 분야에서 에너지 효율과 환경 친화적 운영이 더욱 중요해지면서 첨단 진공 시스템의 도입이 촉진되고 있습니다. 화학 산업은 공정의 일관성과 제품 품질을 유지하기 위해 이러한 기술에 계속 의존하고 있습니다. 또한, 인더스트리 4.0의 도입으로 스마트 기술의 통합이 진행되어 실시간 모니터링과 자동화가 가능해졌습니다. 이를 통해 운영 성과를 개선하고 진공 밸브 시장의 지속적인 성장을 지원하고 있습니다.
| 시장 범위 | |
|---|---|
| 시작 연도 | 2025년 |
| 예측 기간 | 2026-2035년 |
| 개시 연도 시장 규모 | 29억 달러 |
| 예측액 | 81억 달러 |
| CAGR | 10.2% |
게이트 밸브 부문은 2025년 11억 달러 시장 규모를 기록했으며, 2035년까지 연평균 복합 성장률(CAGR) 10.6%를 나타낼 것으로 예측됩니다. 게이트 밸브는 다양한 산업 분야에서 높은 정밀도로 유량을 제어할 수 있어 수요가 증가하고 있습니다. 이러한 범용성과 신뢰성은 일관되고 제어된 동작 성능이 요구되는 분야에서의 채택 확대를 뒷받침하고 있으며, 이 분야의 꾸준한 성장에 기여하고 있습니다.
공압 부문은 2025년 52%의 점유율을 차지했으며, 2026년부터 2035년까지 연평균 10.5%의 성장률을 나타낼 것으로 전망됩니다. 이 부문의 성장은 효율적이고 빠른 운영 시스템에 대한 수요 증가에 의해 주도되고 있습니다. 각 산업 분야에서 공압 솔루션은 자동화된 환경에서 신뢰할 수 있는 성능을 발휘할 수 있기 때문에 공압 솔루션이 채택되고 있으며, 이는 전체 시장에서 공압 솔루션의 사용 확대를 뒷받침하고 시장에서의 입지를 강화하는 데 기여하고 있습니다.
미국의 진공 밸브 시장은 2025년 80%의 점유율을 차지하며 5억 5,810만 달러 시장 규모를 기록했습니다. 이 나라 시장 확대는 지속적인 기술 발전과 다양한 산업 분야에서 진공 기반 시스템이 광범위하게 채택되고 있는 데 힘입은 바 큽니다. 고성장 부문의 강력한 수요가 시장 발전을 더욱 촉진하는 한편, 지속적인 혁신과 첨단 제조 기술의 통합으로 새로운 성장 기회가 계속 창출되고 있습니다. 또한, 산업 응용 분야의 확대와 고정밀 공정에 대한 요구가 증가하면서 이 지역 전체에서 진공 밸브에 대한 수요가 증가하고 있습니다.
자주 묻는 질문
목차
제1장 조사 방법과 범위
제2장 주요 요약
제3장 업계 인사이트
제4장 경쟁 구도
제5장 시장 추산 및 예측 : 밸브 유형별(2022-2035년)
제6장 시장 추산 및 예측 : 작동 방식별(2022-2035년)
제7장 시장 추산 및 예측 : 진공도별(2022-2035년)
제8장 시장 추산 및 예측 : 용도별(2022-2035년)
제9장 시장 추산 및 예측 : 유통 채널별(2022-2035년)
제10장 시장 추산 및 예측 : 지역별(2022-2035년)
제11장 기업 개요
KTH 26.05.20The Global Vacuum Valve Market was valued at USD 2.9 billion in 2025 and is estimated to grow at a CAGR of 10.2% to reach USD 8.1 billion by 2035.

Growth is fueled by increasing adoption across industries such as semiconductor manufacturing, pharmaceuticals, and chemical processing. The rising complexity of semiconductor production, particularly in advanced chip fabrication, is significantly increasing the need for precise vacuum control systems. At the same time, governments worldwide are prioritizing investments in domestic manufacturing capabilities to strengthen supply chain resilience, which is further accelerating demand. The pharmaceutical sector is also contributing to market expansion through the growing use of vacuum-based processes for critical production applications. In addition, industries are placing greater emphasis on energy efficiency and environmentally responsible operations, encouraging the use of advanced vacuum systems. The chemical sector continues to rely on these technologies to maintain process consistency and product quality. Moreover, the adoption of Industry 4.0 practices is driving the integration of smart technologies, enabling real-time monitoring and automation, which is enhancing operational performance and supporting sustained growth in the vacuum valve market.
| Market Scope | |
|---|---|
| Start Year | 2025 |
| Forecast Year | 2026-2035 |
| Start Value | $2.9 Billion |
| Forecast Value | $8.1 Billion |
| CAGR | 10.2% |
The gate valve segment generated USD 1.1 billion in 2025 and is expected to grow at a CAGR of 10.6% throughout 2035. Demand for gate valves is increasing due to their ability to regulate flow with high precision across a wide range of industrial applications. Their versatility and reliability are supporting broader adoption in sectors that require consistent and controlled operational performance, contributing to steady segment growth.
The pneumatic segment held a share of 52% in 2025 and is projected to grow at a CAGR of 10.5% between 2026 and 2035. Growth in this segment is being driven by the increasing preference for efficient and high-speed operational systems. Industries are adopting pneumatic solutions due to their ability to deliver reliable performance in automated environments, which is supporting their growing use and strengthening their position within the overall market.
United States Vacuum Valve Market accounted for 80% share in 2025, generating USD 558.1 million. Market expansion in the country is supported by continuous technological advancements and the widespread adoption of vacuum-based systems across multiple industries. Strong demand from high-growth sectors is further reinforcing market development, while ongoing innovation and increasing integration of advanced manufacturing technologies continue to create new growth opportunities. Additionally, the expansion of industrial applications and the rising need for precision-driven processes are sustaining demand for vacuum valves across the region.
Key companies operating in the Global Vacuum Valve Market include Agilent Technologies, Busch Group, Edwards Vacuum, Flomatic Valves, Foshan Bowah Vacuum Equipment, Herose, HTC Vacuum, Kurt J. Lesker Company (KJLC), MKS Instruments, Nor-Cal Products, Pfeiffer Vacuum, Rochling, Storagetech, ULVAC, and VAT Group. Companies in the Global Vacuum Valve Market are strengthening their competitive position by focusing on technological innovation and product advancement. Manufacturers are investing in research and development to introduce high-performance valves with improved efficiency, durability, and precision. Strategic collaborations and partnerships are enabling companies to expand their global footprint and enhance distribution capabilities. Firms are also integrating smart technologies, including sensors and automation features, to align with evolving industrial requirements. In addition, efforts to optimize manufacturing processes and reduce operational costs are helping companies remain competitive, while customized solutions and application-specific designs are supporting stronger customer engagement and long-term market growth.
Table of Contents
Chapter 1 Methodology and scope
- 1.1 Research approach
- 1.2 Quality Commitments
- 1.2.1 GMI AI policy & data integrity commitment
- 1.2.1.1 Source consistency protocol
- 1.2.1 GMI AI policy & data integrity commitment
- 1.3 Research Trail & Confidence Scoring
- 1.3.1 Research Trail Components
- 1.3.2 Scoring Components
- 1.4 Data Collection
- 1.4.1 Partial list of primary sources
- 1.5 Data mining sources
- 1.5.1 Paid sources
- 1.5.1.1 Sources, by region
- 1.5.1 Paid sources
- 1.6 Base estimates and calculations
- 1.6.1 Base year calculation for any one approach
- 1.7 Forecast model
- 1.7.1 Quantified market impact analysis
- 1.7.1.1 Mathematical impact of growth parameters on forecast
- 1.7.1 Quantified market impact analysis
- 1.8 Research transparency addendum
- 1.8.1 Source attribution framework
- 1.8.2 Quality assurance metrics
- 1.8.3 Our commitment to trust
Chapter 2 Executive summary
- 2.1 Industry 360° synopsis
- 2.2 Key market trends
- 2.2.1 Regional trends
- 2.2.2 Valve type trends
- 2.2.3 Actuation type trends
- 2.2.4 Vacuum level trends
- 2.2.5 Application trends
- 2.2.6 Distribution channel trends
Chapter 3 Industry insights
- 3.1 Industry ecosystem analysis
- 3.1.1 Supplier landscape
- 3.1.2 Profit margin
- 3.1.3 Value addition at each stage
- 3.1.4 Factor affecting the value chain
- 3.2 Supply Chain Analysis
- 3.2.1 Raw material sources
- 3.2.2 Distribution channels
- 3.2.3 Supply chain risks
- 3.2.4 Manufacturing and assembly locations
- 3.2.5 Semiconductor supply chain specifically
- 3.3 Industry impact forces
- 3.3.1 Growth drivers
- 3.3.1.1 Increasing demand for vacuum valves in semiconductor manufacturing
- 3.3.1.2 Growing adoption of vacuum valves in the healthcare sector
- 3.3.1.3 Rising investments in research and development activities to enhance vacuum valve
- 3.3.2 Industry pitfalls & challenges
- 3.3.2.1 High initial costs associated with vacuum valve installation and maintenance
- 3.3.2.2 Intense competition among market players
- 3.3.2.3 Limited awareness and adoption in emerging markets
- 3.3.3 Market opportunities
- 3.3.3.1 Expansion of the semiconductor industry in developing regions
- 3.3.3.2 Technological advancements
- 3.3.3.3 Growing focus on renewable energy and environmental sustainability
- 3.3.1 Growth drivers
- 3.4 Growth potential analysis
- 3.5 Future market trends
- 3.6 Technology and innovation landscape
- 3.6.1 Emerging technologies
- 3.6.1.1 Miniaturization and integration of valve control systems
- 3.6.1.2 IoT-enabled predictive maintenance for vacuum systems
- 3.6.1.3 Sustainable manufacturing: energy-efficient valve designs
- 3.6.1 Emerging technologies
- 3.7 Pricing Analysis (Driven by Primary Research)
- 3.7.1 Historical price trend analysis (Driven by Primary Research) (2022-2025)
- 3.7.2 Pricing strategy by player type (Driven by Primary Research)
- 3.8 Regulatory landscape
- 3.8.1 Global safety and quality standards (ISO 9001, SEMI standards for semiconductor equipment)
- 3.8.1.1 Regional regulatory frameworks
- 3.8.1.1.1 North America: OSHA workplace safety requirements
- 3.8.1.1.2 Europe: CE marking, ATEX directives for hazardous environments
- 3.8.1.1.3 Asia Pacific: Country-specific industrial equipment certifications
- 3.8.1.1 Regional regulatory frameworks
- 3.8.2 Semiconductor-specific compliance
- 3.8.3 SEMI S2 (Environmental, Health, and Safety Guideline)
- 3.8.4 SEMI F47 (Cleanliness specifications for vacuum components)
- 3.8.5 Export control regulations (dual-use technology restrictions)
- 3.8.1 Global safety and quality standards (ISO 9001, SEMI standards for semiconductor equipment)
- 3.9 Trade Data Analysis (Driven by Paid database)
- 3.9.1 Import/export volume & value trends (2022-2025)
- 3.9.2 Key trade corridors & tariff impact
- 3.10 Impact of AI & generative ai on the market
- 3.10.1 AI-driven disruption of traditional business models
- 3.10.2 GenAI use cases & adoption roadmap by customer segment
- 3.10.3 Risks, limitations & regulatory considerations
- 3.10.4 AI-enabled smart home ecosystem integration
- 3.11 Porter's analysis
- 3.12 PESTEL analysis
Chapter 4 Competitive landscape, 2025
- 4.1 Introduction
- 4.2 Company market share analysis
- 4.2.1 North America
- 4.2.2 Europe
- 4.2.3 Asia Pacific
- 4.2.4 Latin America
- 4.2.5 MEA
- 4.3 Company matrix analysis
- 4.4 Competitive analysis of major market players
- 4.5 Competitive positioning matrix
- 4.6 Key developments
- 4.6.1 Mergers & acquisitions
- 4.6.2 Partnerships & collaborations
- 4.6.3 New product launches
- 4.6.4 Expansion plans
Chapter 5 Market Estimates & Forecast, By Valve Type, 2022 - 2035 ($Billion, Thousand Units)
- 5.1 Key trends
- 5.2 Gate valve
- 5.3 Angle valve
- 5.4 Diaphragm valve
- 5.5 Ball valve
- 5.6 Butterfly valve
- 5.7 Others (check valves, throttle valves, etc.)
Chapter 6 Market Estimates & Forecast, By Actuation Type, 2022 - 2035 ($Billion, Thousand Units)
- 6.1 Key trends
- 6.2 Manual valves
- 6.3 Pneumatic valves
- 6.4 Electric valves
Chapter 7 Market Estimates & Forecast, By Vacuum Level, 2022 - 2035 ($Billion, Thousand Units)
- 7.1 Key trends
- 7.2 Low vacuum (760 to 25 Torr)
- 7.3 Medium vacuum (25 to 10^-3 Torr)
- 7.4 High vacuum (10^-3 to 10^-9 Torr)
- 7.5 Ultra-High vacuum (< 10^-9 Torr)
Chapter 8 Market Estimates & Forecast, By Application, 2022 - 2035 ($Billion, Thousand Units)
- 8.1 Key trends
- 8.2 Semiconductor manufacturing
- 8.3 Industrial manufacturing
- 8.4 Research & development
- 8.5 Healthcare & pharmaceuticals
- 8.6 Others (energy & power etc.)
Chapter 9 Market Estimates & Forecast, By Distribution Channel, 2022 - 2035 ($Billion, Thousand Units)
- 9.1 Key trends
- 9.2 Direct sales
- 9.3 Indirect sales
Chapter 10 Market Estimates & Forecast, By Region, 2022 - 2035 ($Billion, Thousand Units)
- 10.1 Key trends
- 10.2 North America
- 10.2.1 U.S.
- 10.2.2 Canada
- 10.3 Europe
- 10.3.1 Germany
- 10.3.2 UK
- 10.3.3 France
- 10.3.4 Spain
- 10.3.5 Italy
- 10.3.6 Netherlands
- 10.4 Asia Pacific
- 10.4.1 China
- 10.4.2 Japan
- 10.4.3 India
- 10.4.4 Australia
- 10.4.5 South Korea
- 10.5 Latin America
- 10.5.1 Brazil
- 10.5.2 Mexico
- 10.5.3 Argentina
- 10.6 MEA
- 10.6.1 South Africa
- 10.6.2 Saudi Arabia
- 10.6.3 UAE
Chapter 11 Company Profiles
- 11.1 Agilent Technologies
- 11.2 Busch Group
- 11.3 Edwards Vacuum
- 11.4 Flomatic Valves
- 11.5 Foshan Bowah Vacuum Equipment
- 11.6 Herose
- 11.7 HTC Vacuum
- 11.8 Kurt J. Lesker Company (KJLC)
- 11.9 MKS Instruments
- 11.10 Nor-Cal Products
- 11.11 Pfeiffer Vacuum
- 11.12 Rochling
- 11.13 Storagetech
- 11.14 ULVAC
- 11.15 VAT Group

