


|
시장보고서
상품코드
2027486
스마트 물류 플랫폼 시장 : 시장 기회, 성장 촉진요인, 업계 동향 분석 및 예측(2026-2035년)Smart Logistics Platforms Market Opportunity, Growth Drivers, Industry Trend Analysis, and Forecast 2026 - 2035 |
||||||
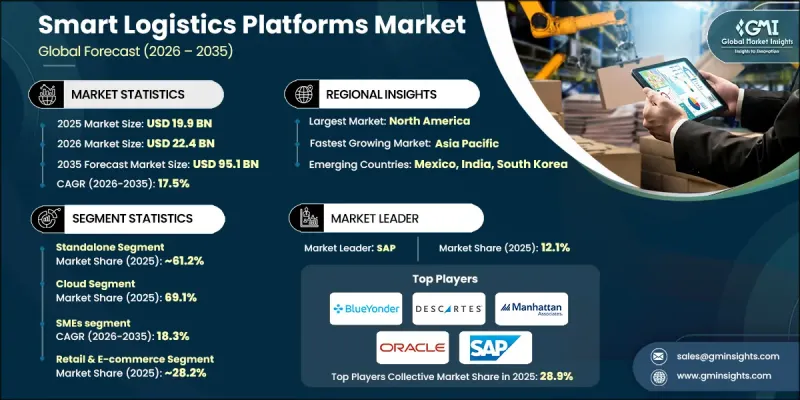
세계의 스마트 물류 플랫폼 시장은 2025년에 199억 달러로 평가되었고, 2035년까지 연평균 복합 성장률(CAGR) 17.5%를 나타내 951억 달러에 이를 것으로 추정되고 있습니다.
국제 무역 활동이 활발해지면서 세계의 스마트 물류 플랫폼 산업은 빠르게 성장하고 있으며, 공급망 효율성을 높이는 첨단 디지털 솔루션에 대한 수요가 급증하고 있습니다. 기업들은 업무의 효율성을 높이고, 협업을 강화하며, 복잡한 네트워크 전체에 대한 실시간 가시성을 확보하기 위해 지능형 물류 시스템을 점점 더 많이 도입하고 있습니다. 이러한 플랫폼은 물류 기능을 최적화하는 데 중요한 역할을 하고 있으며, 기업이 보다 민첩하고 정확하게 비즈니스를 전개할 수 있도록 돕고 있습니다. 디지털 전환에 대한 의존도가 높아짐에 따라 물류 프로세스에 첨단 기술의 통합이 더욱 가속화되고 있습니다. 기업들이 효율성과 확장성을 우선시하는 가운데, 스마트 물류 플랫폼은 끊임없이 변화하는 공급망 수요를 관리하기 위한 필수적인 도구가 되고 있습니다. 기술 개발에 대한 투자 확대와 혁신적인 솔루션의 등장으로 경쟁 구도가 재편되고 있으며, 조직이 물류 인프라를 현대화함에 따라 세계의 스마트 물류 플랫폼 시장은 지속적인 고성장 궤도에 오르고 있습니다.
| 시장 범위 | |
|---|---|
| 시작 연도 | 2025년 |
| 예측 기간 | 2026-2035년 |
| 개시 연도 시장 규모 | 199억 달러 |
| 예측액 | 951억 달러 |
| CAGR | 17.5% |
세계의 스마트 물류 플랫폼 시장은 인공지능, 커넥티드 시스템, 실시간 데이터 분석 등 디지털 기술의 확산으로 큰 영향을 받고 있습니다. 기업들은 업무를 자동화하고 의사결정 능력을 향상시킬 수 있는 통합 플랫폼의 도입을 점점 더 많이 추진하고 있습니다. 기술 개발에 대한 지속적인 투자를 통해 플랫폼의 기능을 더욱 강화하여 업무 효율성 향상, 경로 계획 최적화 및 전체 시스템 성능 향상을 실현하고 있습니다. 고급 솔루션을 도입하는 신규 진출기업 증가도 시장의 역동적인 성장 환경에 기여하고 있습니다.
2025년에는 독립형 부문이 61.2%의 점유율을 차지하며 122억 달러 시장 규모를 형성했습니다. 엔드투엔드 공급망 성능 향상에 대한 관심이 높아지면서 이 부문은 계속해서 선도적인 위치를 유지하고 있습니다. 기업들은 수익성, 대응력, 업무 유연성을 높이기 위해 물류 네트워크의 최적화에 점점 더 집중하고 있습니다. 고도의 분석과 지능형 시스템의 도입은 효율성을 높이고 업무상의 문제를 최소화함으로써 이러한 추세를 더욱 촉진하고 있습니다.
클라우드 부문은 2025년 69.1%의 점유율을 차지하며 137억 달러에 달했습니다. 클라우드 기반 도입은 확장성, 유연성, 물류 네트워크 전반에 걸쳐 원활한 통합을 지원하는 능력으로 인해 선호되는 접근 방식입니다. 이 모델을 통해 조직은 복잡한 업무를 효율적으로 관리할 수 있으며, 대규모 인프라 투자의 필요성을 줄이고 디지털 물류 생태계로의 지속적인 전환을 촉진할 수 있습니다.
미국의 스마트 물류 플랫폼 시장은 2025년 75억 달러에 달했으며, 2035년까지 연평균 17.5%의 성장률을 나타낼 것으로 전망됩니다. 미국의 성장은 물류 부문의 규모와 성숙도, 그리고 효율적이고 기술 중심의 솔루션에 대한 수요 증가에 의해 뒷받침되고 있습니다. 기업들은 스마트 물류 플랫폼을 활용하여 업무 가시성을 높이고 비용 효율성을 개선함으로써 보다 선견지명 있고 전략적인 공급망 관리를 실현하고 있습니다.
자주 묻는 질문
목차
제1장 조사 방법
제2장 주요 요약
제3장 업계 인사이트
제4장 경쟁 구도
제5장 시장 추산 및 예측 : 솔루션별(2022-2035년)
제6장 시장 추산 및 예측 : 용도별(2022-2035년)
제7장 시장 추산 및 예측 : 도입 형태별(2022-2035년)
제8장 시장 추산 및 예측 : 기업 규모별(2022-2035년)
제9장 시장 추산 및 예측 : 최종 용도별(2022-2035년)
제10장 시장 추산 및 예측 : 지역별(2022-2035년)
제11장 기업 개요
KTH 26.05.20The Global Smart Logistics Platforms Market was valued at USD 19.9 billion in 2025 and is estimated to grow at a CAGR of 17.5% to reach USD 95.1 billion by 2035.

The global smart logistics platforms industry is expanding rapidly as international trade activity continues to intensify, creating a strong need for advanced digital solutions that enhance supply chain efficiency. Businesses are increasingly adopting intelligent logistics systems to streamline operations, improve coordination, and gain real-time visibility across complex networks. These platforms play a critical role in optimizing logistics functions, enabling companies to operate with greater agility and precision. The growing reliance on digital transformation is further accelerating the integration of advanced technologies into logistics processes. As companies prioritize efficiency and scalability, smart logistics platforms are becoming essential tools for managing evolving supply chain demands. Increasing investment in technology development and the emergence of innovative solutions are reshaping the competitive landscape, positioning the global smart logistics platforms market for sustained high growth as organizations continue to modernize their logistics infrastructure.
| Market Scope | |
|---|---|
| Start Year | 2025 |
| Forecast Year | 2026-2035 |
| Start Value | $19.9 Billion |
| Forecast Value | $95.1 Billion |
| CAGR | 17.5% |
The global smart logistics platforms market is significantly influenced by the widespread adoption of digital technologies such as artificial intelligence, connected systems, and real-time data analytics. Organizations are increasingly implementing integrated platforms that automate operations and improve decision-making capabilities. Continuous investment in technology development is further strengthening platform capabilities, enabling improved operational efficiency, enhanced route planning, and better overall system performance. The rising number of new entrants introducing advanced solutions is also contributing to the market's dynamic growth environment.
The standalone segment accounted for 61.2% share in 2025, generating USD 12.2 billion. This segment continues to lead due to the growing emphasis on improving end-to-end supply chain performance. Businesses are increasingly focusing on optimizing logistics networks to enhance profitability, responsiveness, and operational flexibility. The adoption of advanced analytics and intelligent systems is further supporting this trend by improving efficiency and minimizing operational challenges.
The cloud segment held a 69.1% share in 2025, reaching USD 13.7 billion. Cloud-based deployment has become the preferred approach due to its scalability, flexibility, and ability to support seamless integration across logistics networks. This model enables organizations to manage complex operations efficiently while reducing the need for extensive infrastructure investments, supporting the ongoing shift toward digital logistics ecosystems.
U.S. Smart Logistics Platforms Market reached USD 7.5 billion in 2025 and is projected to grow at a CAGR of 17.5% through 2035. Growth in the United States is supported by the scale and maturity of its logistics sector, along with increasing demand for efficient and technology-driven solutions. Companies are leveraging smart logistics platforms to enhance operational visibility and improve cost efficiency, enabling more proactive and strategic supply chain management.
Key players operating in the Global Smart Logistics Platforms Market include Alpega, Blue Yonder, Descartes Systems, Honeywell, Infor, LogiNext Mile, Magaya Supply Chain, Manhattan Associates, Oracle, and SAP. Companies in the Global Smart Logistics Platforms Market are strengthening their position through continuous innovation and strategic investments in advanced technologies. They are focusing on integrating artificial intelligence, real-time analytics, and automation capabilities into their platforms to enhance operational efficiency and customer value. Strategic partnerships and acquisitions are being used to expand technological capabilities and geographic reach. Many firms are also prioritizing cloud-based solutions to improve scalability and flexibility. In addition, companies are investing in user-friendly interfaces and customized solutions to meet diverse client needs. Strengthening cybersecurity measures and expanding service offerings further enable companies to build trust and maintain a competitive advantage in the rapidly evolving logistics technology landscape.
Table of Contents
Chapter 1 Methodology
- 1.1 Research approach
- 1.2 Quality Commitments
- 1.2.1 GMI AI policy & data integrity commitment
- 1.3 Research Trail & Confidence Scoring
- 1.3.1 Research Trail Components
- 1.3.2 Scoring Components
- 1.4 Data Collection
- 1.5 Data mining sources
- 1.5.1 Paid sources
- 1.6 Base estimates and calculations
- 1.6.1 Base year calculation for any one approach
- 1.7 Forecast
- 1.7.1 Quantified market impact analysis
- 1.8 Research transparency addendum
- 1.8.1 Source attribution framework
- 1.8.2 Quality assurance metrics
- 1.8.3 Our commitment to trust
Chapter 2 Executive Summary
- 2.1 Industry 360° synopsis
- 2.2 Key market trends
- 2.2.1 Regional
- 2.2.2 Solution
- 2.2.3 Application
- 2.2.4 Deployment mode
- 2.2.5 Enterprise size
- 2.2.6 End use
- 2.3 TAM analysis, 2026-2035
- 2.4 CXO perspectives: Strategic imperatives
Chapter 3 Industry Insights
- 3.1 Industry ecosystem analysis
- 3.1.1 Supplier landscape
- 3.1.2 Profit margin
- 3.1.3 Cost structure
- 3.1.4 Value addition at each stage
- 3.1.5 Factor affecting the value chain
- 3.1.6 Disruptions
- 3.2 Industry impact forces
- 3.2.1 Growth drivers
- 3.2.1.1 Rapid growth of e-commerce & omnichannel retail
- 3.2.1.2 Rising customer expectations for real-time visibility
- 3.2.1.3 Pressure to reduce operational costs & improve efficiency
- 3.2.1.4 Labor shortages & need for automation
- 3.2.2 Industry pitfalls and challenges
- 3.2.2.1 High implementation costs & long ROI timelines
- 3.2.2.2 Integration challenges with legacy IT infrastructure
- 3.2.3 Market opportunities
- 3.2.3.1 AI-powered autonomous decision-making systems
- 3.2.3.2 Blockchain for supply chain transparency & traceability
- 3.2.3.3 Last-mile delivery optimization for urban logistics
- 3.2.1 Growth drivers
- 3.3 Growth potential analysis
- 3.4 Regulatory landscape
- 3.4.1 North America
- 3.4.1.1 US - Federal Motor Carrier Safety Administration (FMCSA)
- 3.4.1.2 Canada - Transport Canada
- 3.4.2 Europe
- 3.4.2.1 EU - European Commission
- 3.4.2.2 Europe - European Maritime Safety Agency
- 3.4.3 Asia Pacific
- 3.4.3.1 China - Ministry of Transport of the People's Republic of China
- 3.4.3.2 India - Ministry of Road Transport and Highways
- 3.4.4 Latin America
- 3.4.4.1 Brazil - National Land Transport Agency
- 3.4.4.2 Mexico - Secretariat of Infrastructure, Communications and Transportation
- 3.4.5 Middle East & Africa
- 3.4.5.1 Saudi Arabia - Saudi Transport General Authority
- 3.4.5.2 South Africa - Department of Transport South Africa
- 3.4.1 North America
- 3.5 Investment & funding analysis
- 3.6 Porter’s analysis
- 3.7 PESTEL analysis
- 3.8 Technology and innovation landscape
- 3.8.1 Current technologies
- 3.8.1.1 Internet of Things (IoT)
- 3.8.1.2 Cloud Computing
- 3.8.1.3 Big Data Analytics
- 3.8.2 Emerging technologies
- 3.8.2.1 Blockchain
- 3.8.2.2 Digital Twin
- 3.8.2.3 Autonomous Vehicles integration
- 3.8.1 Current technologies
- 3.9 Pricing Analysis (Driven by Primary Research)
- 3.9.1 Historical Price Trend Analysis
- 3.9.2 Pricing Strategy by Player Type (Premium / Value / Cost-plus)
- 3.10 Patent landscape (Driven by Primary Research)
- 3.11 Use case analysis
- 3.12 Implementation & integration architecture
- 3.12.1 System integration patterns & methodologies
- 3.12.2 Legacy system modernization strategies
- 3.12.3 API architecture & middleware solutions
- 3.12.4 Change management & organizational readiness
- 3.13 Interoperability & open ecosystems
- 3.13.1 Industry standards & protocols (EDI, API standards)
- 3.13.2 Multi-vendor integration challenges
- 3.13.3 Open-source vs. Proprietary platforms
- 3.13.4 Platform ecosystem & partner networks
- 3.14 Impact of AI & Generative AI on the Market
- 3.14.1 AI-driven disruption of existing business models
- 3.14.2 GenAI use cases & adoption roadmap by segment
- 3.14.3 Risks, limitations & regulatory considerations
- 3.15 Forecast assumptions & scenario analysis (Driven by Primary Research)
- 3.15.1 Base Case - key macro & industry variables driving CAGR
- 3.15.2 Optimistic Scenarios - Favorable macro and industry tailwinds
- 3.15.3 Pessimistic Scenario - Macroeconomic slowdown or industry headwinds
Chapter 4 Competitive Landscape, 2025
- 4.1 Introduction
- 4.2 Company market share analysis
- 4.2.1 North America
- 4.2.2 Europe
- 4.2.3 Asia Pacific
- 4.2.4 LATAM
- 4.2.5 MEA
- 4.3 Competitive analysis of major market players
- 4.4 Competitive positioning matrix
- 4.5 Key developments
- 4.5.1 Mergers & acquisitions
- 4.5.2 Partnerships & collaborations
- 4.5.3 New product launches
- 4.5.4 Expansion plans and funding
- 4.6 Company tier benchmarking
- 4.6.1 Tier classification criteria & qualifying thresholds
- 4.6.2 Tier positioning matrix by revenue, geography & innovation
Chapter 5 Market Estimates & Forecast, By Solution, 2022 - 2035 ($Mn)
- 5.1 Key trends
- 5.2 Standalone
- 5.2.1 Single-function warehouse management platforms
- 5.2.2 Single-function transportation management platforms
- 5.2.3 Single-function fleet tracking platforms
- 5.3 Integrated
Chapter 6 Market Estimates & Forecast, By Application, 2022 - 2035 ($Mn)
- 6.1 Key trends
- 6.2 Transportation management
- 6.3 Last-mile delivery management
- 6.4 Warehouse management
- 6.5 Inventory management & tracking
- 6.6 Fleet & asset management
- 6.7 Supply chain visibility & orchestration
- 6.8 Others
Chapter 7 Market Estimates & Forecast, By Deployment mode, 2022 - 2035 ($Mn)
- 7.1 Key trends
- 7.2 On-premises
- 7.3 Cloud
- 7.3.1 Private cloud
- 7.3.2 Public cloud
- 7.4 Hybrid
Chapter 8 Market Estimates & Forecast, By Enterprise size, 2022 - 2035 ($Mn)
- 8.1 Key trends
- 8.2 Small & medium enterprises (SMEs)
- 8.3 Large enterprises
Chapter 9 Market Estimates & Forecast, By End use, 2022 - 2035 ($Mn)
- 9.1 Key trends
- 9.2 Retail & e-commerce
- 9.3 Manufacturing
- 9.4 Third party logistics (3PL)
- 9.5 Food & beverage
- 9.6 Pharmaceuticals & healthcare
- 9.7 Automotive
- 9.8 Chemical
- 9.9 Others
Chapter 10 Market Estimates & Forecast, By Region, 2022 - 2035 ($Mn)
- 10.1 Key trends
- 10.2 North America
- 10.2.1 US
- 10.2.2 Canada
- 10.3 Europe
- 10.3.1 Germany
- 10.3.2 UK
- 10.3.3 France
- 10.3.4 Italy
- 10.3.5 Spain
- 10.3.6 Sweden
- 10.3.7 Czech Republic
- 10.3.8 Russia
- 10.4 Asia Pacific
- 10.4.1 China
- 10.4.2 Japan
- 10.4.3 South Korea
- 10.4.4 India
- 10.4.5 Australia
- 10.4.6 Singapore
- 10.4.7 Vietnam
- 10.4.8 Indonesia
- 10.4.9 Malaysia
- 10.5 Latin America
- 10.5.1 Brazil
- 10.5.2 Mexico
- 10.5.3 Argentina
- 10.5.4 Chile
- 10.6 MEA
- 10.6.1 South Africa
- 10.6.2 Saudi Arabia
- 10.6.3 UAE
Chapter 11 Company Profiles
- 11.1 Global players
- 11.1.1 Manhattan Associates
- 11.1.2 SAP
- 11.1.3 Oracle
- 11.1.4 Blue Yonder
- 11.1.5 Uber Freight
- 11.1.6 Kinaxis
- 11.1.7 E2open
- 11.1.8 Infor
- 11.1.9 Descartes Systems
- 11.1.10 Magaya Supply Chain
- 11.2 Regional players
- 11.2.1 Project44
- 11.2.2 FourKites
- 11.2.3 C.H. Robinson
- 11.2.4 XPO Logistics
- 11.2.5 Trimble
- 11.2.6 Transporeon
- 11.3 Emerging players
- 11.3.1 Samsara
- 11.3.2 Alpega
- 11.3.3 Flexport
- 11.3.4 Loadsmart
