
|
시장보고서
상품코드
2027513
핀치 튜브 밸브 : 시장 기회, 성장 촉진요인, 업계 동향 분석 및 예측(2026-2035년)Pinch Tube Valve Market Opportunity, Growth Drivers, Industry Trend Analysis, and Forecast 2026 - 2035 |
||||||
세계의 핀치 튜브 밸브 시장은 2025년에 6억 3,660만 달러로 평가되었고 CAGR 5.1%를 나타내 2035년까지 10억 4,000만 달러에 이를 것으로 추정되고 있습니다.
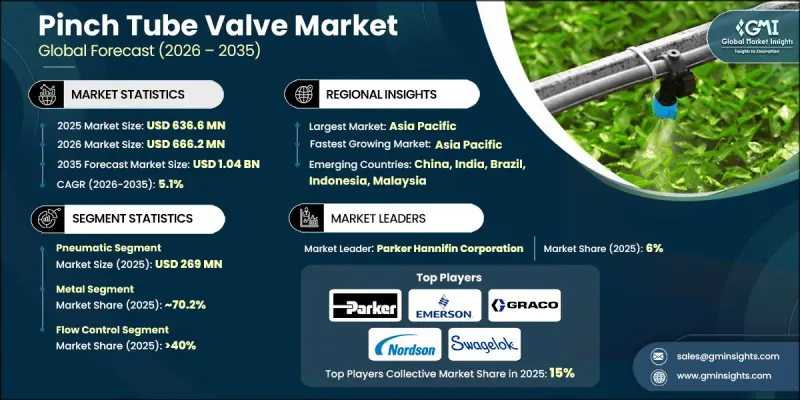
시장 성장은 무공해 처리에 대한 수요 증가, 산업 자동화의 급속한 발전, 엄격한 규제를 받는 제조 부문의 지속적인 발전으로 인해 주도되고 있습니다. 핀치 튜브 밸브는 유연한 엘라스토머 슬리브를 사용하여 공정 매체를 격리하도록 설계되어 누출 위험을 최소화하고, 유지보수 요구 사항을 줄이며, 작동 신뢰성을 보장합니다. 이러한 특성으로 인해 위생과 정밀도가 매우 중요한 환경에 특히 적합합니다. 유지보수 절차를 간소화하면서 안정적인 성능을 발휘하는 이 밸브의 능력은 밸브의 채택을 더욱 촉진하고 있습니다. 또한, 운영 효율성과 공정 최적화에 대한 관심이 높아짐에 따라 각 산업계는 첨단 밸브 기술의 도입을 촉진하고 있으며, 세계 핀치 튜브 밸브 시장은 현대 유체 처리 시스템에서 중요한 구성 요소로 자리매김하고 있습니다.
| 시장 범위 | |
|---|---|
| 시작 연도 | 2025년 |
| 예측 기간 | 2026-2035년 |
| 개시 연도 시장 규모 | 6억 3,660만 달러 |
| 예측액 | 10억 4,000만 달러 |
| CAGR | 5.1% |
엄격한 규제가 적용되는 산업 분야에서 위생적이고 신뢰할 수 있는 유체 처리 시스템의 필요성이 증가하고 있습니다. 규정 준수 요건에 따라 오염을 방지하고 가공 공정 전반에 걸쳐 제품의 무결성을 보장하는 장비를 사용해야 합니다. 핀치 튜브 밸브는 유체가 내부 슬리브와만 접촉하도록 함으로써 오염 위험을 크게 줄여 이러한 기대에 부응하고 있습니다. 이 설계는 세척 절차를 간소화하고, 확립된 규제 표준을 준수하는 동시에 전체 공정의 효율성을 향상시킵니다.
2025년에는 금속 부문이 70.2%의 점유율을 차지했습니다. 이러한 압도적인 점유율은 가혹한 산업 응용 분야에서 금속 밸브 구조가 널리 채택되고 있음을 반영합니다. 스테인리스 스틸, 알루미늄, 특수 합금 등의 재질로 만들어진 밸브는 고압, 고온, 부식성 물질에 노출되는 극한의 작동 조건에 대한 높은 내성을 발휘합니다. 내구성과 구조적 무결성으로 인해 복잡한 산업 환경에서 최적의 선택이 될 수 있습니다.
2025년 기준, 유량 제어 부문은 40%의 점유율을 차지하며 세계 핀치 튜브 밸브 시장의 주요 응용 분야가 되었습니다. 이 밸브는 내부 슬리브의 압축을 조정하여 유량을 제어하는 데 널리 사용되며, 정확하고 일관된 유체 관리를 가능하게 합니다. 이 기능은 신뢰성과 재현성이 높은 유량 제어가 필요한 공정에서 정밀한 제어를 지원합니다. 자동 제어 및 비례 제어 기능을 갖춘 고급 시스템은 성능을 더욱 향상시키고 최신 공정 제어 시스템과의 원활한 통합을 가능하게 합니다.
아시아태평양의 핀치 튜브 밸브 시장은 2025년에 30%의 점유율을 차지했으며, 급속한 산업 발전, 제조 능력 확대, 인프라 투자 증가에 힘입어 2026년부터 2035년까지 연평균 복합 성장률(CAGR) 5.3%를 나타낼 것으로 예측됩니다. 다양한 산업 분야의 다양한 산업 기반은 첨단 유체 제어 솔루션에 대한 견고한 수요를 지속적으로 창출하고 있습니다. 산업의 품질 향상과 제조업의 성장을 가속하기 위한 정부의 지원책은 최신 밸브 기술의 채택을 더욱 촉진하여 시장의 지속적인 확대에 기여하고 있습니다.
자주 묻는 질문
목차
제1장 조사 방법과 범위
제2장 주요 요약
제3장 업계 인사이트
제4장 경쟁 구도
제5장 시장 추산 및 예측 : 유형별(2022-2035년)
제6장 시장 추산 및 예측 : 재료별(2022-2035년)
제7장 시장 추산 및 예측 : 기능별(2022-2035년)
제8장 시장 추산 및 예측 : 최종 이용 산업별(2022-2035년)
제9장 시장 추산 및 예측 : 유통 채널별(2022-2035년)
제10장 시장 추산 및 예측 : 지역별(2022-2035년)
제11장 기업 개요
KTH 26.05.20The Global Pinch Tube Valve Market was valued at USD 636.6 million in 2025 and is estimated to grow at a CAGR of 5.1% to reach USD 1.04 billion by 2035.

Market growth is driven by the increasing need for contamination-free processing, rapid progress in industrial automation, and the ongoing development of highly regulated manufacturing sectors. Pinch tube valves are designed to isolate process media using flexible elastomer sleeves, which help minimize leakage risks, reduce maintenance requirements, and ensure operational reliability. These features make them particularly suitable for environments where hygiene and precision are critical. The ability of these valves to deliver consistent performance while simplifying maintenance procedures further supports their adoption. In addition, the growing focus on operational efficiency and process optimization is encouraging industries to integrate advanced valve technologies, positioning the global pinch tube valve market as a key component in modern fluid handling systems.
| Market Scope | |
|---|---|
| Start Year | 2025 |
| Forecast Year | 2026-2035 |
| Start Value | $636.6 Million |
| Forecast Value | $1.04 Billion |
| CAGR | 5.1% |
Strict regulatory frameworks across highly controlled industries are reinforcing the need for hygienic and reliable fluid handling systems. Compliance requirements mandate the use of equipment that prevents contamination and ensures product integrity throughout processing stages. Pinch tube valves meet these expectations by allowing fluids to interact only with the internal sleeve, significantly reducing the risk of contamination. This design simplifies cleaning procedures and enhances adherence to established regulatory standards, while also improving overall process efficiency.
The metal segment accounted for 70.2% share in 2025. This dominance reflects the widespread use of metal-based valve constructions in demanding industrial applications. Valves made from materials such as stainless steel, aluminum, and specialized alloys offer strong resistance to extreme operating conditions, including high pressure, elevated temperatures, and exposure to aggressive substances. Their durability and structural integrity make them a preferred choice for complex industrial environments.
The flow control segment held 40% share in 2025, making it the primary application area within the global pinch tube valve market. These valves are widely used for regulating flow rates by adjusting the compression of the internal sleeve, allowing for accurate and consistent fluid management. This capability supports precise control in processes that require reliable and repeatable flow regulation. Advanced systems with automated and proportional control features further enhance performance, enabling seamless integration with modern process control systems.
Asia Pacific Pinch Tube Valve Market held 30% share in 2025 and is anticipated to grow at a CAGR of 5.3% from 2026 to 2035, driven by rapid industrial development, expanding manufacturing capacity, and increasing infrastructure investments. A diverse industrial base across multiple sectors continues to generate strong demand for advanced fluid control solutions. Supportive government initiatives aimed at improving industrial quality and promoting manufacturing growth are further encouraging the adoption of modern valve technologies, contributing to sustained market expansion.
Key companies operating in the Global Pinch Tube Valve Market include Badger Meter, Burkert Fluid Control Systems, ControlAir, Crane, Emerson Electric, Festo, Gore, Graco, Kitz Corporation, Nordson Corporation, Omega Engineering, Parker Hannifin Corporation, Pentair, Schneider Electric, and Swagelok Company. Companies in the Global Pinch Tube Valve Market are implementing strategic initiatives to strengthen their competitive positioning and expand their global presence. A strong emphasis is placed on research and development to enhance product performance, durability, and compatibility with advanced industrial systems. Manufacturers are investing in automation and smart technologies to improve precision and operational efficiency. Strategic partnerships and collaborations are being pursued to expand distribution networks and improve customer reach. Companies are also focusing on offering customized solutions tailored to specific industry requirements, which helps build long-term client relationships.
Table of Contents
Chapter 1 Methodology and Scope
- 1.1 Market scope and definition
- 1.2 Research design
- 1.2.1 Research approach
- 1.2.2 Data collection methods
- 1.3 Data mining sources
- 1.3.1 Global
- 1.3.2 Regional/Country
- 1.4 Base estimates and calculations
- 1.4.1 Base year calculation
- 1.4.2 Key trends for market estimation
- 1.5 Primary research and validation
- 1.5.1 Primary sources
- 1.6 Forecast model
- 1.7 Research assumptions and limitations
Chapter 2 Executive Summary
- 2.1 Industry 360° synopsis
- 2.2 Key market trends
- 2.2.1 Regional
- 2.2.2 Type
- 2.2.3 Function
- 2.2.4 End use industry
- 2.2.5 Distribution channel
Chapter 3 Industry Insights
- 3.1 Industry ecosystem analysis
- 3.1.1 Supplier landscape
- 3.1.2 Profit margin
- 3.1.3 Value addition at each stage
- 3.1.4 Factor affecting the value chain
- 3.2 Industry impact forces
- 3.2.1 Growth drivers
- 3.2.1.1 Demand for contamination-free fluid control
- 3.2.1.2 Industrial automation and process control requirements
- 3.2.1.3 Cost-effectiveness and maintenance efficiency
- 3.2.2 Industry pitfalls & challenges
- 3.2.2.1 Installation and operational cost considerations
- 3.2.2.2 Seasonal demand fluctuations
- 3.2.3 Opportunities
- 3.2.3.1 Smart valve development with predictive maintenance
- 3.2.3.2 Bio-based & sustainable elastomer materials
- 3.2.1 Growth drivers
- 3.3 Growth potential analysis
- 3.4 Future market trends
- 3.5 Technology and innovation landscape
- 3.5.1 Current technological trends
- 3.5.2 Emerging technologies
- 3.6 Pricing analysis (Driven by Primary Research)
- 3.6.1 Historical price trend analysis (Driven by Primary Research)
- 3.6.2 Pricing strategy by player type (premium / value / cost-plus) (Driven by Primary Research)
- 3.6.3 Price variation by valve type & material
- 3.7 Regulatory landscape
- 3.8 Porter’s analysis
- 3.9 PESTEL analysis
- 3.10 Trade Data Analysis (Driven by Paid Data Base)
- 3.10.1 Import/export volume & value trends (Driven by Paid Data Base)
- 3.10.2 Key trade corridors & tariff impact (Driven by Paid Data Base)
- 3.10.3 Trade flow by region & HS code classification
- 3.11 Impact of AI & generative AI on the market
- 3.11.1 AI-driven disruption of existing business models
- 3.11.2 GenAI use cases & adoption roadmap by segment
- 3.11.3 Risks, limitations & regulatory considerations
- 3.12 Capacity & production landscape (Driven by Primary Research)
- 3.12.1 Installed capacity by region & key producer (Driven by Primary Research)
- 3.12.2 Capacity utilization rates & expansion pipelines (Driven by Primary Research)
Chapter 4 Competitive Landscape, 2025
- 4.1 Introduction
- 4.2 Company market share analysis
- 4.2.1 By region
- 4.2.1.1 North America
- 4.2.1.2 Europe
- 4.2.1.3 Asia Pacific
- 4.2.1.4 Latin America
- 4.2.1.5 Middle East and Africa
- 4.2.1 By region
- 4.3 Competitive analysis of major market players
- 4.4 Competitive positioning matrix
- 4.5 Key developments
- 4.5.1 Mergers & acquisitions
- 4.5.2 Partnerships & collaborations
- 4.5.3 New product launches
- 4.5.4 Expansion plans
Chapter 5 Market Estimates and Forecast, By Type, 2022 - 2035 (USD Million) (Thousand Units)
- 5.1 Key trends
- 5.2 Manual
- 5.3 Pneumatic
- 5.4 Automatic
- 5.5 Electric
Chapter 6 Market Estimates and Forecast, By Material, 2022 - 2035 (USD Million) (Thousand Units)
- 6.1 Key trends
- 6.2 Metal
- 6.3 Plastic/Polymer (PVC, PP, PVDF)
- 6.4 Others
Chapter 7 Market Estimates and Forecast, By Function, 2022 - 2035 (USD Million) (Thousand Units)
- 7.1 Key trends
- 7.2 Flow control
- 7.3 Shut-off
- 7.4 Others
Chapter 8 Market Estimates and Forecast, By End-Use Industry, 2022 - 2035 (USD Million) (Thousand Units)
- 8.1 Key trends
- 8.2 Chemical & petrochemical
- 8.3 Food and beverage
- 8.4 Pharmaceutical & biotechnology
- 8.5 Water & wastewater treatment
- 8.6 Mining & minerals
- 8.7 Pulp & paper
- 8.8 Oil and gas
- 8.9 Others (ceramics, textiles, agriculture, power generation)
Chapter 9 Market Estimates and Forecast, By Distribution Channel, 2022 - 2035 (USD Million) (Thousand Units)
- 9.1 Key trends
- 9.2 Direct sales
- 9.3 Indirect sales
Chapter 10 Market Estimates and Forecast, By Region, 2022 - 2035 (USD Million) (Thousand Units)
- 10.1 Key trends
- 10.2 North America
- 10.2.1 U.S.
- 10.2.2 Canada
- 10.3 Europe
- 10.3.1 Germany
- 10.3.2 UK
- 10.3.3 France
- 10.3.4 Italy
- 10.3.5 Spain
- 10.4 Asia Pacific
- 10.4.1 China
- 10.4.2 Japan
- 10.4.3 India
- 10.4.4 Australia
- 10.4.5 South Korea
- 10.5 Latin America
- 10.5.1 Brazil
- 10.5.2 Mexico
- 10.5.3 Argentina
- 10.6 Middle East and Africa
- 10.6.1 South Africa
- 10.6.2 Saudi Arabia
- 10.6.3 UAE
Chapter 11 Company Profiles
- 11.1 Badger Meter
- 11.2 Burkert Fluid Control Systems
- 11.3 ControlAir
- 11.4 Crane
- 11.5 Emerson Electric
- 11.6 Festo
- 11.7 Gore
- 11.8 Graco
- 11.9 Kitz Corporation
- 11.10 Nordson Corporation
- 11.11 Omega Engineering
- 11.12 Parker Hannifin Corporation
- 11.13 Pentair
- 11.14 Schneider Electric
- 11.15 Swagelok Company

