
|
시장보고서
상품코드
2027536
자동차용 헤드업 디스플레이(HUD) : 시장 기회, 성장 촉진요인, 업계 동향 분석 및 예측(2026-2035년)Automotive HUD (Head-up Displays) Market Opportunity, Growth Drivers, Industry Trend Analysis, and Forecast 2026 - 2035 |
||||||
세계의 자동차용 헤드업 디스플레이(HUD) 시장은 2025년에 11억 달러로 평가되었고, 2035년까지 연평균 복합 성장률(CAGR) 21.1%를 나타내 74억 달러에 이를 것으로 추정되고 있습니다.
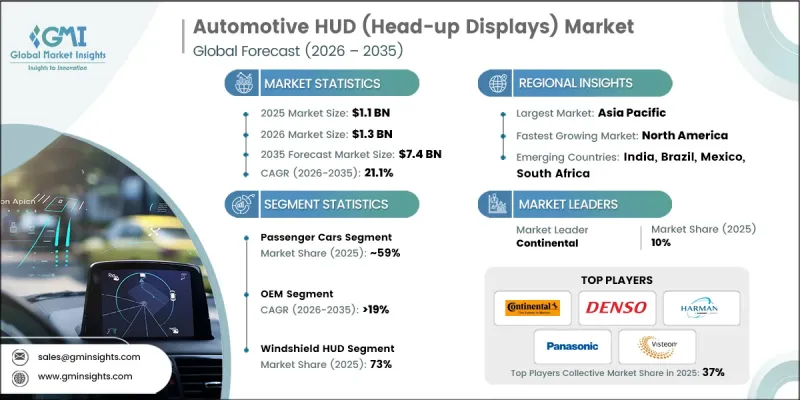
첨단 운전자 보조 시스템(ADAS)의 급속한 보급이 HUD 수요를 견인하고 있습니다. 이 디스플레이는 속도, 내비게이션, 잠재적 위험에 대한 실시간 정보를 제공하여 운전자의 인식과 안전성을 향상시키기 위한 것입니다. 자동차 제조업체들은 직관적이고 운전 중 방해가 되지 않는 인터페이스를 원하는 소비자의 기대에 부응하기 위해 미들급 및 프리미엄 차량에 HUD를 탑재하고 있습니다. 증강현실(AR) HUD 기술의 발전으로 내비게이션, 차선 유도, 위험 경보가 운전자의 시야에 직접 겹쳐서 표시되어 차량 내 경험을 향상시키고 있습니다. 이 몰입감 있는 인터페이스는 깊이 인식과 반응 시간을 개선합니다. HUD의 기술 혁신은 보다 정확하고 확장성이 높으며 상업적으로 실현 가능한 솔루션을 만들어내고 있습니다. 커넥티드카와 전기차의 등장으로 디지털 콕핏 솔루션의 도입이 더욱 가속화되고 있으며, HUD는 배터리 상태, 항속거리, 내비게이션 정보를 효율적으로 제공하기 위한 필수적인 구성 요소로 자리매김하고 있습니다.
| 시장 범위 | |
|---|---|
| 시작 연도 | 2025년 |
| 예측 기간 | 2026-2035년 |
| 개시 금액 | 11억 달러 |
| 예측 금액 | 74억 달러 |
| CAGR | 21.1% |
승용차 부문은 59%의 점유율을 차지하고 있으며, 2026년부터 2035년까지 연평균 복합 성장률(CAGR) 21%를 유지할 것으로 예측됩니다. 안전, 편의성, 프리미엄 기능에 대한 소비자의 요구가 승용차 HUD의 채택을 촉진하고 있습니다. HUD는 운전자가 도로에 집중하면서 중요한 정보에 접근할 수 있도록 도와주기 때문에 중급 및 고급 차량에서 인기가 높아지고 있습니다. 승용차 전체에 프리미엄 기술을 통합하는 추세에 따라 자동차 제조업체들은 HUD를 표준 또는 옵션으로 제공합니다.
OEM(주문자상표부착생산) 부문은 2025년 83%의 점유율을 차지했으며, 2035년까지 연평균 복합 성장률(CAGR) 19%를 나타낼 것으로 예측됩니다. OEM 업체들은 경쟁이 치열한 시장에서 차량 차별화를 위해 HUD를 확대 적용하고 있으며, 브랜드 이미지 향상과 프리미엄 미래형 경험을 제공합니다. 또한, HUD는 첨단 운전자 보조 시스템(ADAS)와 연동하여 충돌 경고, 차선이탈 경고 등 실시간 경고를 표시함으로써 운전자의 반응 속도를 향상시켜 차량의 안전성을 높이고 있습니다.
미국의 자동차 헤드업 디스플레이(HUD) 시장은 90%의 점유율을 차지하며, 2025년 2억 6,570만 달러 시장 규모를 기록했습니다. 기술적으로 진보하고 안전한 차량에 대한 높은 수요가 미국 내 HUD 채택을 촉진하고 있으며, 특히 고급차와 SUV에서 두드러지게 나타나고 있습니다. 소비자들은 편안함, 편의성, 그리고 운전 경험을 향상시키는 기능을 원하고 있으며, 자동차 제조업체들은 HUD를 탑재할 수밖에 없는 상황에 처해 있습니다. 운전자의 안전을 향상시키기 위한 규제 압력도 이 지역 시장 성장을 더욱 촉진하고 있습니다.
자주 묻는 질문
목차
제1장 조사 방법
제2장 주요 요약
제3장 업계 인사이트
제4장 경쟁 구도
제5장 시장 추산 및 예측 : 차량별(2022-2035년)
제6장 시장 추산 및 예측 : 디스플레이별(2022-2035년)
제7장 시장 추산 및 예측 : 기술별(2022-2035년)
제8장 시장 추산 및 예측 : 구성 요소별(2022-2035년)
제9장 시장 추산 및 예측 : 디스플레이 사이즈별(2022-2035년)
제10장 시장 추산 및 예측 : 판매 채널별(2022-2035년)
제11장 시장 추산 및 예측 : 지역별(2022-2035년)
제12장 기업 개요
KTH 26.05.20The Global Automotive Head-Up Display (HUD) Market was valued at USD 1.1 billion in 2025 and is estimated to grow at a CAGR of 21.1% to reach USD 7.4 billion by 2035.

The rapid adoption of advanced driver assistance systems (ADAS) is driving the demand for HUDs, as these displays provide real-time information on speed, navigation, and potential hazards, improving driver awareness and safety. Automakers are integrating HUDs into mid-range and premium vehicles to meet consumer expectations for intuitive, distraction-free interfaces. The evolution of augmented reality HUD technology is enhancing in-vehicle experiences by overlaying navigation, lane guidance, and hazard alerts directly onto the driver's field of view. This immersive interface improves depth perception and reaction time. HUD innovation has resulted in more accurate, scalable, and commercially viable solutions. The rise of connected and electric vehicles has further accelerated the adoption of digital cockpit solutions, positioning HUDs as essential components for delivering battery status, range, and navigation information efficiently.
| Market Scope | |
|---|---|
| Start Year | 2025 |
| Forecast Year | 2026-2035 |
| Start Value | $1.1 Billion |
| Forecast Value | $7.4 Billion |
| CAGR | 21.1% |
The passenger car segment held a 59% share and is projected to maintain a CAGR of 21% from 2026 to 2035. Consumer demand for safety, convenience, and premium features drives HUD adoption in passenger vehicles. HUDs allow drivers to access critical information while keeping their focus on the road, boosting popularity in mid-range and luxury cars. The trend of integrating premium technologies across passenger vehicles is encouraging automakers to offer HUDs as standard or optional features.
The original equipment manufacturers (OEMs) segment held 83% share in 2025, expected to grow at a CAGR of 19% through 2035. OEMs are increasingly using HUDs to differentiate vehicles in competitive markets, enhancing brand image and delivering a premium, futuristic experience. HUDs are also integrated with ADAS systems to display real-time alerts such as collision warnings and lane departure signals, improving driver response and vehicle safety.
U.S. Automotive Head-Up Display (HUD) Market held a 90% share, generating USD 265.7 million in 2025. High demand for technologically advanced and safe vehicles is driving HUD adoption in the U.S., particularly in premium cars and SUVs. Consumers are seeking features that enhance comfort, convenience, and driving experience, compelling automakers to include HUDs. Regulatory pressure to improve driver safety further supports market growth in the region.
Key players operating in the Global Automotive HUD (Head-up Displays) Market include Continental, Panasonic, Harman International, Denso, Bosch, Valeo, Visteon, Garmin, Hyundai Mobis, and Nippon Seiki. Companies in the Automotive HUD (Head-up Displays) Market are strengthening their positions by investing in R&D to improve augmented reality and projection technologies, enhancing clarity, accuracy, and scalability. Collaborations with automakers enable seamless integration of HUDs into next-generation vehicles. Firms are also focusing on expanding their product portfolios to cater to mid-range and premium vehicle segments. Strategic partnerships, joint ventures, and technology licensing agreements are being used to access new markets, accelerate innovation, and maintain a competitive edge. Additionally, companies are emphasizing smart cockpit integration and connected vehicle solutions to align with the growing EV and autonomous vehicle ecosystem, reinforcing their market presence globally.
Table of Contents
Chapter 1 Methodology
- 1.1 Research approach
- 1.2 Quality Commitments
- 1.2.1 GMI AI policy & data integrity commitment
- 1.2.1.1 Source consistency protocol
- 1.2.1 GMI AI policy & data integrity commitment
- 1.3 Research Trail & Confidence Scoring
- 1.3.1 Research Trail Components
- 1.3.2 Scoring Components
- 1.4 Data Collection
- 1.4.1 Partial list of primary sources
- 1.5 Data mining sources
- 1.5.1 Paid sources
- 1.5.2 Sources, by region
- 1.6 Base estimates and calculations
- 1.6.1 Base year calculation for any one approach
- 1.7 Forecast model
- 1.7.1 Quantified market impact analysis
- 1.7.1.1 Mathematical impact of growth parameters on forecast
- 1.7.1 Quantified market impact analysis
- 1.8 Research transparency addendum
- 1.8.1 Source attribution framework
- 1.8.2 Quality assurance metrics
- 1.8.3 Our commitment to trust
Chapter 2 Executive Summary
- 2.1 Industry 360° synopsis, 2022 - 2035
- 2.2 Key market trends
- 2.2.1 Regional
- 2.2.2 Vehicle
- 2.2.3 Display
- 2.2.4 Technology
- 2.2.5 Component
- 2.2.6 Display Size
- 2.2.7 Sales Channel
- 2.3 TAM Analysis, 2026-2035
- 2.4 CXO perspectives: Strategic imperatives
Chapter 3 Industry Insights
- 3.1 Industry ecosystem analysis
- 3.1.1 Supplier landscape
- 3.1.2 Profit margin analysis
- 3.1.3 Cost structure
- 3.1.4 Value addition at each stage
- 3.1.5 Factor affecting the value chain
- 3.1.6 Disruptions
- 3.2 Industry impact forces
- 3.2.1 Growth drivers
- 3.2.1.1 Rising demand for advanced driver assistance systems (ADAS)
- 3.2.1.2 Growing premium and luxury vehicle sales
- 3.2.1.3 Technological advancements in AR-based HUDs
- 3.2.1.4 Increasing focus on driver safety and regulations
- 3.2.2 Industry pitfalls and challenges
- 3.2.2.1 High system cost and integration complexity
- 3.2.2.2 Limited adoption in entry-level vehicles
- 3.2.2.3 Visibility issues in certain lighting conditions
- 3.2.2.4 Windshield compatibility and design constraints
- 3.2.3 Market opportunities
- 3.2.3.1 Expansion of AR-HUD technology
- 3.2.3.2 Rising electric and autonomous vehicles
- 3.2.3.3 Growth in emerging markets
- 3.2.3.4 Software-driven customization and UX innovation
- 3.2.1 Growth drivers
- 3.3 Growth potential analysis
- 3.4 Regulatory landscape
- 3.4.1 North America
- 3.4.1.1 Environmental Protection Agency (EPA)
- 3.4.1.2 National Highway Traffic Safety Administration (NHTSA) - FMVSS standards
- 3.4.1.3 Occupational Safety and Health Administration (OSHA)
- 3.4.1.4 Canadian Motor Vehicle Safety Standards (CMVSS)
- 3.4.1.5 State-level road safety and display regulations
- 3.4.2 Europe
- 3.4.2.1 EU general safety regulation
- 3.4.2.2 CE marking compliance
- 3.4.2.3 Low voltage directive (LVD)
- 3.4.2.4 Electromagnetic compatibility (EMC) directive
- 3.4.2.5 National vehicle homologation requirements
- 3.4.3 Asia Pacific
- 3.4.3.1 China automotive and intelligent vehicle regulatory framework
- 3.4.3.2 Indian central motor vehicle rules (CMVR)
- 3.4.3.3 Japanese road transport vehicle act
- 3.4.3.4 ASEAN vehicle safety and technology harmonization efforts
- 3.4.3.5 Australian design rules (ADR)
- 3.4.4 Latin America
- 3.4.4.1 Brazilian national traffic council (CONTRAN) regulations
- 3.4.4.2 Mexican NOM standards
- 3.4.4.3 Regional vehicle safety and digital display regulations
- 3.4.4.4 Urban mobility and intelligent transport initiatives
- 3.4.5 Middle East & Africa
- 3.4.5.1 GCC vehicle compliance and type approval regulations
- 3.4.5.2 South African national road traffic act (NRTA)
- 3.4.5.3 Regional vehicle import and safety compliance standards
- 3.4.5.4 Smart mobility and transport modernization initiatives
- 3.4.1 North America
- 3.5 Future market trends
- 3.6 Porter's analysis
- 3.7 PESTEL analysis
- 3.8 Technology and innovation landscape
- 3.8.1 Current technological trends
- 3.8.2 Emerging technologies
- 3.9 Price analysis (Driven by Primary Research)
- 3.9.1 Historical Price Trend Analysis
- 3.9.2 Pricing Strategy by Player Type (Premium / Value / Cost-plus)
- 3.10 Trade data analysis (Driven by Paid Research)
- 3.10.1 Import/export volume & value trends
- 3.10.2 Key trade corridors & tariff impact
- 3.11 Cost breakdown analysis
- 3.12 Patent analysis (Driven by Primary Research)
- 3.13 Sustainability and environmental aspects
- 3.13.1 Sustainable practices
- 3.13.2 Waste reduction strategies
- 3.13.3 Energy efficiency in production
- 3.13.4 Eco-friendly Initiatives
- 3.13.5 Carbon footprint considerations
- 3.14 Impact of AI & generative AI on the market
- 3.14.1 AI-driven disruption of existing business models
- 3.14.2 GenAI use cases & adoption roadmap by segment
- 3.14.3 Risks, limitations & regulatory considerations
- 3.15 Capacity & production landscape (Driven by Primary Research)
- 3.15.1 Installed capacity by region & key producer
- 3.15.2 Capacity utilization rates & expansion pipelines
- 3.16 Forecast assumptions & scenario analysis (Driven by Primary Research)
- 3.16.1 Base Case - key macro & industry variables driving CAGR
- 3.16.2 Optimistic Scenarios - Favorable macro and industry tailwinds
- 3.16.3 Pessimistic Scenario - Macroeconomic slowdown or industry headwinds
Chapter 4 Competitive Landscape, 2025
- 4.1 Introduction
- 4.2 Company market share analysis
- 4.2.1 North America
- 4.2.2 Europe
- 4.2.3 Asia Pacific
- 4.2.4 LATAM
- 4.2.5 MEA
- 4.3 Competitive analysis of major market players
- 4.4 Competitive positioning matrix
- 4.5 Key developments
- 4.5.1 Mergers & acquisitions
- 4.5.2 Partnerships & collaborations
- 4.5.3 New Product Launches
- 4.5.4 Expansion Plans and funding
- 4.6 Company tier benchmarking
- 4.6.1 Tier classification criteria & qualifying thresholds
- 4.6.2 Tier positioning matrix by revenue, geography & innovation
Chapter 5 Market Estimates & Forecast, By Vehicle, 2022 - 2035 ($Mn, Units)
- 5.1 Key trends
- 5.2 Passenger cars
- 5.2.1 Sedan
- 5.2.2 SUV
- 5.2.3 Hatchback
- 5.3 Commercial vehicle
- 5.3.1 LCV
- 5.3.2 MCV
- 5.3.3 HCV
- 5.4 Off highway vehicle
Chapter 6 Market Estimates & Forecast, By Display, 2022 - 2035 ($Mn, Units)
- 6.1 Key trends
- 6.2 Windshield HUD
- 6.3 Combiner HUD
Chapter 7 Market Estimates & Forecast, By Technology, 2022 - 2035 ($Mn, Units)
- 7.1 Key trends
- 7.2 Conventional HUD
- 7.3 Augmented Reality HUD
- 7.4 Holographic HUD
Chapter 8 Market Estimates & Forecast, By Component, 2022 - 2035 ($Mn, Units)
- 8.1 Key trends
- 8.2 Hardware
- 8.2.1 Display panel
- 8.2.2 Projector unit
- 8.2.3 Sensors
- 8.2.4 Others
- 8.3 Software
Chapter 9 Market Estimates & Forecast, By Display Size, 2022 - 2035 ($Mn, Units)
- 9.1 Key trends
- 9.2 Small-sized display ( 5 inches)
- 9.3 Medium-sized display (5-10 inches)
- 9.4 Large-sized display (> 10 inches)
Chapter 10 Market Estimates & Forecast, By Sales Channel, 2022 - 2035 ($Mn, Units)
- 10.1 Key trends
- 10.2 OEM
- 10.3 Aftermarket
Chapter 11 Market Estimates & Forecast, By Region, 2022 - 2035 ($Mn, Units)
- 11.1 Key trends
- 11.2 North America
- 11.2.1 US
- 11.2.2 Canada
- 11.3 Europe
- 11.3.1 UK
- 11.3.2 Germany
- 11.3.3 France
- 11.3.4 Italy
- 11.3.5 Spain
- 11.3.6 Russia
- 11.3.7 Nordics
- 11.4 Asia Pacific
- 11.4.1 China
- 11.4.2 India
- 11.4.3 Japan
- 11.4.4 South Korea
- 11.4.5 Southeast Asia
- 11.4.6 ANZ
- 11.5 Latin America
- 11.5.1 Brazil
- 11.5.2 Argentina
- 11.5.3 Mexico
- 11.6 MEA
- 11.6.1 UAE
- 11.6.2 Saudi Arabia
- 11.6.3 South Africa
Chapter 12 Company Profiles
- 12.1 Global Players
- 12.1.1 BAE Systems
- 12.1.2 Bosch
- 12.1.3 Continental
- 12.1.4 Denso
- 12.1.5 Garmin
- 12.1.6 Harman International
- 12.1.7 Hyundai Mobis
- 12.1.8 LG Electronics
- 12.1.9 Nippon Seiki
- 12.1.10 Panasonic
- 12.1.11 Valeo
- 12.1.12 Visteon
- 12.1.13 YAZAKI
- 12.2 Regional Players
- 12.2.1 Foryou
- 12.2.2 JVCKENWOOD
- 12.2.3 Kyocera
- 12.3 Emerging Players
- 12.3.1 CY Vision
- 12.3.2 Huawei
- 12.3.3 Hudway
- 12.3.4 WayRay

