|
시장보고서
상품코드
2038314
버스 시장 : 시장 기회, 성장요인, 업계 동향 분석 및 예측(2026-2035년)Bus Market Opportunity, Growth Drivers, Industry Trend Analysis, and Forecast 2026 - 2035 |
||||||

세계의 버스 시장은 2025년에 1,029억 달러로 평가되었고, CAGR 7%로 성장할 전망이며, 2035년까지 2,107억 달러에 이를 것으로 추정되고 있습니다.
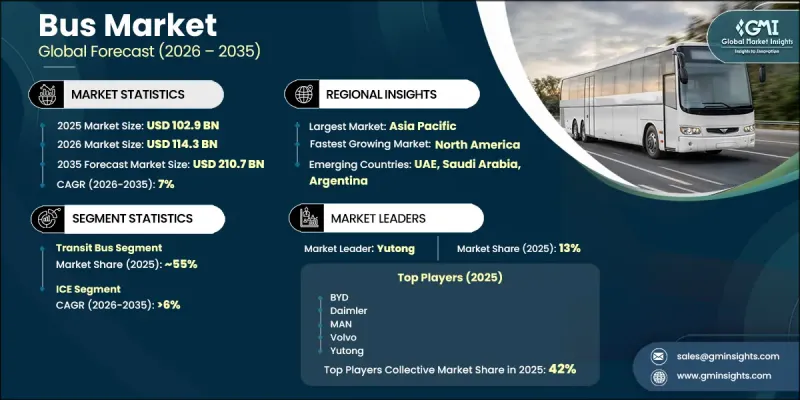
이 시장은 도시 인구 증가와 대중교통 인프라에 대한 지속적인 투자로 형성되고 있습니다. 각 도시는 접근성 향상과 교통 체증 완화를 위해 대용량 모빌리티 솔루션을 우선시하고 있으며, 이는 전체 교통 네트워크에서 버스에 대한 수요를 가속화하고 있습니다. 전기화가 핵심 테마로 떠오르고 있으며, 정책적 의무화와 비용 효율성 향상에 힘입어 배터리 전기버스가 많은 지역에서 빠르게 보급되고 있습니다. 배터리용량 증가와 첨단 에너지 관리 시스템 등 차량 성능의 향상으로 운영상의 실현 가능성이 높아지고 있습니다. 동시에 장거리 노선에는 수소 연료 버스와 같은 대체 수단이 등장하고 있습니다. 배터리 비용의 하락과 정부의 지원책으로 기존 버스와 무공해 버스의 비용 격차가 줄어들고 있으며, 투자수익률(ROI)이 향상되고 있습니다. 개발도상국에서의 가격의 경제성 향상도 도입을 더욱 촉진하고 있습니다. 전반적으로 시장은 기술 발전, 규제 강화, 효율적인 도시 모빌리티 솔루션에 대한 수요 증가와 함께 진화하고 있습니다.
| 시장 범위 | |
|---|---|
| 개시 연도 | 2025년 |
| 예측 기간 | 2026-2035년 |
| 개시 연도 시장 규모 | 1,029억 달러 |
| 예측 시장 규모 | 2,107억 달러 |
| CAGR | 7% |
배터리 전기버스는 주요 지역에서 보급이 확대되고 있으며, 유럽에서는 2030년까지 신규 버스 판매의 3분의 2가 전기버스로 될 것으로 예상되며, 중국에서는 신규 시내버스 차량의 완전 전기화가 다가오고 있습니다. 시장 성장은 인구가 밀집된 대도시 지역에서 빈번하고 효율적인 대중교통 서비스에 대한 수요가 증가함에 따라 주도되고 있습니다. 대중 교통 시스템의 인프라 개선은 청정 모빌리티로의 전환을 지속적으로 촉진하고 있으며, 주요 교통 회랑에서 디젤 버스를 대체하는 것을 가속화하고 있습니다.
700kWh 이상의 용량을 포함한 배터리 기술의 발전과 에너지 최적화를 위한 소프트웨어 강화로 차량의 효율성과 신뢰성이 향상되고 있습니다. 수소버스는 배터리 전기버스의 한계를 뛰어넘는 유연성을 제공하며, 장거리 운행에 있어 주목받고 있습니다. 국제에너지기구의 보고서에 따르면, 특히 신흥 시장에서 재료비 하락과 전기자동차의 가격 경쟁력 향상에 초점을 맞추었습니다. 이러한 개선은 특히 이용률이 높은 노선에서 제로 에미션 버스의 투자 회수 기간을 단축하고 있으며, 이는 단위당 경제성 향상과 지속적인 재정적 인센티브에 힘입어 더욱 가속화되고 있습니다.
노선 버스 시장은 2025년 576억 달러 규모로 평가되었고, 2035년까지 1,286억 달러에 달할 것으로 예측됩니다. 이 시장의 성장은 고주파 운행에 대한 수요 증가와 더 큰 용량의 차량을 필요로 하는 도시 교통 회랑의 정비에 의해 뒷받침되고 있습니다. 대중 교통 기관은 조달 전략에 무공해 요구 사항을 통합하여 차량 교체 주기를 가속화하고 충전소와 같은 지원 인프라에 대한 투자를 촉진하고 있습니다.
내연기관(ICE) 버스 부문은 2025년 79%의 점유율을 차지했습니다. 이 부문은 2026-2035년 연평균 복합 성장률(CAGR) 6%를 나타낼 것으로 예측됩니다. ICE 버스 수요는 절대적으로 여전히 견고하지만, 무공해 대안이 추진력을 얻음에 따라 전체 시장 점유율은 점차 감소하고 있습니다.
아시아태평양의 버스 시장은 2025년 510억 달러에 달했으며, 2035년까지 993억 달러로 확대될 것으로 전망됩니다. 이 지역은 강력한 제조 능력, 중국에서의 대규모 도입, 인도 및 동남아시아 전역 수요 증가로 인해 주요 성장 거점으로 자리매김하고 있습니다.
자주 묻는 질문
목차
제1장 조사 방법
제2장 주요 요약
제3장 업계 인사이트
제4장 경쟁 구도
제5장 시장 추산 및 예측 : 차량별(2022-2035년)
제6장 시장 추산 및 예측 : 좌석수별(2022-2035년)
제7장 시장 추산 및 예측 : 서비스별(2022-2035년)
제8장 시장 추산 및 예측 : 추진력별(2022-2035년)
제9장 시장 추산 및 예측 : 최종 용도별(2022-2035년)
제10장 시장 추산 및 예측 : 지역별(2022-2035년)
제11장 기업 개요
AJY 26.06.11The Global Bus Market was valued at USD 102.9 billion in 2025 and is estimated to grow at a CAGR of 7% to reach USD 210.7 billion by 2035.
The market is shaped by expanding urban populations and sustained investment in public transportation infrastructure. Cities are prioritizing high-capacity mobility solutions to improve accessibility and reduce congestion, which is accelerating demand for buses across transit networks. Electrification is becoming a central theme, with battery-electric buses rapidly gaining traction in multiple regions, supported by policy mandates and cost efficiencies. Improvements in vehicle performance, including higher battery capacities and advanced energy management systems, are strengthening operational viability. At the same time, hydrogen-powered alternatives are emerging for longer routes. Declining battery costs and supportive government incentives are narrowing the cost gap between conventional and zero-emission buses, improving return on investment. Increasing affordability in developing economies is further boosting adoption. Overall, the market is evolving through a combination of technological progress, regulatory push, and rising demand for efficient urban mobility solutions.
| Market Scope | |
|---|---|
| Start Year | 2025 |
| Forecast Year | 2026-2035 |
| Start Value | $102.9 Billion |
| Forecast Value | $210.7 Billion |
| CAGR | 7% |
Battery-electric buses are expanding their footprint across key regions, with Europe expected to achieve nearly two-thirds of new bus sales from electric models by 2030, while China is approaching full electrification of new urban bus fleets. Market growth is driven by rising demand for frequent, efficient transit services in densely populated metropolitan areas. Infrastructure development in public transport systems continues to reinforce the shift toward cleaner mobility, thereby accelerating the replacement of diesel-powered buses in major transit corridors.
Advancements in battery technology, including capacities exceeding 700 kWh, along with enhanced software for energy optimization, are improving vehicle efficiency and reliability. Hydrogen-powered buses are gaining attention for long-distance operations, offering flexibility beyond the limitations of battery-electric buses. Reports from international energy authorities highlight declining material costs and increasing affordability of electric vehicles, particularly in emerging markets. These improvements are shortening payback periods for zero-emission buses, especially on high-utilization routes, driven by better unit economics and ongoing financial incentives.
The transit buses segment accounts for USD 57.6 billion in 2025 and is anticipated to reach USD 128.6 billion by 2035. Growth in this segment is supported by increasing demand for high-frequency services and upgrades to urban transit corridors that require higher-capacity vehicles. Public transit agencies are incorporating zero-emission requirements into procurement strategies, which is accelerating fleet replacement cycles and encouraging investment in supporting infrastructure such as charging depots.
The internal combustion engine buses segment held a 79% share in 2025. The segment is projected to grow at a CAGR of 6% between 2026 and 2035. Although demand for ICE buses remains strong in absolute terms, their overall market share is gradually declining as zero-emission alternatives gain momentum.
Asia Pacific Bus Market reached USD 51 billion in 2025 and is expected to rise to USD 99.3 billion by 2035. The region benefits from strong manufacturing capabilities, large-scale deployments in China, and increasing demand across India and Southeast Asia, positioning it as a key growth hub.
Key companies operating in the Global Bus Market include Blue Bird, BYD, CAF, Daimler, Golden Dragon, Hyundai, Iveco, MAN, Scania, Volvo, and Yutong. Companies in the bus market are strengthening their positions through a combination of product innovation, strategic partnerships, and geographic expansion. Manufacturers are investing heavily in electric and hydrogen-powered bus technologies to align with global emission regulations and evolving customer preferences. Collaboration with governments and transit agencies is enabling large-scale fleet deployments and infrastructure development. Firms are also focusing on enhancing battery performance, vehicle range, and energy efficiency to improve competitiveness. Expanding production capacity, particularly in high-growth regions such as the Asia Pacific, is another key strategy. Additionally, companies are leveraging digital solutions, including fleet management software and predictive maintenance systems, to deliver value-added services and improve operational efficiency for transit operators.
Table of Contents
Chapter 1 Methodology
- 1.1 Research approach
- 1.2 Quality Commitments
- 1.2.1 GMI AI policy & data integrity commitment
- 1.2.1.1 Source consistency protocol
- 1.2.1 GMI AI policy & data integrity commitment
- 1.3 Research Trail & Confidence Scoring
- 1.3.1 Research Trail Components
- 1.3.2 Scoring Components
- 1.4 Data Collection
- 1.4.1 Partial list of primary sources
- 1.5 Data mining sources
- 1.5.1 Paid sources
- 1.5.2 Sources, by region
- 1.6 Base estimates and calculations
- 1.6.1 Base year calculation
- 1.7 Forecast model
- 1.7.1 Quantified market impact analysis
- 1.7.1.1 Mathematical impact of growth parameters on forecast
- 1.7.1 Quantified market impact analysis
- 1.8 Research transparency addendum
- 1.8.1 Source attribution framework
- 1.8.2 Quality assurance metrics
- 1.8.3 Our commitment to trust
Chapter 2 Executive Summary
- 2.1 Industry 360° synopsis, 2022 - 2035
- 2.2 Key market trends
- 2.2.1 Regional
- 2.2.2 Vehicle
- 2.2.3 Seating Capacity
- 2.2.4 Service
- 2.2.5 Propulsion
- 2.2.6 End Use
- 2.3 TAM Analysis, 2026-2035
- 2.4 CXO perspectives: Strategic imperatives
Chapter 3 Industry Insights
- 3.1 Industry ecosystem analysis
- 3.1.1 Supplier landscape
- 3.1.2 Profit margin analysis
- 3.1.3 Cost structure
- 3.1.4 Value addition at each stage
- 3.1.5 Factor affecting the value chain
- 3.1.6 Disruptions
- 3.2 Industry impact forces
- 3.2.1 Growth drivers
- 3.2.1.1 Electrification of public transport fleets
- 3.2.1.2 Government investments in mass transit infrastructure
- 3.2.1.3 Rising urbanization and passenger mobility demand
- 3.2.1.4 Technological advancements in powertrains
- 3.2.2 Industry pitfalls and challenges
- 3.2.2.1 High upfront cost of electric and hydrogen buses
- 3.2.2.2 Charging and hydrogen refueling infrastructure gaps
- 3.2.2.3 Supply chain constraints (batteries & semiconductors)
- 3.2.2.4 Dependence on government subsidies
- 3.2.3 Market opportunities
- 3.2.3.1 Expansion of electric bus procurement programs
- 3.2.3.2 Hydrogen fuel cell bus adoption
- 3.2.3.3 Growth of private fleet operators & mobility services
- 3.2.3.4 Smart and connected buses
- 3.2.1 Growth drivers
- 3.3 Growth potential analysis
- 3.4 Regulatory landscape
- 3.4.1 North America
- 3.4.1.1 Environmental Protection Agency (EPA)
- 3.4.1.2 National Highway Traffic Safety Administration (NHTSA)
- 3.4.1.3 Occupational Safety and Health Administration (OSHA)
- 3.4.1.4 U.S. Department of Transportation (DOT)
- 3.4.1.5 Canadian Motor Vehicle Safety Standards (CMVSS)
- 3.4.2 Europe
- 3.4.2.1 EU General Safety Regulation
- 3.4.2.2 Euro VI Emission Standards
- 3.4.2.3 Whole Vehicle Type Approval (WVTA)
- 3.4.2.4 CE Marking Compliance
- 3.4.2.5 Tachograph and Driver Hours Regulations
- 3.4.3 Asia Pacific
- 3.4.3.1 China Compulsory Certification (CCC)
- 3.4.3.2 Bharat Stage VI Emission Norms
- 3.4.3.3 Central Motor Vehicle Rules (CMVR)
- 3.4.3.4 Japanese Road Vehicle Act & Safety Standards
- 3.4.3.5 Australian Design Rules (ADR)
- 3.4.4 Latin America
- 3.4.4.1 Brazilian National Traffic Council (CONTRAN)
- 3.4.4.2 Brazilian Institute of Environment and Renewable Natural Resources (IBAMA) Emission Rules
- 3.4.4.3 Mexican NOM Commercial Vehicle Safety Standards
- 3.4.4.4 Regional Import & Homologation Requirements
- 3.4.5 Middle East & Africa
- 3.4.5.1 Gulf Standardization Organization (GSO) Vehicle Regulations
- 3.4.5.2 Saudi Standards, Metrology and Quality Organization (SASO)
- 3.4.5.3 South African National Regulator for Compulsory Specifications (NRCS)
- 3.4.5.4 National Road Traffic Act (NRTA) Compliance
- 3.4.1 North America
- 3.5 Porter's analysis
- 3.6 PESTEL analysis
- 3.7 Technology and innovation landscape
- 3.7.1 Current technological trends
- 3.7.2 Emerging technologies
- 3.8 Price analysis (Driven by Primary Research)
- 3.8.1 Historical Price Trend Analysis
- 3.8.2 Pricing Strategy by Player Type (Premium / Value / Cost-plus)
- 3.9 Trade data analysis (Driven by Paid Research)
- 3.9.1 Import/export volume & value trends
- 3.9.2 Key trade corridors & tariff impact
- 3.10 Cost breakdown analysis
- 3.11 Patent analysis (Driven by Primary Research)
- 3.12 Impact of AI & generative AI on the market
- 3.12.1 AI-driven disruption of existing business models
- 3.12.2 GenAI use cases & adoption roadmap by segment
- 3.12.3 Risks, limitations & regulatory considerations
- 3.13 Capacity & production landscape (Driven by Primary Research)
- 3.13.1 Installed capacity by region & key producer
- 3.13.2 Capacity utilization rates & expansion pipelines
- 3.14 Sustainability and environmental aspects
- 3.14.1 Sustainable practices
- 3.14.2 Waste reduction strategies
- 3.14.3 Energy efficiency in production
- 3.14.4 Eco-friendly Initiatives
- 3.14.5 Carbon footprint considerations
- 3.15 Forecast assumptions & scenario analysis (Driven by Primary Research)
- 3.15.1 Base Case - key macro & industry variables driving CAGR
- 3.15.2 Optimistic Scenarios - Favorable macro and industry tailwinds
- 3.15.3 Pessimistic Scenario - Macroeconomic slowdown or industry headwinds
Chapter 4 Competitive Landscape, 2025
- 4.1 Introduction
- 4.2 Company market share analysis
- 4.2.1 North America
- 4.2.2 Europe
- 4.2.3 Asia Pacific
- 4.2.4 LATAM
- 4.2.5 MEA
- 4.3 Competitive analysis of major market players
- 4.4 Competitive positioning matrix
- 4.5 Key developments
- 4.5.1 Mergers & acquisitions
- 4.5.2 Partnerships & collaborations
- 4.5.3 New Product Launches
- 4.5.4 Expansion Plans and funding
- 4.6 Company tier benchmarking
- 4.6.1 Tier classification criteria & qualifying thresholds
- 4.6.2 Tier positioning matrix by revenue, geography & innovation
Chapter 5 Market Estimates & Forecast, By Vehicle, 2022 - 2035 ($Mn, Units)
- 5.1 Key trends
- 5.2 Transit buses
- 5.2.1 Standard 12 m city buses
- 5.2.2 Articulated buses
- 5.2.3 Others
- 5.3 Coach buses
- 5.3.1 Intercity scheduled coaches
- 5.3.2 Luxury and sleeper coaches
- 5.3.3 Others
- 5.4 School buses
- 5.4.1 Type A
- 5.4.2 Type B
- 5.4.3 Type C
- 5.4.4 Type D
- 5.5 Shuttle and airport buses
- 5.6 Others
Chapter 6 Market Estimates & Forecast, By Seating Capacity, 2022 - 2035 ($Mn, Units)
- 6.1 Key trends
- 6.2 Below 40
- 6.3 40-70
- 6.4 Above 70
Chapter 7 Market Estimates & Forecast, By Service, 2022 - 2035 ($Mn, Units)
- 7.1 Key trends
- 7.2 Intercity
- 7.3 Intracity
Chapter 8 Market Estimates & Forecast, By Propulsion, 2022 - 2035 ($Mn, Units)
- 8.1 Key trends
- 8.2 ICE
- 8.3 BEV
- 8.4 FCEV
- 8.5 PHEV
- 8.6 HEV
Chapter 9 Market Estimates & Forecast, By End Use, 2022 - 2035 ($Mn, Units)
- 9.1 Key trends
- 9.2 Government / Public transport authorities
- 9.3 Private fleet operators
- 9.4 Corporate / Institutional fleets
- 9.5 Tourism & travel operators
- 9.6 Educational institutions
Chapter 10 Market Estimates & Forecast, By Region, 2022 - 2035 ($Mn, Units)
- 10.1 Key trends
- 10.2 North America
- 10.2.1 US
- 10.2.2 Canada
- 10.3 Europe
- 10.3.1 UK
- 10.3.2 Germany
- 10.3.3 France
- 10.3.4 Italy
- 10.3.5 Spain
- 10.3.6 Russia
- 10.3.7 Nordics
- 10.4 Asia Pacific
- 10.4.1 China
- 10.4.2 India
- 10.4.3 Japan
- 10.4.4 South Korea
- 10.4.5 Southeast Asia
- 10.4.6 ANZ
- 10.5 Latin America
- 10.5.1 Brazil
- 10.5.2 Argentina
- 10.5.3 Mexico
- 10.6 MEA
- 10.6.1 UAE
- 10.6.2 Saudi Arabia
- 10.6.3 South Africa
Chapter 11 Company Profiles
- 11.1 Global Players
- 11.1.1 BYD
- 11.1.2 Daimler
- 11.1.3 Hyundai
- 11.1.4 Iveco
- 11.1.5 MAN
- 11.1.6 Scania
- 11.1.7 Volvo Buses
- 11.1.8 Yutong
- 11.2 Regional Players
- 11.2.1 Blue Bird
- 11.2.2 CAF
- 11.2.3 Golden Dragon
- 11.2.4 Higer
- 11.2.5 IC Bus
- 11.2.6 King Long
- 11.2.7 Navistar
- 11.2.8 Solaris
- 11.2.9 VDL
- 11.2.10 Zhongtong
- 11.3 Emerging Players
- 11.3.1 Ashok Leyland
- 11.3.2 Tata Motors