
|
시장보고서
상품코드
2038433
플레이버 요거트 시장 기회, 성장요인, 업계 동향 분석 및 예측(2026-2035년)Flavored Yogurt Market Opportunity, Growth Drivers, Industry Trend Analysis, and Forecast 2026 - 2035 |
||||||
세계의 플레이버 요거트 시장은 2025년에 504억 달러로 평가되었고 CAGR 6%로 성장하여 2035년까지 901억 달러에 이를 것으로 예측됩니다.
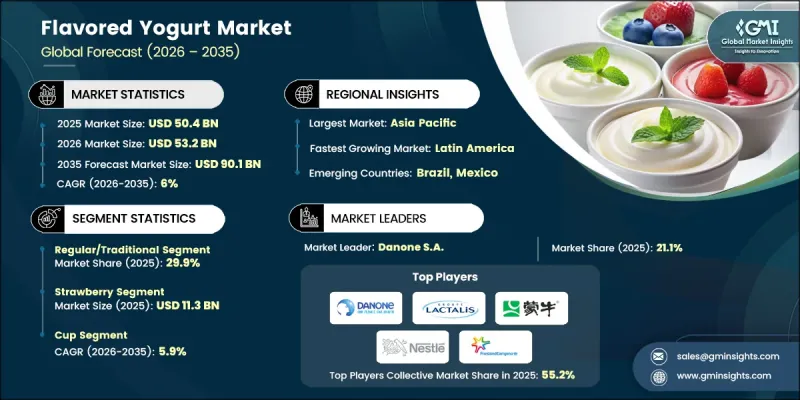
이 시장은 식습관의 변화, 건강에 대한 인식의 변화, 유제품 및 비유제품 부문의 지속적인 제품 혁신에 의해 빠르게 진화하고 있습니다. 소비자 수요는 점점 더 건강하고 기능적이며 다양한 식품에 대한 선호에 의해 영향을 받고 있습니다. 지속가능성에 대한 인식이 높아지면서 소비자들이 비건 식단으로 전환하고 유당이 들어있지 않은 대안으로 식물성 요거트 대체품이 큰 인기를 끌고 있습니다. 각 제조업체들은 맛과 식감을 개선하기 위해 제품 배합을 개선하고 있으며, 이를 통해 비유제품 대체품이 기존 유제품 요거트에 비해 경쟁력을 갖출 수 있도록 하고 있습니다. 동시에, 혁신적인 맛의 조합과 기능적 이점을 갖춘 프리미엄 제품 제공은 시장의 가치 제안을 확장하고 있습니다. 프로바이오틱스, 비타민, 단백질 등 건강 증진 성분을 함유해 제품 포지셔닝을 더욱 강화했습니다. 기존 요거트는 저렴한 가격과 친근함으로 인해 여전히 높은 수요를 유지하고 있지만, 비유제품이 더 빠른 성장세를 보이고 있습니다. 패키지의 혁신과 제품 형태의 다양화도 소비자의 구매 행동에 영향을 미치고 있으며, 세계 각지에서 시장 확대에 박차를 가하고 있습니다.
| 시장 범위 | |
|---|---|
| 시작 연도 | 2025년 |
| 예측 기간 | 2026-2035년 |
| 시작 연도 시장 규모 | 504억 달러 |
| 예측 규모 | 901억 달러 |
| CAGR | 6% |
2025년 기준, 일반 요거트 및 전통 요거트 부문은 29.9%의 점유율을 차지하고 있으며, 2035년까지 연평균 5%의 성장률을 보일 것으로 예측됩니다. 이 부문은 가성비가 좋고 소비자들 사이에서 친숙하다는 점에서 견고한 입지를 유지하고 있습니다. 안정적인 수요 기반은 소매 및 외식 산업 채널 모두에서 안정적인 성장을 지속하고 있으며, 전체 시장 구조에서 그 중요성이 더욱 강화되고 있습니다.
슈퍼마켓 및 하이퍼마켓 부문은 2025년 51.8%의 점유율을 차지할 것으로 예상되며, 2035년까지 CAGR 4.2%의 성장률을 보일 것으로 예측됩니다. 이들 소매점은 풍부한 상품 라인업과 높은 고객층을 바탕으로 유통을 주도하고 있습니다. 한 곳에서 여러 브랜드와 다양한 상품을 제공할 수 있다는 점은 소비자들이 지속적으로 선호하는 구매 채널이 되고 있습니다.
북미 플레이버 요거트 시장은 2026년부터 2035년까지 연평균 5.9%의 성장률을 보일 것으로 예측됩니다. 이 지역에서는 특히 그리스 요거트와 기능성 요거트 카테고리에서 요거트 소비문화가 정착되어 있는 것이 호재로 작용하고 있습니다. 단백질이 풍부하고 건강 지향적인 식생활에 대한 소비자의 관심이 높아지면서 시장 성장을 견인하고 있습니다. 또한, 저당, 클린 라벨, 식물성 요거트 제품에 대한 수요 증가는 제품 혁신을 촉진하고 지역 전체에서 소비자층을 확대하는 데 기여하고 있습니다.
자주 묻는 질문
목차
제1장 조사 방법과 범위
제2장 주요 요약
제3장 업계 인사이트
제4장 경쟁 구도
제5장 시장 추산 및 예측 : 제품 유형별, 2022-2035년
제6장 시장 추산 및 예측 : 플레이버별, 2022-2035년
제7장 시장 추산 및 예측 : 포장 유형별, 2022-2035년
제8장 시장 추산 및 예측 : 유통 채널별, 2022-2035년
제9장 시장 추산 및 예측 : 소비자 연령층별, 2022-2035년
제10장 시장 추산 및 예측 : 지역별, 2022-2035년
제11장 기업 개요
JHS 26.05.29The Global Flavored Yogurt Market was valued at USD 50.4 billion in 2025 and is estimated to grow at a CAGR of 6% to reach USD 90.1 billion by 2035.

The market is evolving rapidly, shaped by shifting dietary habits, rising health consciousness, and continuous product innovation across dairy and non-dairy segments. Consumer demand is increasingly influenced by preferences for healthier, functional, and more diverse food options. Plant-based yogurt alternatives are gaining strong momentum as consumers shift toward vegan diets and seek lactose-free options, supported by growing sustainability awareness. Manufacturers are enhancing product formulations to improve taste and texture, making non-dairy alternatives more competitive with traditional dairy yogurt. At the same time, premium product offerings with innovative flavor combinations and functional benefits are expanding the market's value proposition. The integration of health-enhancing ingredients such as probiotics, vitamins, and protein is further strengthening product positioning. While traditional yogurt continues to maintain strong demand due to affordability and familiarity, non-dairy variants are witnessing faster growth. Packaging innovation and diversification in product formats are also influencing consumer purchasing behavior, supporting broader market expansion across global regions.
| Market Scope | |
|---|---|
| Start Year | 2025 |
| Forecast Year | 2026-2035 |
| Start Value | $50.4 Billion |
| Forecast Value | $90.1 Billion |
| CAGR | 6% |
The regular and traditional yogurt segment accounted for 29.9% share in 2025 and is projected to grow at a CAGR of 5% through 2035. This segment maintains a strong position due to its cost-effectiveness and widespread consumer familiarity. Its consistent demand base continues to support stable growth across both retail and foodservice channels, reinforcing its importance in the overall market structure.
The supermarkets and hypermarkets segment held a 51.8% share in 2025 and is expected to grow at a CAGR of 4.2% by 2035. These retail outlets lead distribution due to their extensive product availability and strong customer footfall. Their ability to offer multiple brands and product varieties in one location continues to make them a preferred purchasing channel for consumers.
North America Flavored Yogurt Market is projected to grow at a CAGR of 5.9% during 2026-2035. The region benefits from a well-established yogurt consumption culture, particularly in Greek and functional yogurt categories. Rising consumer focus on protein-rich and health-oriented diets is supporting market growth. Increasing demand for low-sugar, clean-label, and plant-based yogurt products is also shaping product innovation and expanding consumer reach across the region.
Key companies operating in the Global Flavored Yogurt Market include Danone S.A., Chobani, LLC, Nestle S.A., General Mills, Inc., Lactalis Group, FrieslandCampina, Arla Foods, China Mengniu Dairy Company Limited, FAGE International S.A., Fonterra Co-operative Group Limited, Saputo Inc., The Hain Celestial Group, Stonyfield Farm (Lactalis), Yakult Honsha Co., Ltd., Noosa Yoghurt, and Tata Consumer Products. Companies in the flavored yogurt market are focusing on product innovation, portfolio expansion, and health-oriented reformulations to strengthen their competitive position. Many players are investing in plant-based alternatives and functional ingredients to meet evolving consumer preferences for healthier and sustainable options. Strategic branding and premium product development are being used to capture higher-value consumer segments. Expansion of distribution networks across retail and online platforms is enhancing market accessibility. Firms are also focusing on clean-label formulations and reduced sugar content to align with health trends.
Table of Contents
Chapter 1 Methodology & Scope
- 1.1 Research approach
- 1.2 Quality Commitments
- 1.2.1 GMI AI policy & data integrity commitment
- 1.2.1.1 Source consistency protocol
- 1.2.1 GMI AI policy & data integrity commitment
- 1.3 Research Trail & Confidence Scoring
- 1.3.1 Research Trail Components
- 1.3.2 Scoring Components
- 1.4 Data Collection
- 1.4.1 Partial list of primary sources
- 1.5 Data mining sources
- 1.5.1 Paid sources
- 1.5.1.1 Sources, by region
- 1.5.1 Paid sources
- 1.6 Base estimates and calculations
- 1.6.1 Base year calculation for any one approach
- 1.7 Forecast model
- 1.7.1 Quantified market impact analysis
- 1.7.1.1 Mathematical impact of growth parameters on forecast
- 1.7.1 Quantified market impact analysis
- 1.8 Research transparency addendum
- 1.8.1 Source attribution framework
- 1.8.2 Quality assurance metrics
- 1.8.3 Our commitment to trust
Chapter 2 Executive Summary
- 2.1 Industry 360° synopsis
- 2.2 Key market trends
- 2.2.1 Regional
- 2.2.2 Product Type
- 2.2.3 Flavor Category
- 2.2.4 Packaging Type
- 2.2.5 Distribution Channel
- 2.2.6 Consumer Age Group
- 2.3 TAM Analysis, 2025-2035
- 2.4 CXO perspectives: Strategic imperatives
Chapter 3 Industry Insights
- 3.1 Industry ecosystem analysis
- 3.1.1 Supplier landscape
- 3.1.2 Profit margin
- 3.1.3 Value addition at each stage
- 3.1.4 Factor affecting the value chain
- 3.1.5 Disruptions
- 3.2 Industry impact forces
- 3.2.1 Growth drivers
- 3.2.2 Industry pitfalls and challenges
- 3.2.3 Market opportunities
- 3.3 Growth potential analysis
- 3.4 Regulatory landscape
- 3.4.1 North America
- 3.4.2 Europe
- 3.4.3 Asia Pacific
- 3.4.4 Latin America
- 3.4.5 Middle East & Africa
- 3.5 Porter's analysis
- 3.6 PESTEL analysis
- 3.7 Price trends
- 3.7.1 By region
- 3.7.2 By product type
- 3.8 Future market trends
- 3.9 Technology and Innovation landscape
- 3.9.1 Current technological trends
- 3.9.2 Emerging technologies
- 3.10 Patent Landscape
- 3.11 Trade statistics (HS code)
- 3.11.1 Major importing countries
- 3.11.2 Major exporting countries
- 3.12 Sustainability and environmental aspects
- 3.12.1 Sustainable practices
- 3.12.2 Waste reduction strategies
- 3.12.3 Energy efficiency in production
- 3.12.4 Eco-friendly initiatives
Chapter 4 Competitive Landscape, 2025
- 4.1 Introduction
- 4.2 Company market share analysis
- 4.2.1 By region
- 4.2.2 North America
- 4.2.3 Europe
- 4.2.4 Asia Pacific
- 4.2.5 LATAM
- 4.2.6 MEA
- 4.3 Company matrix analysis
- 4.4 Competitive analysis of major market players
- 4.5 Competitive positioning matrix
- 4.6 Key developments
- 4.6.1 Mergers & acquisitions
- 4.6.2 Partnerships & collaborations
- 4.6.3 New Product Launches
- 4.6.4 Expansion Plans
Chapter 5 Market Estimates and Forecast, By Product Type, 2022-2035 (USD Billion) (Kilo Tons)
- 5.1 Key trends
- 5.2 Greek Yogurt
- 5.2.1 Full-Fat Greek Yogurt
- 5.2.2 Low-Fat Greek Yogurt
- 5.2.3 Non-Fat Greek Yogurt
- 5.3 Low-Fat Yogurt
- 5.3.1 1% Milk Fat
- 5.3.2 2% Milk Fat
- 5.4 Non-Fat Yogurt
- 5.4.1 Skim Milk Based
- 5.4.2 Fat-Free Formulations
- 5.5 Regular/Traditional Yogurt
- 5.5.1 Full-Fat Traditional
- 5.5.2 Custard-Style Yogurt
- 5.6 Non-Dairy Yogurt
- 5.6.1 Almond Milk Based
- 5.6.2 Soy Milk Based
- 5.6.3 Coconut Milk Based
- 5.6.4 Oat Milk Based
- 5.6.5 Cashew & Other Nut-Based
Chapter 6 Market Estimates and Forecast, By Flavor Category, 2022-2035 (USD Billion) (Kilo Tons)
- 6.1 Key trends
- 6.2 Strawberry
- 6.3 Vanilla
- 6.4 Blueberry
- 6.5 Mixed Berry
- 6.6 Peach
- 6.7 Chocolate
- 6.8 Raspberry
- 6.9 Exotic & Others
Chapter 7 Market Estimates and Forecast, By Packaging Type, 2022-2035 (USD Billion) (Kilo Tons)
- 7.1 Key trends
- 7.2 Cup
- 7.3 Drinkable/Bottle
- 7.4 Multi-Pack
- 7.5 Pouch
- 7.6 Tube
Chapter 8 Market Estimates and Forecast, By Distribution Channel, 2022-2035 (USD Billion) (Kilo Tons)
- 8.1 Key trends
- 8.2 Supermarkets/Hypermarkets
- 8.2.1 National Supermarket Chains
- 8.2.2 Regional Hypermarkets
- 8.2.3 Warehouse Clubs
- 8.3 Convenience Stores
- 8.3.1 Urban Convenience Stores
- 8.3.2 Gas Station Convenience
- 8.3.3 Neighborhood Stores
- 8.4 Online Retail
- 8.4.1 E-commerce Platforms
- 8.4.2 Direct-to-Consumer (D2C)
- 8.4.3 Quick Commerce/Instant Delivery
- 8.5 Drugstores/Pharmacies
- 8.5.1 Chain Drugstores
- 8.5.2 Independent Pharmacies
- 8.6 Others
- 8.6.1 Specialty Health Food Stores
- 8.6.2 Foodservice/HoReCa
- 8.6.3 Vending Machines
Chapter 9 Market Estimates and Forecast, By Consumer Age Group, 2022-2035 (USD Billion) (Kilo Tons)
- 9.1 Key trends
- 9.2 Kids (0-12 years)
- 9.2.1 Toddlers (0-3 years)
- 9.2.2 Preschool (4-5 years)
- 9.2.3 School-Age Children (6-12 years)
- 9.3 Adults (13-64 years)
- 9.3.1 Teens (13-19 years)
- 9.3.2 Young Adults (20-35 years)
- 9.3.3 Middle-Age Adults (36-64 years)
- 9.4 Seniors (65+ years)
- 9.4.1 Active Seniors (65-75 years)
- 9.4.2 Elderly (76+ years)
Chapter 10 Market Estimates and Forecast, By Region, 2022-2035 (USD Billion) (Kilo Tons)
- 10.1 Key trends
- 10.2 North America
- 10.2.1 U.S.
- 10.2.2 Canada
- 10.3 Europe
- 10.3.1 Germany
- 10.3.2 UK
- 10.3.3 France
- 10.3.4 Spain
- 10.3.5 Italy
- 10.3.6 Rest of Europe
- 10.4 Asia Pacific
- 10.4.1 China
- 10.4.2 India
- 10.4.3 Japan
- 10.4.4 Australia
- 10.4.5 South Korea
- 10.4.6 Rest of Asia Pacific
- 10.5 Latin America
- 10.5.1 Brazil
- 10.5.2 Mexico
- 10.5.3 Argentina
- 10.5.4 Rest of Latin America
- 10.6 Middle East and Africa
- 10.6.1 Saudi Arabia
- 10.6.2 South Africa
- 10.6.3 UAE
- 10.6.4 Rest of Middle East and Africa
Chapter 11 Company Profiles
- 11.1 Arla Foods
- 11.2 China Mengniu Dairy Company Limited
- 11.3 Chobani, LLC
- 11.4 Danone S.A.
- 11.5 FAGE International S.A.
- 11.6 Fonterra Co-operative Group Limited
- 11.7 Friesland Campina
- 11.8 General Mills, Inc.
- 11.9 Lactalis Group
- 11.10 Nestle S.A.
- 11.11 Noosa Yoghurt
- 11.12 Saputo Inc.
- 11.13 The Hain Celestial Group
- 11.14 Stonyfield Farm (Lactalis)
- 11.15 Yakult Honsha Co., Ltd.

