
|
시장보고서
상품코드
2038733
바이오포티피케이션 시장 : 시장 기회, 성장요인, 업계 동향 분석 및 예측(2026-2035년)Biofortification Market Opportunity, Growth Drivers, Industry Trend Analysis, and Forecast 2026 - 2035 |
||||||
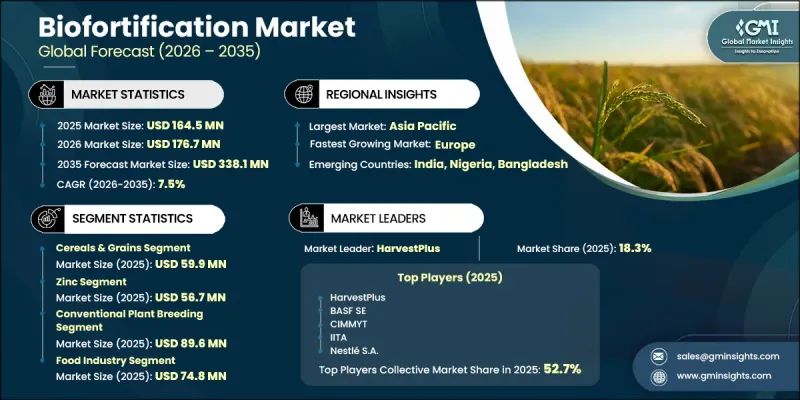
세계의 바이오포티피케이션 시장은 2025년에 1억 6,450만 달러로 평가되었고, CAGR 7.5%로 성장할 전망이며, 2035년까지 3억 3,810만 달러에 이를 것으로 추정되고 있습니다.

바이오포티피케이션은 첨단 육종 기술 및 농학적 개입을 통해 식량 작물의 영양 프로파일을 개선하는 것을 목표로 하는 농업 전략을 말합니다. 이 과정을 통해 식습관을 바꾸지 않고도 철분, 아연, 비타민 A, 단백질 등 필수 미량 영양소의 함량을 높일 수 있습니다. 일상적으로 소비되는 작물의 영양 밀도를 향상시킴으로써 영양실조 해소에 중요한 역할을 하고 있습니다. 바이오포티피케이션은 비용 효율적이고 확장 가능한 방식으로 장기적인 영양적 이익을 가져올 수 있기 때문에 농업, 식품 가공, 의료 분야에서 널리 활용되고 있습니다. 이는 영양 부족이 만연하고 영양 보충제에 대한 접근성이 제한되어 있는 지역에서 특히 중요합니다. 식물 육종, 유전체 선발, 재배 기술의 발전으로 영양이 풍부한 작물 개발이 더욱 강화되고 있습니다. 전통적인 육종, 유전자 변형, 농학적 방법을 포함한 현대적 접근 방식을 통해 영양 성분과 작물의 생육 상태를 정밀하게 제어할 수 있게 되어 식량 안보를 향상시킬 수 있게 되었습니다.
| 시장 규모 | |
|---|---|
| 개시 연도 | 2025년 |
| 예측 기간 | 2026-2035년 |
| 개시 연도 시장 규모 | 1억 6,450만 달러 |
| 예측 시장 규모 | 3억 3,810만 달러 |
| CAGR | 7.5% |
바이오포티피케이션 시장은 농업 생명공학 및 작물 과학 연구의 급속한 발전으로 인해 지속적으로 확대되고 있습니다. 유전적 개량 기술의 지속적인 혁신으로 미량 영양소 함량이 높고 내성이 향상된 작물 개발이 가능해졌습니다. 연구기관과 농업단체의 협력 확대에 따라 영양 강화 작물 품종의 도입이 가속화되고 있습니다. 지속 가능한 식량 시스템과 장기적인 영양 안보에 대한 관심이 높아지면서 바이오포티피케이션 기술에 대한 투자가 더욱 활발해지고 있습니다. 전 세계적으로 영양실조 문제에 대한 인식이 높아지면서 건강 효과를 개선한 작물에 대한 수요도 증가하고 있습니다. 이러한 요인들이 결합되어 바이오포티피케이션 작물이 주류 농업 생산 시스템에 통합될 수 있도록 지원하고 있습니다.
2025년 곡물 부문 시장 규모는 5,990만 달러에 달했습니다. 많은 지역에서 주식 작물에 대한 의존도가 높아짐에 따라 이 부문은 계속 확대되고 있습니다. 주요 곡물의 바이오포티화 품종은 특히 철분 및 아연 섭취와 관련된 광범위한 미량 영양소 결핍을 해결하기 위해 점점 더 많이 활용되고 있습니다. 작물 육종의 지속적인 발전으로 주식 곡물의 영양가가 향상되어 대규모 영양실조 대책에 더욱 효과적일 수 있게 되었습니다. 세계 식량 수요 증가는 영양 강화 곡물 생산의 중요성을 더욱 높이고 있습니다.
전통적인 식물 육종 부문은 광범위한 수용성과 규제 용이성으로 인해 2025년 큰 수익을 창출했습니다. 이 접근법은 선발육종법을 통해 밀, 옥수수, 콩류, 진주밀 등 영양강화 작물 품종을 개발하는데 널리 활용되고 있습니다. 이 방법은 이미 입증된 효과와 전 세계 농업 시스템에서 높은 사회적 수용성으로 인해 이 방법을 지지하고 있습니다. 동시에, 연구자들이 영양소 강화를 가속화하기 위해 유전자 편집 및 분자 도구를 모색하는 가운데, 첨단 유전자 기술이 주목을 받고 있습니다. 이러한 방법을 통해 개발 주기를 단축하고 작물 영양소 최적화에 대한 정확도를 높일 수 있습니다.
북미의 바이오포티피케이션 시장은 2025년 5,340만 달러로 평가되었고, 2035년 1억 1,180만 달러로 강력한 성장세를 보일 것으로 예측됩니다. 이 지역 시장 확대는 영양 강화 식품에 대한 수요 증가와 지속 가능한 농업 관행의 확산에 의해 주도되고 있습니다. 작물 개발에 있어 생명공학 기술의 통합이 진행되고 있는 것도 시장 성장을 더욱 촉진하고 있습니다. 학술 기관과 생명공학 기업들은 연구개발 및 상업화 노력에 적극적으로 기여하고 있습니다. 또한, 영양 건강 및 영양 부족에 대한 소비자의 인식이 높아짐에 따라 이 지역 전체에서 바이오포티피케이션 식품의 보급을 촉진하고 있습니다.
자주 묻는 질문
목차
제1장 조사 방법 및 범위
제2장 주요 요약
제3장 업계 인사이트
제4장 경쟁 구도
제5장 시장 추산 및 예측 : 작물 유형별(2022-2035년)
제6장 시장 추산 및 예측 : 영양소별(2022-2035년)
제7장 시장 추산 및 예측 : 기술별(2022-2035년)
제8장 시장 추산 및 예측 : 최종 용도별(2022-2035년)
제9장 시장 추산 및 예측 : 지역별(2022-2035년)
제10장 기업 개요
AJYThe Global Biofortification Market was valued at USD 164.5 million in 2025 and is estimated to grow at a CAGR of 7.5% to reach USD 338.1 million by 2035.
Biofortification refers to an agricultural strategy aimed at improving the nutritional profile of staple crops through advanced breeding techniques and agronomic interventions. This process enhances essential micronutrients such as iron, zinc, vitamin A, and protein content without requiring changes in dietary behavior. It plays a crucial role in addressing malnutrition by improving the nutrient density of commonly consumed crops. Biofortification is widely applied across agriculture, food processing, and healthcare sectors due to its ability to deliver long-term nutritional benefits in a cost-effective and scalable manner. It is particularly important in regions where dietary deficiencies are prevalent and access to supplementation is limited. Advances in plant breeding, genomic selection, and cultivation practices are further strengthening the development of nutrient-rich crops. Modern approaches, including conventional breeding, genetic engineering, and agronomic techniques, enable precise control over nutrient composition and crop performance, supporting improved food security outcomes.
| Market Scope | |
|---|---|
| Start Year | 2025 |
| Forecast Year | 2026-2035 |
| Start Value | $164.5 Million |
| Forecast Value | $338.1 Million |
| CAGR | 7.5% |
The biofortification market is also progressing due to rapid advancements in agricultural biotechnology and crop science research. Continuous innovation in genetic improvement techniques is enabling the development of crops with higher micronutrient density and improved resilience. Expanding collaboration between research institutions and agricultural organizations is accelerating the adoption of nutrient-enhanced crop varieties. Growing focus on sustainable food systems and long-term nutritional security is further encouraging investment in biofortification technologies. Increasing awareness of global malnutrition challenges is also driving demand for crops with improved health benefits. These factors collectively support the integration of biofortified crops into mainstream agricultural production systems.
The cereals and grains segment accounted for USD 59.9 million in 2025. This segment continues to expand due to the widespread reliance on staple crops for daily nutrition in many regions. Biofortified varieties of key grains are increasingly used to address widespread micronutrient deficiencies, particularly those related to iron and zinc intake. Ongoing advancements in crop breeding are improving the nutritional quality of staple cereals, making them more effective in combating malnutrition at scale. Rising global food demand is further strengthening the importance of nutrient-enhanced grain production.
The conventional plant breeding segment generated significant revenue in 2025 owing to its broad acceptance and regulatory ease. This approach is widely used to develop nutrient-enriched crop varieties such as wheat, maize, beans, and pearl millet through selective breeding methods. It is favored for its proven effectiveness and strong public acceptance across global agricultural systems. At the same time, advanced genetic technologies are gaining traction as researchers explore gene editing and molecular tools to accelerate nutrient enhancement. These methods enable faster development cycles and improved precision in crop nutrient optimization.
North America Biofortification Market is projected to witness strong growth, rising from USD 53.4 million in 2025 to USD 111.8 million by 2035. The region's expansion is driven by increasing demand for nutrient-enriched food products and rising adoption of sustainable agricultural practices. The growing integration of biotechnology in crop development is further supporting market growth. Academic institutions and biotechnology firms are actively contributing to research and commercialization efforts. Increasing consumer awareness regarding nutritional health and dietary deficiencies is also encouraging the adoption of biofortified food products across the region.
Key companies operating in the Global Biofortification Market include HarvestPlus, Arcadia Biosciences, BASF SE, Nestle S.A., Simplot Plant Sciences, Africa Improved Foods, CIMMYT, ICRISAT, CIP, IITA, Okanagan Specialty Fruits Inc., and the Golden Rice Humanitarian Board. Companies in the biofortification market are focusing on research-driven innovation, strategic partnerships, and large-scale crop development programs to strengthen their market presence. They are investing heavily in advanced breeding technologies and genetic improvement techniques to enhance nutrient content and crop yield. Collaboration with international research organizations and agricultural institutions is helping accelerate product development and adoption. Many companies are also expanding field trials and pilot programs to validate crop performance across diverse environments. Increasing emphasis on sustainability and food security is encouraging firms to align their strategies with global nutritional goals.
Table of Contents
Chapter 1 Methodology & Scope
- 1.1 Market scope and definition
- 1.2 Research design
- 1.2.1 Research approach
- 1.2.2 Data collection methods
- 1.3 Data mining sources
- 1.3.1 Global
- 1.3.2 Regional/Country
- 1.4 Base estimates and calculations
- 1.4.1 Base year calculation
- 1.4.2 Key trends for market estimation
- 1.5 Primary research and validation
- 1.5.1 Primary sources
- 1.6 Forecast model
- 1.7 Research assumptions and limitations
Chapter 2 Executive Summary
- 2.1 Industry 360° synopsis
- 2.2 Key market trends
- 2.2.1 Crop Type
- 2.2.2 Nutrient
- 2.2.3 Technology
- 2.2.4 End use
- 2.2.5 Regional
- 2.3 TAM Analysis, 2026-2035
- 2.4 CXO perspectives: Strategic imperatives
Chapter 3 Industry Insights
- 3.1 Industry ecosystem analysis
- 3.1.1 Supplier landscape
- 3.1.2 Profit margin
- 3.1.3 Value addition at each stage
- 3.1.4 Factor affecting the value chain
- 3.1.5 Disruptions
- 3.2 Industry impact forces
- 3.2.1 Growth drivers
- 3.2.2 Industry pitfalls and challenges
- 3.2.3 Market opportunities
- 3.3 Growth potential analysis
- 3.4 Regulatory landscape
- 3.4.1 North America
- 3.4.2 Europe
- 3.4.3 Asia Pacific
- 3.4.4 Latin America
- 3.4.5 Middle East & Africa
- 3.5 Porter's analysis
- 3.6 PESTEL analysis
- 3.7 Price trends
- 3.7.1 By region
- 3.7.2 By crop type
- 3.8 Future market trends
- 3.9 Technology and Innovation landscape
- 3.9.1 Current technological trends
- 3.9.2 Emerging technologies
- 3.10 Patent Landscape
- 3.11 Trade statistics (HS code)
- 3.11.1 Major importing countries
- 3.11.2 Major exporting countries
- 3.12 Sustainability and environmental aspects
- 3.12.1 Sustainable practices
- 3.12.2 Waste reduction strategies
- 3.12.3 Energy efficiency in production
- 3.12.4 Eco-friendly initiatives
- 3.13 Carbon footprint consideration
Chapter 4 Competitive Landscape, 2025
- 4.1 Introduction
- 4.2 Company market share analysis
- 4.2.1 By region
- 4.2.1.1 North America
- 4.2.1.2 Europe
- 4.2.1.3 Asia Pacific
- 4.2.1.4 LATAM
- 4.2.1.5 MEA
- 4.2.1 By region
- 4.3 Competitive analysis of major market players
- 4.4 Competitive positioning matrix
- 4.5 Key developments
- 4.5.1 Mergers & acquisitions
- 4.5.2 Partnerships & collaborations
- 4.5.3 New Product Launches
- 4.5.4 Expansion Plans
Chapter 5 Market Estimates and Forecast, By Crop Type, 2022-2035 (USD Billion) (Kilo Tons)
- 5.1 Key trends
- 5.2 Cereals & Grains
- 5.3 Legumes & Pulses
- 5.4 Roots & Tubers
- 5.5 Fruits & Vegetables
- 5.6 Oilseeds & Others
Chapter 6 Market Estimates and Forecast, By Nutrients, 2022-2035 (USD Billion) (Kilo Tons)
- 6.1 Key trends
- 6.2 Zinc
- 6.3 Iron
- 6.4 Vitamins (A, E, etc.)
- 6.5 Others (protein, amino acids)
Chapter 7 Market Estimates and Forecast, By Technology, 2022-2035 (USD Million) (Kilo Tons)
- 7.1 Key trends
- 7.2 Conventional Plant Breeding
- 7.3 Genetic Modification
- 7.4 Agronomic Biofortification
Chapter 8 Market Estimates and Forecast, By End use, 2022-2035 (USD Million) (Kilo Tons)
- 8.1 Key trends
- 8.2 Food industry
- 8.3 Feed industry
- 8.4 Healthcare & nutraceuticals
- 8.5 Others (biofuel, cosmetics,textile)
Chapter 9 Market Estimates and Forecast, By Region, 2022-2035 (USD Million) (Kilo Tons)
- 9.1 Key trends
- 9.2 North America
- 9.2.1 U.S.
- 9.2.2 Canada
- 9.3 Europe
- 9.3.1 Germany
- 9.3.2 UK
- 9.3.3 France
- 9.3.4 Spain
- 9.3.5 Italy
- 9.3.6 Rest of Europe
- 9.4 Asia Pacific
- 9.4.1 China
- 9.4.2 India
- 9.4.3 Japan
- 9.4.4 Australia
- 9.4.5 South Korea
- 9.4.6 Rest of Asia Pacific
- 9.5 Latin America
- 9.5.1 Brazil
- 9.5.2 Mexico
- 9.5.3 Argentina
- 9.5.4 Rest of Latin America
- 9.6 Middle East and Africa
- 9.6.1 Saudi Arabia
- 9.6.2 South Africa
- 9.6.3 UAE
- 9.6.4 Rest of Middle East and Africa
Chapter 10 Company Profiles
- 10.1 Arcadia Biosciences
- 10.2 BASF SE
- 10.3 HarvestPlus
- 10.4 Nestle S.A.
- 10.5 Okanagan Specialty Fruits Inc.
- 10.6 CIMMYT (International Maize and Wheat Improvement Center)
- 10.7 IITA (International Institute of Tropical Agriculture)
- 10.8 CIP (International Potato Center)
- 10.9 ICRISAT (International Crops Research Institute for the Semi-Arid Tropics)
- 10.10 Golden Rice Humanitarian Board
- 10.11 Africa Improved Foods
- 10.12 Simplot Plant Sciences
