

|
시장보고서
상품코드
2038781
압력 릴리프 밸브 시장 : 시장 기회, 성장요인, 업계 동향 분석 및 예측(2026-2035년)Pressure Relief Valve Market Opportunity, Growth Drivers, Industry Trend Analysis, and Forecast 2026 - 2035 |
||||||

세계의 압력 릴리프 밸브 시장은 2025년에 81억 달러로 평가되었고, CAGR 5.5%로 성장할 전망이며, 2035년까지 139억 달러에 이를 것으로 예측됩니다.
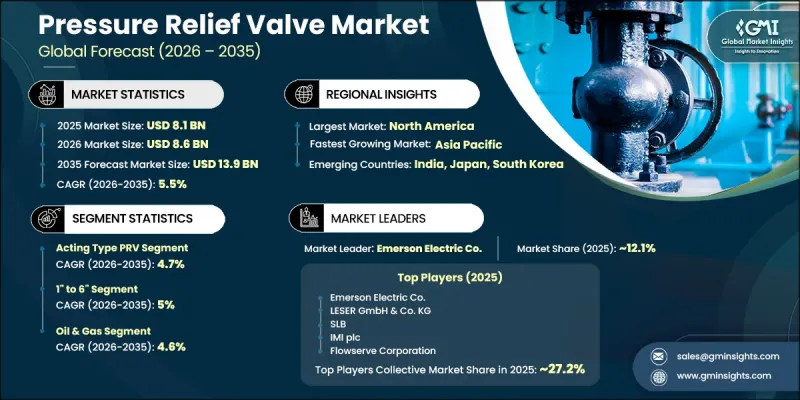
시장 성장은 석유 및 가스, 화학, 발전과 같은 고위험 산업에서 신뢰할 수 있는 안전 및 압력 제어 시스템에 대한 수요가 증가하고 있기 때문입니다. 이러한 분야는 극한의 압력 조건에서 운영되고 있으며, 운영의 안전과 설비의 건전성을 보장하기 위해 과도한 압력을 제어하고 방출하는 것이 필수적입니다. 탐사 활동의 확대, 정유시설 개보수 및 새로운 산업 시설의 건설로 인해 고급 압력 방출 시스템에 대한 수요가 더욱 증가하고 있습니다.
| 시장 범위 | |
|---|---|
| 개시 연도 | 2025년 |
| 예측 기간 | 2026-2035년 |
| 개시 연도 시장 규모 | 81억 달러 |
| 예측 시장 규모 | 139억 달러 |
| CAGR | 5.5% |
산업화의 발전과 공정 산업의 지속적인 생산 능력 확대로 인해 내구성이 뛰어나고 고성능의 압력 릴리프 밸브에 대한 수요가 크게 증가하고 있습니다. 사업자들은 가혹한 조건에서도 장기적인 신뢰성, 규제 준수 및 일관된 작동 성능을 제공하는 밸브를 점점 더 중요하게 여기고 있습니다. 세계 시장의 산업 안전 규제가 강화됨에 따라 중요한 용도 분야에서 압력 방출 시스템의 도입 속도가 더욱 빨라지고 있습니다. 또한, 산업 자동화 및 스마트 공정 제어 시스템의 채택 확대로 인해 고정밀 압력 조정 기술에 대한 새로운 수요가 발생하고 있습니다. 자동화된 생산 환경에서는 효율성을 유지하고 시스템 오류를 방지하기 위해 고정밀 압력 관리가 필요하며, 이는 여러 최종 사용 산업에서 제품 채택을 더욱 촉진하고 있습니다.
작동식 압력 릴리프 밸브 부문은 2025년에 45억 달러를 차지했으며, 2026-2035년 연평균 4.7%의 성장률을 보일 것으로 예측됩니다. 이 부문은 전체 산업 공정에서 시스템의 안전 유지 및 과압 제어에 필수적인 역할을 하기 때문에 시장을 주도하고 있습니다. 이 밸브는 압력이 안전 한계를 초과하면 자동으로 작동하도록 설계되어 즉각적인 방출을 보장하고 장비의 손상을 방지합니다. 빠른 응답 능력, 작동 신뢰성 및 넓은 압력 범위에 대한 적응성으로 인해 석유 및 가스, 화학 처리, 발전 및 기타 산업에서 널리 사용되고 있습니다. 안전 기준 준수와 운영 효율성에 대한 관심이 높아짐에 따라 전 세계적으로 작동식 압력 릴리프 밸브에 대한 수요가 지속적으로 증가하고 있습니다.
석유 및 가스 분야는 2025년 38%의 점유율을 차지했으며, 2035년까지 연평균 4.6%의 성장률을 보일 것으로 전망됩니다. 이 분야가 선도적인 위치를 차지하고 있는 이유는 탐사, 시추, 정제, 운송 작업에서 압력 제어가 필수적이기 때문입니다. 압력 릴리프 밸브는 파이프라인, 처리 시설, 해양 설비 등의 고압 환경에서 안전한 운전 조건을 유지하는 데 매우 중요한 역할을 합니다. 업스트림 및 하류 부문에 대한 투자 증가와 엄격한 안전 규제가 결합되어 수요가 지속적으로 확대되고 있습니다. 석유 및 가스 분야에 내재된 높은 운영 리스크와 엄격한 컴플라이언스 요건이 결합되어 세계 시장에서 석유 및 가스 용도의 우위가 더욱 강화되고 있습니다.
북미의 압력 릴리프 밸브 시장은 2025년에 5억 6,380만 달러로 평가되었고, 2026-2035년 연평균 5.6% 성장할 것으로 예측됩니다. 석유 및 가스, 화학 처리, 발전 산업 전반에 걸친 엄격한 안전 기준이 수요를 견인하고 있습니다. 산업시설에서는 변동하는 고압 조건에서도 안전한 운영을 보장하기 위해 신뢰할 수 있는 압력 제어 시스템이 요구됩니다. 특히 셰일 생산 및 정제 활동에서는 설비가 변동하는 압력 부하를 견뎌야 하기 때문에 수요가 두드러집니다. 이 지역의 제조업체들은 첨단 소재, 정밀 엔지니어링 및 ASME 표준 준수에 초점을 맞추었습니다. 또한, 노후화된 인프라의 지속적인 유지보수 및 업데이트도 시장의 지속적인 수요에 크게 기여하고 있습니다.
세계 압력 릴리프 밸브 시장의 주요 기업으로는 Emerson Electric Co., Flowserve Corporation, Honeywell International, Parker Hannifin Corporation, IMI plc, Spirax-Sarco Engineering, Crane Co., Pentair plc, SLB, LESER GmbH & Co. KG, Rotork Plc, Burkert Fluid Control Systems, Moog Inc., ValvTechnologies Inc. 및 Watts Water Technologies 등이 있습니다. 시장 진입 업체들은 내구성, 응답 정확도 및 작동 안전성을 향상시키는 데 초점을 맞춘 지속적인 제품 혁신을 통해 자신의 입지를 강화하고 있습니다. 각 업체들은 예지보전과 실시간 압력 추적을 위해 디지털 모니터링 시스템과 통합된 스마트 밸브 기술에 대한 투자를 확대되고 있습니다. 제조 능력과 세계 유통 네트워크의 확대도 시장 공략을 위한 중요한 전략이 되고 있습니다. 각 회사는 특정 산업 분야에 맞는 맞춤형 솔루션을 개발하는 동시에 국제 안전 표준을 준수하는 데 주력하고 있습니다. EPC 계약자 및 산업 사업자와의 전략적 파트너십은 프로젝트 통합 및 장기 계약 체결에 기여하고 있습니다.
자주 묻는 질문
목차
제1장 조사 방법 및 범위
제2장 주요 요약
제3장 업계 인사이트
제4장 경쟁 구도
제5장 시장 추산 및 예측 : 유형별(2022-2035년)
제6장 시장 추산 및 예측 : 사이즈별(2022-2035년)
제7장 시장 추산 및 예측 : 압력 범위별(2022-2035년)
제8장 시장 추산 및 예측 : 최종 사용자별(2022-2035년)
제9장 시장 추산 및 예측 : 판매 채널별(2022-2035년)
제10장 시장 추산 및 예측 : 지역별(2022-2035년)
제11장 기업 개요
AJY 26.06.11The Global Pressure Relief Valve Market was valued at USD 8.1 billion in 2025 and is estimated to grow at a CAGR of 5.5% to reach USD 13.9 billion by 2035.
Market growth is supported by the rising need for reliable safety and pressure control systems across high-risk industries such as oil & gas, chemicals, and power generation. These sectors operate under extreme pressure conditions where controlled release of excess pressure is essential to ensure operational safety and equipment integrity. Expansion in exploration activities, refinery upgrades, and new industrial facility installations is further increasing the requirement for advanced pressure relief systems.
| Market Scope | |
|---|---|
| Start Year | 2025 |
| Forecast Year | 2026-2035 |
| Start Value | $8.1 Billion |
| Forecast Value | $13.9 Billion |
| CAGR | 5.5% |
Rising industrialization and continuous capacity additions in process industries are significantly boosting demand for durable and high-performance pressure relief valves. Operators are increasingly prioritizing valves that deliver long-term reliability, regulatory compliance, and consistent operational performance under demanding conditions. The tightening of industrial safety regulations across global markets has further accelerated installation rates of pressure relief systems in critical applications. In addition, the growing adoption of industrial automation and smart process control systems is creating new demand for precision-based pressure regulation technologies. Automated production environments require highly accurate pressure management to maintain efficiency and avoid system failures, which is further reinforcing product adoption across multiple end-use industries.
The acting type pressure relief valve segment accounted for USD 4.5 billion in 2025 and is expected to grow at a CAGR of 4.7% from 2026 to 2035. This segment leads the market due to its essential role in maintaining system safety and controlling excess pressure across industrial operations. These valves are designed to automatically activate when pressure exceeds safe limits, ensuring immediate release and preventing equipment damage. Their fast response capability, operational reliability, and adaptability across different pressure ranges make them widely used in industries such as oil & gas, chemical processing, and power generation. Increasing emphasis on safety compliance and operational efficiency continues to strengthen demand for acting type pressure relief valves globally.
The oil & gas segment held a 38% share in 2025 and is projected to grow at a CAGR of 4.6% through 2035. This segment dominates due to the critical need for pressure control in exploration, drilling, refining, and transportation operations. Pressure relief valves play a vital role in maintaining safe operating conditions in high-pressure environments such as pipelines, processing facilities, and offshore installations. Rising upstream and downstream investments, combined with stringent safety regulations, are driving continuous demand. The inherently high operational risk in this sector, along with strict compliance requirements, further reinforces the dominance of oil & gas applications in the global market.
North America Pressure Relief Valve Market accounted for USD 563.8 million in 2025 and is expected to grow at a CAGR of 5.6% from 2026 to 2035. Demand in the country is driven by strict safety standards across oil & gas, chemical processing, and power generation industries. Industrial facilities require highly reliable pressure control systems to ensure safe operations under fluctuating and high-pressure conditions. Strong demand is particularly evident in shale production and refining activities, where equipment must withstand variable pressure loads. Manufacturers in the region focus on advanced materials, precision engineering, and compliance with ASME standards. Additionally, ongoing maintenance and replacement of aging infrastructure significantly contribute to sustained market demand.
The key companies operating in the Global Pressure Relief Valve Market include Emerson Electric Co., Flowserve Corporation, Honeywell International, Parker Hannifin Corporation, IMI plc, Spirax-Sarco Engineering, Crane Co., Pentair plc, SLB, LESER GmbH & Co. KG, Rotork Plc, Burkert Fluid Control Systems, Moog Inc., ValvTechnologies Inc., and Watts Water Technologies. Market players are strengthening their positions through continuous product innovation focused on improving durability, response accuracy, and operational safety. Companies are increasingly investing in smart valve technologies integrated with digital monitoring systems to enable predictive maintenance and real-time pressure tracking. Expansion of manufacturing capabilities and global distribution networks is also a key strategy to enhance market reach. Firms are focusing on compliance with international safety standards while developing customized solutions for specific industrial applications. Strategic partnerships with EPC contractors and industrial operators are helping improve project integration and long-term contracts.
Table of Contents
Chapter 1 Methodology & Scope
- 1.1 Market scope and definition
- 1.2 Research design
- 1.2.1 Research approach
- 1.2.2 Data collection methods
- 1.3 Data mining sources
- 1.3.1 Global
- 1.3.2 Regional/Country
- 1.4 Base estimates and calculations
- 1.4.1 Base year calculation
- 1.4.2 Key trends for market estimation
- 1.5 Primary research and validation
- 1.5.1 Primary sources
- 1.6 Forecast model
- 1.7 Research assumptions and limitations
Chapter 2 Executive Summary
- 2.1 Industry 360° synopsis
- 2.2 Key market trends
- 2.2.1 Regional
- 2.2.2 Type
- 2.2.3 Size
- 2.2.4 Pressure Range
- 2.2.5 End User
- 2.2.6 Distribution channel
Chapter 3 Industry Insights
- 3.1 Industry ecosystem analysis
- 3.1.1 Supplier landscape
- 3.1.2 Profit margin
- 3.1.3 Value addition at each stage
- 3.1.4 Factor affecting the value chain
- 3.2 Industry impact forces
- 3.2.1 Growth drivers
- 3.2.1.1 Increasing demand from oil & gas, chemical, and power generation industries
- 3.2.1.2 Growth in industrial automation and process optimization
- 3.2.1.3 Expansion of water and wastewater treatment infrastructure
- 3.2.2 Pitfalls & Challenges
- 3.2.2.1 High maintenance and periodic inspection requirements
- 3.2.2.2 Volatility in raw material prices such as steel and alloys
- 3.2.3 Opportunities
- 3.2.3.1 Rising adoption of smart valves with real-time monitoring capabilities
- 3.2.3.2 Growth of renewable energy and hydrogen infrastructure
- 3.2.1 Growth drivers
- 3.3 Growth potential analysis
- 3.4 Future market trends
- 3.5 Technology and innovation landscape
- 3.5.1 Current technological trends
- 3.5.2 Emerging technologies
- 3.6 Regulatory landscape
- 3.6.1 Standards and compliance requirements
- 3.6.2 Regional regulatory frameworks
- 3.6.3 Certification standards
- 3.7 Porter's analysis
- 3.8 PESTEL analysis
- 3.9 Pricing analysis (driven by primary research)
- 3.9.1 Historical price trend analysis (driven by primary research)
- 3.9.2 Pricing strategy by player type (premium / value / cost-plus) (driven by primary research)
- 3.9.3 Price differential by material construction
- 3.9.4 Regional price variations & tariff impact
- 3.10 Trade data analysis (HS code 848140) (driven by paid database)
- 3.10.1 Import/export volume and value trends (driven by paid database)
- 3.10.2 Key trade corridors and tariff impact (driven by paid database)
- 3.10.3 Trade balance by region
- 3.10.4 HS code classification and trade policy impact
- 3.11 Impact of AI and generative AI on the market
- 3.11.1 AI-driven disruption of existing business models
- 3.11.2 GenAI use cases and adoption roadmap by segment
- 3.11.3 Risks, limitations and regulatory considerations
- 3.12 Capacity and production landscape (driven by primary research)
- 3.12.1 Installed capacity by region and key producer (driven by primary research)
- 3.12.2 Capacity utilization rates and expansion pipelines (driven by primary research)
Chapter 4 Competitive Landscape, 2025
- 4.1 Introduction
- 4.2 Company market share analysis
- 4.2.1 By Region
- 4.2.1.1 North America
- 4.2.1.2 Europe
- 4.2.1.3 Asia Pacific
- 4.2.1.4 Latin America
- 4.2.1.5 Middle East & Africa
- 4.2.1 By Region
- 4.3 Company matrix analysis
- 4.4 Competitive analysis of major market players
- 4.5 Competitive positioning matrix
- 4.6 Key developments
- 4.6.1 Mergers & acquisitions
- 4.6.2 Partnerships & collaborations
- 4.6.3 New product launches
- 4.6.4 Expansion plans
Chapter 5 Market Estimates & Forecast, By Type, 2022 - 2035, (USD Billion) (Thousand Units)
- 5.1 Key trends
- 5.2 Acting Type PRV
- 5.3 Piston Type PRV
- 5.4 Diaphragm Type PRV
Chapter 6 Market Estimates & Forecast, By Size, 2022 - 2035, (USD Billion) (Thousand Units)
- 6.1 Key trends
- 6.2 Up to 1"
- 6.3 1" to 6"
- 6.4 6" to 25"
- 6.5 25" to 50"
- 6.6 50" and Larger
Chapter 7 Market Estimates & Forecast, By Pressure Range, 2022 - 2035, (USD Billion) (Thousand Units)
- 7.1 Key trends
- 7.2 Low (5 mbar to 3000 mbar)
- 7.3 Medium (Up to 50 bar)
- 7.4 High (Up to 400 bar)
Chapter 8 Market Estimates & Forecast, By End User, 2022 - 2035, (USD Billion) (Thousand Units)
- 8.1 Key trends
- 8.2 Oil & Gas
- 8.3 Water & Wastewater Treatment
- 8.4 Power Industry
- 8.5 Chemical Industry
- 8.6 Others
Chapter 9 Market Estimates & Forecast, By Distribution Channel, 2022 - 2035, (USD Billion) (Thousand Units)
- 9.1 Key trends
- 9.2 Direct Sales
- 9.3 Indirect Sales
Chapter 10 Market Estimates & Forecast, By Region, 2022 - 2035, (USD Billion) (Thousand Units)
- 10.1 Key trends
- 10.2 North America
- 10.2.1 U.S.
- 10.2.2 Canada
- 10.3 Europe
- 10.3.1 Germany
- 10.3.2 UK
- 10.3.3 France
- 10.3.4 Italy
- 10.3.5 Spain
- 10.4 Asia Pacific
- 10.4.1 China
- 10.4.2 India
- 10.4.3 Japan
- 10.4.4 South Korea
- 10.4.5 Australia
- 10.5 Latin America
- 10.5.1 Brazil
- 10.5.2 Mexico
- 10.5.3 Argentina
- 10.6 MEA
- 10.6.1 Saudi Arabia
- 10.6.2 UAE
- 10.6.3 South Africa
Chapter 11 Company Profiles
- 11.1 Burkert Fluid Control Systems
- 11.2 Crane Co
- 11.3 Emerson Electric Co.
- 11.4 Flowserve Corporation
- 11.5 Honeywell International
- 11.6 IMI plc
- 11.7 LESER GmbH & Co. KG
- 11.8 Moog Inc
- 11.9 Parker Hannifin Corporation
- 11.10 Pentair plc
- 11.11 Rotork Plc
- 11.12 SLB
- 11.13 Spirax-Sarco Engineering
- 11.14 ValvTechnologies Inc
- 11.15 Watts Water Technologies


