
|
시장보고서
상품코드
2045852
담수화 및 정수 장비 시장 : 시장 기회, 성장요인, 업계 동향 분석 및 예측(2026-2035년)Water Desalination and Purification Equipment Market Opportunity, Growth Drivers, Industry Trend Analysis, and Forecast 2026 - 2035 |
||||||
세계의 담수화 및 정수 장비 시장은 2025년에 461억 달러로 평가되었고, CAGR 6.1%로 성장할 전망이며, 2035년까지 778억 달러에 이를 것으로 추정되고 있습니다.
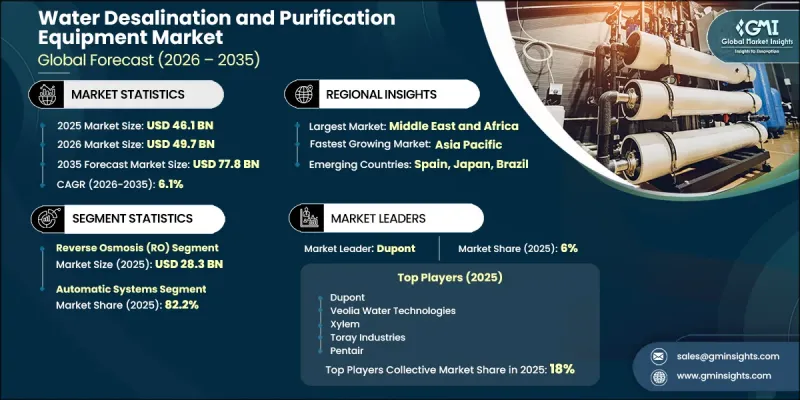
시장의 성장은 세계 물 부족의 심화, 급속한 도시화, 깨끗하고 안전한 물에 대한 산업 수요 증가에 의해 주도되고 있습니다. 기후 변화, 인구 증가, 과도한 이용으로 인해 담수 자원이 계속 감소하는 가운데, 탈염 및 정화 기술은 지속 가능한 물 공급을 보장하기 위한 중요한 해결책이 되고 있습니다. 정부와 산업계는 물 수요 및 공급의 격차를 해소하기 위해 첨단 수처리 인프라에 대한 투자를 점점 더 많이 늘리고 있습니다. 역삼투, 한외여과, 고도산화처리 등의 기술은 효율성과 확장성, 수원에서 오염물질, 병원균, 용해성 고형물을 제거하는 능력으로 인해 널리 채택되고 있습니다.
| 시장 범위 | |
|---|---|
| 개시 연도 | 2025년 |
| 예측 기간 | 2026-2035년 |
| 개시 연도 시장 규모 | 461억 달러 |
| 예측 시장 규모 | 778억 달러 |
| CAGR | 6.1% |
선진국과 개발도상국 모두 수자원 확보와 환경의 지속가능성이 우선순위로 떠오르면서 시장은 괄목할 만한 성장세를 보이고 있습니다. 특히 물 부족에 시달리는 지역에서는 지자체들이 식수 공급을 위해 대규모 담수화 플랜트에 많은 투자를 하고 있으며, 발전, 석유 및 가스, 제약, 음식료품 등의 산업에서는 규제 기준과 운영 요건을 충족하기 위해 정화 시스템을 도입하고 있습니다. 에너지 절약형 멤브레인, 스마트 모니터링 시스템, 자동화 등의 기술 발전으로 시스템 성능은 더욱 향상되고 운영비용은 절감되고 있습니다. 또한, 물 절약, 재사용, 재활용에 대한 인식이 높아지면서 주거, 상업, 산업 각 부문에서 고도정수처리 시설의 도입이 증가하고 있습니다.
시장 세분화에서는 기술별로 시장이 구분되고 있으며, 역삼투압(RO) 시스템이 시장을 독점하고 있습니다. RO 시스템은 높은 효율성, 비용 효율성, 해수 담수화 및 정수 공정 모두에 광범위하게 적용되어 2025년에는 283억 달러 규모에 도달했습니다. RO 시스템은 염분, 박테리아 및 기타 불순물을 제거하기 위해 널리 사용되며, 지자체 및 산업 분야에서 선호되는 선택이 되었습니다.
최종 용도별로는 공공 상수도 인프라에 대한 투자 확대와 도시 거주자의 안전한 식수에 대한 수요 증가로 인해 2025년에는 지자체 부문이 197억 달러에 달했습니다. 세계 각국 정부는 안정적인 물 공급을 위해 수처리 능력의 확대와 노후화된 인프라의 개보수에 집중하고 있습니다.
미국의 담수화 및 정수 장비 시장은 77%의 점유율을 차지했으며, 2025년 65억 달러 시장 규모를 기록했습니다. 이 지역은 세계 담수화 산업의 주요 부분을 차지하고 있으며, 미국은 캘리포니아, 텍사스, 플로리다 등 각 주에서 대규모 개발을 통해 성장을 주도하고 있습니다. 동시에 캐나다에서는 산업 활동과 오지 지역사회의 수처리 수요를 충족시키기 위해 담수화 및 정수 기술 도입이 꾸준히 증가하고 있습니다. 고도 여과 시스템, 물 재이용 기술, 지속 가능한 처리 솔루션에 대한 투자 확대는 이 지역 시장 전망을 더욱 공고히 하고 있습니다.
자주 묻는 질문
목차
제1장 조사 방법
제2장 주요 요약
제3장 산업 인사이트
제4장 경쟁 구도
제5장 시장 추정 및 예측 : 기술별(2022-2035년)
제6장 시장 추정 및 예측 : 운영 모드별(2022-2035년)
제7장 시장 추정 및 예측 : 시스템 규모별(2022-2035년)
제8장 시장 추정 및 예측 : 수원 유형별(2022-2035년)
제9장 시장 추정 및 예측 : 최종 용도별(2022-2035년)
제10장 시장 추정 및 예측 : 유통 채널별(2022-2035년)
제11장 시장 추정 및 예측 : 지역별(2022-2035년)
제12장 기업 개요
AJY 26.06.15The Global Water Desalination and Purification Equipment Market was valued at USD 46.1 billion in 2025 and is estimated to grow at a CAGR of 6.1% to reach USD 77.8 billion by 2035.

Market growth is driven by increasing global water scarcity, rapid urbanization, and rising industrial demand for clean and safe water. As freshwater resources continue to decline due to climate change, population growth, and overexploitation, desalination and purification technologies have become critical solutions for ensuring a sustainable water supply. Governments and industries are increasingly investing in advanced water treatment infrastructure to address the growing gap between water demand and availability. Technologies such as reverse osmosis, ultrafiltration, and advanced oxidation processes are gaining widespread adoption due to their efficiency, scalability, and ability to remove contaminants, pathogens, and dissolved solids from water sources.
| Market Scope | |
|---|---|
| Start Year | 2025 |
| Forecast Year | 2026-2035 |
| Start Value | $46.1 Billion |
| Forecast Value | $77.8 Billion |
| CAGR | 6.1% |
The market is experiencing significant growth as both developed and developing regions prioritize water security and environmental sustainability. Municipalities are investing heavily in large-scale desalination plants to provide potable water, particularly in water-stressed regions, while industries such as power generation, oil & gas, pharmaceuticals, and food & beverage are adopting purification systems to meet regulatory standards and operational requirements. Technological advancements, including energy-efficient membranes, smart monitoring systems, and automation, are further enhancing system performance and reducing operational costs. Additionally, increasing awareness regarding water conservation, reuse, and recycling is driving the adoption of advanced purification equipment across residential, commercial, and industrial sectors.
The market is segmented by technology, with reverse osmosis (RO) systems dominating, valued at USD 28.3 billion in 2025, driven by their high efficiency, cost-effectiveness, and widespread application in both desalination and water purification processes. RO systems are extensively used for removing salts, bacteria, and other impurities, making them a preferred choice across municipal and industrial applications.
In terms of end use, the municipal segment reached USD 19.7 billion in 2025, driven by rising investments in public water infrastructure and increasing demand for safe drinking water across urban populations. Governments worldwide are focusing on expanding water treatment capacity and upgrading aging infrastructure to ensure a reliable water supply.
United States Water Desalination and Purification Equipment Market held a 77% share, generating USD 6.5 billion in 2025. The region represents a major portion of the global desalination industry, with the United States driving growth through large-scale developments across states, including California, Texas, and Florida. At the same time, Canada is steadily increasing the adoption of desalination and purification technologies for industrial operations and water treatment requirements in remote communities. Growing investments in advanced filtration systems, water reuse technologies, and sustainable treatment solutions are further strengthening the regional market outlook.
Key players operating in the Global Water Desalination and Purification Equipment Market include Veolia, SUEZ, Xylem Inc., DuPont, Pentair plc, Toray Industries, IDE Technologies, Kurita Water Industries, Aquatech International, and Evoqua Water Technologies. Companies in the global water desalination and purification equipment market are focusing on technological innovation, strategic collaborations, and large-scale project development to strengthen their market foothold. A key strategy involves investing in advanced membrane technologies and energy-efficient systems to reduce operational costs and improve performance. Firms are forming partnerships with governments and municipalities to secure long-term contracts for desalination and water treatment projects. Additionally, companies are expanding their global presence through joint ventures and acquisitions, particularly in water-stressed regions. Digitalization, including smart monitoring and automation systems, is being adopted to enhance efficiency and reliability.
Table of Contents
Chapter 1 Research Methodology
- 1.1 Research approach
- 1.2 Quality Commitments
- 1.2.1 GMI AI policy & data integrity commitment
- 1.2.1.1 Source consistency protocol
- 1.2.1 GMI AI policy & data integrity commitment
- 1.3 Research Trail & Confidence Scoring
- 1.3.1 Research Trail Components
- 1.3.2 Scoring Components
- 1.4 Data Collection
- 1.4.1 Partial list of primary sources
- 1.5 Data mining sources
- 1.5.1 Paid sources
- 1.5.1.1 Sources, by region
- 1.5.1 Paid sources
- 1.6 Base estimates and calculations
- 1.6.1 Base year calculation for any one approach
- 1.7 Forecast model
- 1.7.1 Quantified market impact analysis
- 1.7.1.1 Mathematical impact of growth parameters on forecast
- 1.7.1 Quantified market impact analysis
- 1.8 Research transparency addendum
- 1.8.1 Source attribution framework
- 1.8.2 Quality assurance metrics
- 1.8.3 Our commitment to trust
Chapter 2 Executive Summary
- 2.1 Industry synopsis, 2022 - 2035
- 2.2 Key Trends
- 2.2.1 Region
- 2.2.2 Technology
- 2.2.3 Mode of Operation
- 2.2.4 System Scale
- 2.2.5 End Use
- 2.2.6 Distribution Channel
Chapter 3 Industry Insights
- 3.1 Industry ecosystem analysis
- 3.1.1 Upstream suppliers (raw materials, components)
- 3.1.2 Equipment manufacturers and technology providers
- 3.1.3 Distributors and EPC contractors
- 3.1.4 End users and service providers
- 3.1.5 Value addition at each stage
- 3.1.6 Profit margin analysis by value chain position
- 3.2 Industry impact forces
- 3.2.1 Growth drivers
- 3.2.2 Industry pitfalls & challenges
- 3.2.3 Opportunities
- 3.3 Growth potential analysis
- 3.4 Future market trends
- 3.5 Technology and Innovation Landscape
- 3.5.1 Membrane technology advancements
- 3.5.2 Thermal Desalination Innovations
- 3.5.3 Hybrid system development
- 3.5.4 Energy recovery technology evolution
- 3.5.5 Automation and remote monitoring solutions
- 3.5.6 Modular and containerized design trends
- 3.6 Patent landscape (driven by primary research)
- 3.6.1 Patent filing trends by technology type (2022-2025)
- 3.6.2 Key patent holders and innovation leaders
- 3.6.3 Emerging patent clusters and white space analysis
- 3.7 Pricing analysis (driven by primary research)
- 3.7.1 Historical price trend analysis (2022-2025)
- 3.7.2 Pricing strategy by player type (premium, value, cost-plus)
- 3.7.3 Cost structure breakdown (equipment, installation, O&M)
- 3.7.4 Price sensitivity by end-user segment
- 3.8 Regulatory landscape
- 3.8.1 Standards and compliance requirements
- 3.8.2 Regional regulatory frameworks
- 3.8.3 Certification standards
- 3.9 Trade data analysis (driven by paid database)
- 3.9.1 Import/export volume and value trends (2022-2025)
- 3.9.2 Key trade corridors and tariff impact
- 3.9.3 Major exporting countries and competitive advantage
- 3.9.4 Import dependency by region
- 3.10 Impact of ai & generative ai on the market
- 3.10.1 AI-driven disruption of existing business models
- 3.10.2 GenAI use cases and adopt roadmaps by segment
- 3.10.2.1 Predictive maintenance and operations optimization
- 3.10.2.2 Design engineering and process simulation
- 3.10.2.3 Supply chain and demand forecasting
- 3.10.3 Risks, limitations, and regulatory considerations
- 3.11 Porter's analysis
- 3.12 PESTEL analysis
- 3.13 Capacity & production landscape (Driven by Primary Research)
- 3.13.1 Installed capacity by region and key producer
- 3.13.2 Capacity utilization rates and expansion pipelines
Chapter 4 Competitive Landscape, 2025
- 4.1 Introduction
- 4.2 Company market share analysis
- 4.2.1 North America
- 4.2.2 Europe
- 4.2.3 Asia Pacific
- 4.2.4 Latin America
- 4.2.5 Middle East and Africa
- 4.3 Company matrix analysis
- 4.4 Competitive analysis of major market players
- 4.5 Competitive positioning matrix
- 4.6 Key developments
- 4.6.1 Mergers & acquisitions
- 4.6.2 Partnerships & collaborations
- 4.6.3 New product launches
- 4.6.4 Expansion plans
Chapter 5 Market Estimates & Forecast, By Technology, 2022-2035 (USD Billion)
- 5.1 Key trends
- 5.2 Nanofiltration
- 5.3 Reverse osmosis (RO)
- 5.4 Multi-stage flash (MSF)
- 5.5 Ultrafiltration (UF)
- 5.6 Ultraviolet (UV) purification
- 5.7 Activated carbon filtration
- 5.8 Others (ultrafiltration, ion exchange, etc.)
Chapter 6 Market Estimates & Forecast, By Mode of Operation, 2022-2035 (USD Billion)
- 6.1 Key trends
- 6.2 Automatic systems
- 6.3 Manual systems
Chapter 7 Market Estimates & Forecast, By System Scale, 2022-2035 (USD Billion)
- 7.1 Key trends
- 7.2 Small-scale system (0-499 m³/day)
- 7.2.1 Ultra-small/low-flow systems [0-299 m³/day]
- 7.2.2 Small systems [300-499 m³/day]
- 7.3 Medium-scale system (500-9,999 m³/day)
- 7.4 Large-scale systems (10,000+ m³/day)
Chapter 8 Market Estimates & Forecast, By Source Water Type, 2022-2035 (USD Billion)
- 8.1 Key trends
- 8.2 Seawater
- 8.3 Brackish Water
- 8.4 River Water
- 8.5 Others
Chapter 9 Market Estimates & Forecast, By End Use 2022-2035 (USD Billion)
- 9.1 Key trends
- 9.2 Municipal
- 9.3 Industrial
- 9.4 Residential
- 9.5 Commercial
- 9.6 Others (healthcare, agriculture)
Chapter 10 Market Estimates & Forecast, By Distribution Channel 2022-2035 (USD Billion)
- 10.1 Key trends
- 10.2 Direct
- 10.3 Indirect
Chapter 11 Market Estimates & Forecast, By Region, 2022 - 2035 ($Bn)
- 11.1 Key trends
- 11.2 North America
- 11.2.1 U.S.
- 11.2.2 Canada
- 11.3 Europe
- 11.3.1 UK
- 11.3.2 Germany
- 11.3.3 France
- 11.3.4 Italy
- 11.3.5 Spain
- 11.4 Asia Pacific
- 11.4.1 China
- 11.4.2 India
- 11.4.3 Japan
- 11.4.4 Australia
- 11.4.5 South Korea
- 11.5 Latin America
- 11.5.1 Brazil
- 11.5.2 Mexico
- 11.6 MEA
- 11.6.1 UAE
- 11.6.2 South Africa
- 11.6.3 Saudi Arabia
Chapter 12 Company Profiles
- 12.1 Toray Industries
- 12.2 DuPont Water Solutions (FilmTec)
- 12.3 SUEZ Water Technologies & Solutions
- 12.4 Veolia Water Technologies
- 12.5 IDE Technologies
- 12.6 Pentair
- 12.7 Xylem
- 12.8 Grundfos
- 12.9 Aquatech International
- 12.10 Membranium
- 12.11 Hydranautics / Nitto Denko
- 12.12 LG Chem / NanoH2O
- 12.13 Kovalus Separation Solutions
- 12.14 Alfa Laval
- 12.15 Applied Membranes Inc. (AMI)

