
|
시장보고서
상품코드
2045871
폴리올 감미료 시장 : 시장 비즈니스 기회, 성장요인, 업계 동향 분석 및 예측(2026-2035년)Polyol Sweeteners Market Opportunity, Growth Drivers, Industry Trend Analysis, and Forecast 2026 - 2035 |
||||||
세계의 폴리올 감미료 시장은 2025년에 42억 달러로 평가되었고, CAGR 5.4%로 성장할 전망이며, 2035년까지 72억 달러에 이를 것으로 예측됩니다.
건강에 대한 인식이 높아지고 식습관이 변화하면서 소비자들이 기존 설탕을 대체할 수 있는 저칼로리 대체품으로 점점 더 많이 이동함에 따라 이 산업은 꾸준히 성장하고 있습니다. 폴리올 감미료는 그 다기능성으로 인해 식음료, 퍼스널케어, 의약품 및 산업 용도 분야의 광범위한 분야에서 중요한 역할을 하고 있습니다. 체중 관리, 혈당 조절, 치아 건강 지원 능력으로 현대 제품 처방에서 그 입지를 더욱 확고히 하고 있습니다. 클린 라벨과 천연 성분에 대한 수요 증가는 소비자의 기대치 변화와 건강한 소비 패턴에 대한 규제 당국의 관심에 힘입어 그 채택을 더욱 가속화시키고 있습니다. 급속한 도시화와 식습관의 변화로 가공식품의 섭취가 증가함에 따라 폴리올은 저칼로리 제형의 주요 원료로 작용하고 있습니다. 폴리올은 수분 보유력, 제품 안정성, 유통기한 연장 등의 기능적 장점으로 인해 다양한 용도에 매우 적합합니다. 배합 기술 및 제품 개발의 지속적인 혁신으로 제조업체는 맞춤형 영양 솔루션을 제공할 수 있게 되어 시장 확대에 더욱 박차를 가하고 있습니다.
| 시장 범위 | |
|---|---|
| 개시 연도 | 2025년 |
| 예측 기간 | 2026-2035년 |
| 개시 연도 시장 규모 | 42억 달러 |
| 예측 시장 규모 | 72억 달러 |
| CAGR | 5.4% |
소르비톨 부문은 2025년 35.5%의 점유율을 차지했으며, 2035년까지 연평균 5.6%의 성장률을 보일 것으로 전망됩니다. 다재다능한 특성으로 인해 다양한 산업 분야에서 널리 사용되고 있습니다. 적당한 단맛을 제공하는 동시에 안정제 및 보습제 역할도 하기 때문에 다양한 제품 제형에 적합하기 때문입니다.
분말 부문은 2025년 62%의 점유율을 차지했으며, 2026-2035년 연평균 6.1%의 성장률을 보일 것으로 예측됩니다. 분말 형태는 보관의 용이성, 취급의 효율성 및 자동 생산 시스템과의 호환성으로 인해 선호되고 있습니다. 가공 기술의 발전으로 제품의 일관성과 품질이 더욱 향상되어 이 부문의 지속적인 성장과 광범위한 용도 분야에서의 채택을 뒷받침하고 있습니다.
북미의 폴리올 감미료 시장은 건강과 웰빙에 대한 소비자의 인식이 높아지고 저당 제품에 대한 수요가 증가함에 따라 2025년 40.5%의 점유율을 차지했습니다. 이 지역은 잘 정립된 식음료 산업과 주요 제조업체들의 지속적인 혁신의 혜택을 누리고 있습니다. 기능성 식품과 클린 라벨 제품에 대한 관심이 높아진 것도 이 지역 전체 시장 성장에 기여하고 있습니다.
자주 묻는 질문
목차
제1장 조사 방법 및 범위
제2장 주요 요약
제3장 업계 인사이트
제4장 경쟁 구도
제5장 시장 추산 및 예측 : 유형별(2022-2035년)
제6장 시장 추산 및 예측 : 폼별(2022-2035년)
제7장 시장 추산 및 예측 : 용도별(2022-2035년)
제8장 시장 추산 및 예측 : 지역별(2022-2035년)
제9장 기업 개요
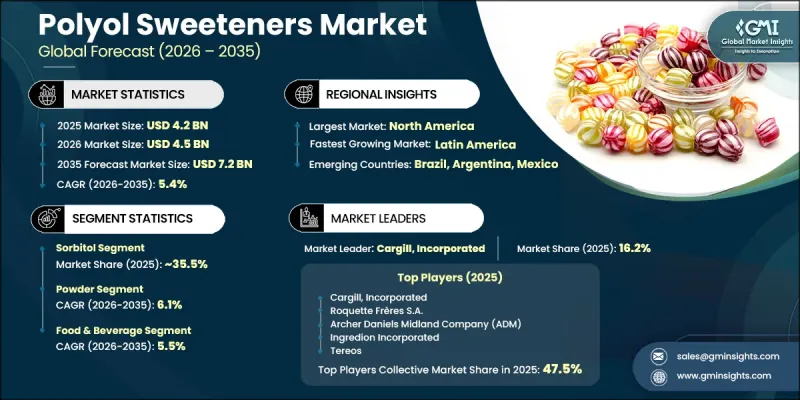
AJY 26.06.15The Global Polyol Sweeteners Market was valued at USD 4.2 billion in 2025 and is estimated to grow at a CAGR of 5.4% to reach USD 7.2 billion by 2035.

The industry is gaining consistent traction as consumers increasingly shift toward low-calorie alternatives to traditional sugar, driven by rising health awareness and dietary preferences. Polyol sweeteners play a vital role across food and beverage, personal care, pharmaceutical, and industrial applications due to their multifunctional properties. Their ability to support weight management, blood sugar control, and dental health has strengthened their position in modern product formulations. Growing demand for clean-label and naturally derived ingredients is further accelerating adoption, supported by evolving consumer expectations and regulatory focus on healthier consumption patterns. Rapid urbanization and changing dietary habits have increased the intake of processed foods, where polyols serve as key ingredients in reduced-calorie formulations. Their functional benefits, including moisture retention, product stability, and extended shelf life, make them highly suitable for a wide range of applications. Continuous innovation in formulation technologies and product development is enabling manufacturers to deliver tailored nutrition solutions, further supporting market expansion.
| Market Scope | |
|---|---|
| Start Year | 2025 |
| Forecast Year | 2026-2035 |
| Start Value | $4.2 Billion |
| Forecast Value | $7.2 Billion |
| CAGR | 5.4% |
The sorbitol segment accounted for 35.5% share in 2025 and is anticipated to grow at a CAGR of 5.6% through 2035. Its widespread use across multiple industries is driven by its versatility, as it provides moderate sweetness while also functioning as a stabilizing and moisture-retaining agent, making it suitable for diverse product formulations.
The powder segment held a share of 62% in 2025 and is expected to grow at a CAGR of 6.1% from 2026 to 2035. Powdered forms are preferred due to their ease of storage, efficient handling, and compatibility with automated production systems. Advancements in processing technologies have further enhanced product consistency and quality, supporting the segment's continued growth and broad adoption across applications.
North America Polyol Sweeteners Market accounted for a 40.5% share in 2025, supported by strong consumer awareness regarding health and wellness and increasing demand for reduced-sugar products. The region benefits from well-established food and beverage industries and continuous innovation by major manufacturers. Growing interest in functional foods and clean-label products is further contributing to market growth across the region.
Key companies operating in the Global Polyol Sweeteners Market include Cargill, Incorporated, Archer Daniels Midland Company (ADM), Ingredion Incorporated, Roquette Freres S.A., Sudzucker AG, Tereos, Associated British Foods, Jungbunzlauer Suisse AG, Gulshan Polyols Limited, Futaste Pharmaceutical Co., Ltd., Huakang Pharma (Zhejiang Huakang Pharmaceutical), B Food Science Co., Ltd., and Batory Foods. Companies in the polyol sweeteners market are focusing on strategic initiatives to strengthen their competitive positioning and expand their global footprint. They are investing in research and development to create advanced formulations that improve taste profiles, functionality, and nutritional value. Strategic partnerships and collaborations are being leveraged to enhance product portfolios and access new markets. Expansion of manufacturing capacities and supply chain optimization are helping companies meet rising demand efficiently. Firms are also emphasizing clean-label and sustainable production practices to align with evolving consumer preferences.
Table of Contents
Chapter 1 Methodology & Scope
- 1.1 Market scope and definition
- 1.2 Research design
- 1.2.1 Research approach
- 1.2.2 Data collection methods
- 1.3 Data mining sources
- 1.3.1 Global
- 1.3.2 Regional/Country
- 1.4 Base estimates and calculations
- 1.4.1 Base year calculation
- 1.4.2 Key trends for market estimation
- 1.5 Primary research and validation
- 1.5.1 Primary sources
- 1.6 Forecast model
- 1.7 Research assumptions and limitations
Chapter 2 Executive Summary
- 2.1 Industry 360° synopsis
- 2.2 Key market trends
- 2.2.1 Regional
- 2.2.2 Type
- 2.2.3 Form
- 2.2.4 Application
- 2.3 TAM Analysis, 2026-2035
- 2.4 CXO perspectives: Strategic imperatives
- 2.4.1 Executive decision points
Chapter 3 Industry Insights
- 3.1 Industry ecosystem analysis
- 3.1.1 Supplier landscape
- 3.1.2 Profit margin
- 3.1.3 Value addition at each stage
- 3.1.4 Factor affecting the value chain
- 3.1.5 Disruptions
- 3.2 Industry impact forces
- 3.2.1 Growth drivers
- 3.2.2 Industry pitfalls and challenges
- 3.2.3 Market opportunities
- 3.3 Growth potential analysis
- 3.4 Regulatory landscape
- 3.4.1 North America
- 3.4.2 Europe
- 3.4.3 Asia Pacific
- 3.4.4 Latin America
- 3.4.5 Middle East & Africa
- 3.5 Porter's analysis
- 3.6 PESTEL analysis
- 3.7 Price trends
- 3.7.1 By region
- 3.7.2 By type
- 3.8 Future market trends
- 3.9 Technology and Innovation landscape
- 3.9.1 Current technological trends
- 3.9.2 Emerging technologies
- 3.10 Patent Landscape
- 3.11 Trade statistics (HS code)
- 3.11.1 Major importing countries
- 3.11.2 Major exporting countries
- 3.12 Sustainability and environmental aspects
- 3.12.1 Sustainable practices
- 3.12.2 Waste reduction strategies
- 3.12.3 Energy efficiency in production
- 3.12.4 Eco-friendly initiatives
- 3.13 Carbon footprint consideration
Chapter 4 Competitive Landscape, 2025
- 4.1 Introduction
- 4.2 Company market share analysis
- 4.2.1 By region
- 4.2.1.1 North America
- 4.2.1.2 Europe
- 4.2.1.3 Asia Pacific
- 4.2.1.4 LATAM
- 4.2.1.5 MEA
- 4.2.1 By region
- 4.3 Company matrix analysis
- 4.4 Competitive analysis of major market players
- 4.5 Competitive positioning matrix
- 4.6 Key developments
- 4.6.1 Mergers & acquisitions
- 4.6.2 Partnerships & collaborations
- 4.6.3 New Product Launches
- 4.6.4 Expansion Plans
Chapter 5 Market Estimates and Forecast, By Type, 2022-2035 (USD Billion) (Kilo Tons)
- 5.1 Key trends
- 5.2 Sorbitol
- 5.3 Xylitol
- 5.4 Maltitol
- 5.5 Erythritol
- 5.6 Isomalt
- 5.7 Mannitol
- 5.8 Lactitol
- 5.9 Others
Chapter 6 Market Estimates and Forecast, By Form, 2022-2035 (USD Billion) (Kilo Tons)
- 6.1 Key trends
- 6.2 Powder
- 6.3 Liquid
- 6.4 Crystal
Chapter 7 Market Estimates and Forecast, By Application, 2022-2035 (USD Billion) (Kilo Tons)
- 7.1 Key trends
- 7.2 Food & beverages
- 7.2.1 Bakery & confectionery
- 7.2.2 Beverages
- 7.2.3 Dairy products
- 7.2.4 Processed foods
- 7.3 Pharmaceuticals
- 7.3.1 Chewable tablets
- 7.3.2 Syrups & suspensions
- 7.4 Personal care & cosmetics
- 7.4.1 Oral care (toothpaste, mouthwash)
- 7.4.2 Skincare products
- 7.4.3 Hair care
- 7.5 Industrial applications
- 7.5.1 Chemical synthesis
- 7.5.2 Textile industry
- 7.5.3 Paper industry
Chapter 8 Market Estimates and Forecast, By Region, 2022-2035 (USD Billion) (Kilo Tons)
- 8.1 Key trends
- 8.2 North America
- 8.2.1 U.S.
- 8.2.2 Canada
- 8.3 Europe
- 8.3.1 Germany
- 8.3.2 UK
- 8.3.3 France
- 8.3.4 Spain
- 8.3.5 Italy
- 8.3.6 Rest of Europe
- 8.4 Asia Pacific
- 8.4.1 China
- 8.4.2 India
- 8.4.3 Japan
- 8.4.4 Australia
- 8.4.5 South Korea
- 8.4.6 Rest of Asia Pacific
- 8.5 Latin America
- 8.5.1 Brazil
- 8.5.2 Mexico
- 8.5.3 Argentina
- 8.5.4 Rest of Latin America
- 8.6 Middle East and Africa
- 8.6.1 Saudi Arabia
- 8.6.2 South Africa
- 8.6.3 UAE
- 8.6.4 Rest of Middle East and Africa
Chapter 9 Company Profiles
- 9.1 Archer Daniels Midland Company (ADM)
- 9.2 Associated British Foods
- 9.3 B Food Science Co., Ltd.
- 9.4 Batory Foods
- 9.5 Cargill, Incorporated
- 9.6 Futaste Pharmaceutical Co., Ltd.
- 9.7 Gulshan Polyols Limited
- 9.8 Huakang Pharma (Zhejiang Huakang Pharmaceutical)
- 9.9 Ingredion Incorporated
- 9.10 Jungbunzlauer Suisse AG
- 9.11 Roquette Freres S.A.
- 9.12 Sudzucker AG
- 9.13 Tereos
