
|
시장보고서
상품코드
2045872
티탄산바륨 시장 : 시장 기회, 성장요인, 업계 동향 분석 및 예측(2026-2035년)Barium Titanate Market Opportunity, Growth Drivers, Industry Trend Analysis, and Forecast 2026 - 2035 |
||||||
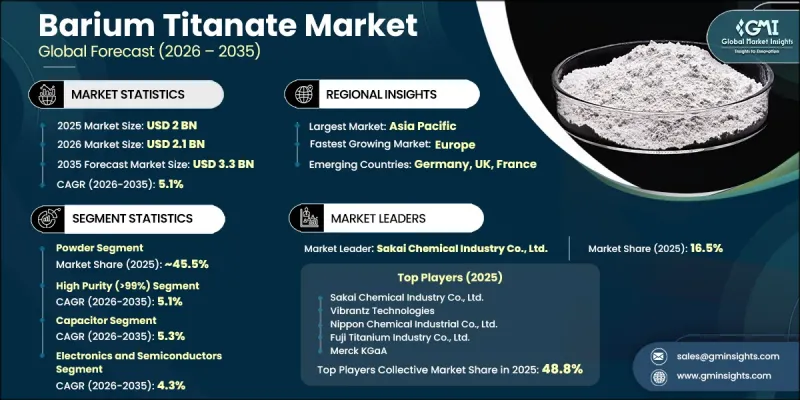
세계의 티탄산바륨 시장은 2025년에 20억 달러로 평가되었고, CAGR 5.1%로 성장할 전망이며, 2035년까지 33억 달러에 이를 것으로 예측됩니다.

티탄산바륨 산업은 첨단 전자재료 및 부품에서 중요한 역할을 하고 있어 꾸준한 성장을 거듭하고 있습니다. 티탄산바륨(BaTiO3)은 우수한 유전 특성, 열 안정성, 강유전 특성으로 널리 인정받고 있으며, 고성능 전자 세라믹 개발의 주요 재료로 사용되고 있습니다. 다양한 산업 분야에서 컴팩트하고 에너지 효율적인 전자기기에 대한 수요가 증가함에 따라 그 보급이 확대되고 있습니다. 이 소재는 비용 효율성과 다양한 조건에서도 신뢰할 수 있는 전기적 성능을 발휘할 수 있는 능력을 통해 경쟁 우위를 제공합니다. 제조업체들이 기계적 강도와 전기적 기능을 모두 향상시키기 위해 다양한 구조적 형태로 이 소재를 활용하고 있으며, 산업 부문 전반에서 응용 분야가 확대되면서 시장 성장을 더욱 촉진하고 있습니다. 지속적인 혁신과 연구 개발 노력으로 개선된 배합과 용도의 확대가 가능해지면서 시장 전망은 더욱 밝아지고 있습니다. 기술적으로 진보된 분야 수요 증가로 인해 티탄산바륨은 현대 전자제품 제조에 필수적인 재료로 자리매김하고 있습니다.
| 시장 범위 | |
|---|---|
| 개시 연도 | 2025년 |
| 예측 기간 | 2026-2035년 |
| 개시 연도 시장 규모 | 20억 달러 |
| 예측 시장 규모 | 33억 달러 |
| CAGR | 5.1% |
분말 부문은 2025년 45.5%의 점유율을 차지했으며, 2035년까지 연평균 5.2%의 성장률을 보일 것으로 전망됩니다. 이 부문은 다용도성, 가공 용이성, 대규모 제조 용도 분야에 대한 적합성으로 인해 계속해서 지배적인 위치를 유지하고 있습니다. 이 형태는 전자 부품 생산에 효율적으로 통합할 수 있으며, 일관된 성능과 확장성을 지원합니다.
순도 99% 이상의 고순도 티탄산바륨는 2025년 45.1%의 점유율을 차지했으며, 2026-2035년 연평균 5.1%의 성장률을 보일 것으로 예측됩니다. 이 부문은 우수한 신뢰성과 안정된 유전체 특성을 가진 재료에 대한 산업계 수요가 증가함에 따라 성장하고 있습니다. 일관된 성능과 장기적인 내구성이 요구되는 첨단 전자 부품 제조에는 고순도 등급의 티탄산바륨이 필수적입니다.
북미의 티탄산바륨 시장은 2025년 32.5%의 점유율을 차지했으며, 이는 이 지역의 강력한 수요와 기술 발전을 반영합니다. 이 지역은 첨단 소재의 높은 보급률과 지속적인 혁신에 힘입어 성숙한 시장 환경을 보여주고 있습니다. 차세대 기술에 대한 투자 확대와 고성능 소재에 대한 수요가 시장 확대에 기여하고 있습니다. 강력한 R&D 및 산업 개발 생태계와 제품 품질 및 규제 준수에 대한 집중이 결합되어 더 많은 성장을 주도하고 있습니다.
자주 묻는 질문
목차
제1장 조사 방법 및 범위
제2장 주요 요약
제3장 산업 인사이트
제4장 경쟁 구도
제5장 시장 추정 및 예측 : 형태별(2022-2035년)
제6장 시장 추정 및 예측 : 순도별(2022-2035년)
제7장 시장 추정 및 예측 : 용도별(2022-2035년)
제8장 시장 추정 및 예측 : 최종 사용자별(2022-2035년)
제9장 시장 추정 및 예측 : 지역별(2022-2035년)
제10장 기업 개요
AJY 26.06.15The Global Barium Titanate Market was valued at USD 2 billion in 2025 and is estimated to grow at a CAGR of 5.1% to reach USD 3.3 billion by 2035.
The barium titanate industry is witnessing consistent growth owing to its critical role in advanced electronic materials and components. Barium titanate (BaTiO3) is widely recognized for its superior dielectric performance, thermal stability, and ferroelectric properties, making it a key material in the development of high-performance electronic ceramics. Its widespread adoption is driven by increasing demand for compact, energy-efficient electronic devices across multiple industries. The material offers a competitive advantage through its cost efficiency and ability to deliver reliable electrical performance under varying conditions. Expanding applications across industrial sectors are further supporting market growth, as manufacturers utilize the material in different structural forms to enhance both mechanical strength and electrical functionality. Continuous innovation and research efforts are enabling the development of improved formulations and expanded applications, strengthening the market outlook. Growing demand from technologically advanced sectors continues to accelerate adoption, positioning barium titanate as a vital material in modern electronics manufacturing.
| Market Scope | |
|---|---|
| Start Year | 2025 |
| Forecast Year | 2026-2035 |
| Start Value | $2 Billion |
| Forecast Value | $3.3 Billion |
| CAGR | 5.1% |
The powder segment held a 45.5% share in 2025 and is projected to grow at a CAGR of 5.2% through 2035. This segment remains dominant due to its versatility, ease of processing, and suitability for large-scale manufacturing applications. The form enables efficient integration into electronic component production, supporting consistent performance and scalability.
The high-purity barium titanate with purity levels above 99% held a 45.1% share in 2025 and is expected to grow at a CAGR of 5.1% from 2026 to 2035. This segment is expanding as industries demand materials with superior reliability and stable dielectric properties. High-purity grades are essential for producing advanced electronic components that require consistent performance and long-term durability.
North America Barium Titanate Market accounted for 32.5% share in 2025, reflecting strong regional demand and technological advancement. The region demonstrates a mature market environment supported by high adoption of advanced materials and continuous innovation. Increasing investments in next-generation technologies and the demand for high-performance materials are contributing to market expansion. A strong ecosystem of research activities and industrial development is further driving growth, alongside a focus on product quality and regulatory compliance.
Key companies operating in the Global Barium Titanate Market include Merck KGaA, Sakai Chemical Industry Co., Ltd., Fuji Titanium Industry Co., Ltd., Guangdong Fenghua Advanced Technology, Nippon Chemical Industrial Co., Ltd., Titanates Ltd., Vibrantz Technologies, KCM Corporation, MC Barium Chemicals, Ossila Limited, Inframat Advanced Materials LLC, PENTA s.r.o., Ultrananotech Private Limited, and Shandong Sinocera Functional Materials. Companies in the barium titanate market are adopting a variety of strategic approaches to strengthen their market position. Organizations are investing in advanced research and development to improve material performance, enhance purity levels, and expand application areas. Manufacturers are focusing on developing specialized product variants tailored to evolving industry requirements. Strategic collaborations and partnerships are being pursued to accelerate innovation and broaden market reach. Companies are also enhancing their production capabilities through process optimization and technological upgrades to ensure consistent quality.
Table of Contents
Chapter 1 Methodology & Scope
- 1.1 Market scope and definition
- 1.2 Research design
- 1.2.1 Research approach
- 1.2.2 Data collection methods
- 1.3 Data mining sources
- 1.3.1 Global
- 1.3.2 Regional/Country
- 1.4 Base estimates and calculations
- 1.4.1 Base year calculation
- 1.4.2 Key trends for market estimation
- 1.5 Primary research and validation
- 1.5.1 Primary sources
- 1.6 Forecast model
- 1.7 Research assumptions and limitations
Chapter 2 Executive Summary
- 2.1 Industry 360° synopsis
- 2.2 Key market trends
- 2.2.1 Regional
- 2.2.2 Form
- 2.2.3 Purity
- 2.2.4 Application
- 2.2.5 End user
- 2.3 TAM Analysis, 2026-2035
- 2.4 CXO perspectives: Strategic imperatives
- 2.4.1 Executive decision points
Chapter 3 Industry Insights
- 3.1 Industry ecosystem analysis
- 3.1.1 Supplier landscape
- 3.1.2 Profit margin
- 3.1.3 Value addition at each stage
- 3.1.4 Factor affecting the value chain
- 3.1.5 Disruptions
- 3.2 Industry impact forces
- 3.2.1 Growth drivers
- 3.2.2 Industry pitfalls and challenges
- 3.2.3 Market opportunities
- 3.3 Growth potential analysis
- 3.4 Regulatory landscape
- 3.4.1 North America
- 3.4.2 Europe
- 3.4.3 Asia Pacific
- 3.4.4 Latin America
- 3.4.5 Middle East & Africa
- 3.5 Porter's analysis
- 3.6 PESTEL analysis
- 3.7 Price trends
- 3.7.1 By region
- 3.7.2 By type
- 3.8 Future market trends
- 3.9 Technology and Innovation landscape
- 3.9.1 Current technological trends
- 3.9.2 Emerging technologies
- 3.10 Patent Landscape
- 3.11 Trade statistics (HS code)
- 3.11.1 Major importing countries
- 3.11.2 Major exporting countries
- 3.12 Sustainability and environmental aspects
- 3.12.1 Sustainable practices
- 3.12.2 Waste reduction strategies
- 3.12.3 Energy efficiency in production
- 3.12.4 Eco-friendly initiatives
- 3.13 Carbon footprint consideration
Chapter 4 Competitive Landscape, 2025
- 4.1 Introduction
- 4.2 Company market share analysis
- 4.2.1 By region
- 4.2.1.1 North America
- 4.2.1.2 Europe
- 4.2.1.3 Asia Pacific
- 4.2.1.4 LATAM
- 4.2.1.5 MEA
- 4.2.1 By region
- 4.3 Company matrix analysis
- 4.4 Competitive analysis of major market players
- 4.5 Competitive positioning matrix
- 4.6 Key developments
- 4.6.1 Mergers & acquisitions
- 4.6.2 Partnerships & collaborations
- 4.6.3 New Product Launches
- 4.6.4 Expansion Plans
Chapter 5 Market Estimates and Forecast, By Form, 2022-2035 (USD Billion) (Kilo Tons)
- 5.1 Key trends
- 5.2 Powder
- 5.3 Nanoparticles
- 5.4 Crystals
- 5.5 Thin films
Chapter 6 Market Estimates and Forecast, By Purity, 2022-2035 (USD Billion) (Kilo Tons)
- 6.1 Key trends
- 6.2 High purity (>99%)
- 6.3 Technical grade (95-99%)
- 6.4 Ultra high purity (>99.9%)
Chapter 7 Market Estimates and Forecast, By Application, 2022-2035 (USD Billion) (Kilo Tons)
- 7.1 Key trends
- 7.2 Capacitors
- 7.3 PTC thermistor
- 7.4 Electronic ceramics
- 7.5 Reinforcement of composite
- 7.6 Others
Chapter 8 Market Estimates and Forecast, By End User, 2022-2035 (USD Billion) (Kilo Tons)
- 8.1 Key trends
- 8.2 Electronics and semiconductors
- 8.3 Automotive
- 8.4 Telecommunications
- 8.5 Medical devices
- 8.6 Aerospace and defense
- 8.7 Energy and power
- 8.8 Research and academia
Chapter 9 Market Estimates and Forecast, By Region, 2022-2035 (USD Billion) (Kilo Tons)
- 9.1 Key trends
- 9.2 North America
- 9.2.1 U.S.
- 9.2.2 Canada
- 9.3 Europe
- 9.3.1 Germany
- 9.3.2 UK
- 9.3.3 France
- 9.3.4 Spain
- 9.3.5 Italy
- 9.3.6 Rest of Europe
- 9.4 Asia Pacific
- 9.4.1 China
- 9.4.2 India
- 9.4.3 Japan
- 9.4.4 Australia
- 9.4.5 South Korea
- 9.4.6 Rest of Asia Pacific
- 9.5 Latin America
- 9.5.1 Brazil
- 9.5.2 Mexico
- 9.5.3 Argentina
- 9.5.4 Rest of Latin America
- 9.6 Middle East and Africa
- 9.6.1 Saudi Arabia
- 9.6.2 South Africa
- 9.6.3 UAE
- 9.6.4 Rest of Middle East and Africa
Chapter 10 Company Profiles
- 10.1 Fuji Titanium Industry Co., Ltd.
- 10.2 Guangdong Fenghua Advanced Technology
- 10.3 Inframat Advanced Materials LLC
- 10.4 KCM Corporation
- 10.5 MC Barium Chemicals
- 10.6 Merck KGaA
- 10.7 Nippon Chemical Industrial Co., Ltd.
- 10.8 Ossila Limited
- 10.9 PENTA s.r.o.
- 10.10 Sakai Chemical Industry Co., Ltd.
- 10.11 Shandong Sinocera Functional Materials
- 10.12 Titanates Ltd.
- 10.13 Ultrananotech Private Limited
- 10.14 Vibrantz Technologies
