|
시장보고서
상품코드
2061364
수산양식 설비 시장 기회, 성장요인, 업계 동향 분석 및 예측(2026-2035년)Aquaculture equipment Market Opportunity, Growth Drivers, Industry Trend Analysis, and Forecast 2026 - 2035 |
||||||
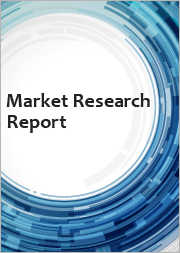
세계의 수산양식 설비 시장은 2025년에 192억 달러로 평가되고 CAGR 6%로 확대하며, 2035년까지 343억 달러에 달할 것으로 추정되고 있습니다.
전 세계 수산물 생산이 자연 어획에서 관리된 양식 환경으로 점점 더 전환됨에 따라 시장은 꾸준히 확대되고 있습니다. 천연 어류 자원에 대한 압박이 커지는 가운데, 특히 수산물 분야에서 신뢰할 수 있는 단백질 공급원으로서 양식의 필요성이 더욱 대두되고 있습니다. 이러한 구조적 전환으로 인해, 다양한 양식 시스템에서 효율적이고 확장성이 뛰어나며 지속가능한 양식 사업을 지원하도록 설계된 첨단 설비에 대한 의존도가 높아지고 있습니다. 또한 생산성 향상, 동물 헬스케어, 환경의 지속가능성 제고 측면에서 양식 시설이 핵심적인 역할을 수행하게 됨에 따라 업계도 진화하고 있습니다. 현대 수산양식 시스템에서는 사료 공급 솔루션, 수질 관리 기술, 폭기 시스템, 수확 장비, 모니터링 툴을 통합하여 원활한 일상 업무를 보장하고 있습니다. 이러한 솔루션은 연못 양식, 수조 시스템, 부양식 양식, 순환식 양식 시설 등 다양한 양식 형태에서 널리 활용되고 있습니다. 장비의 발전은 기본적인 기계적 지원의 범위를 넘어, 현재는 생산 효율의 최적화, 운영 위험의 저감, 그리고 안정적인 수생 환경의 유지에 중점을 두고 있습니다. 지속가능한 식량 생산과 생태계에 미치는 영향 저감에 대한 관심이 높아짐에 따라 전 세계에서 기술적으로 진보된 양식 시스템의 도입이 더욱 가속화되고 있습니다.
| 시장 범위 | |
|---|---|
| 시작연도 | 2025년 |
| 예측 기간 | 2026-2035년 |
| 개시 금액 | 192억 달러 |
| 예측 시장 규모 | 343억 달러 |
| CAGR | 6% |
2025년, 육상 양식은 104억 달러를 차지하며 시장에서 주도적인 위치를 유지했습니다. 이 부문이 우위를 차지하는 이유는 수질, 사료 공급 주기, 어류의 건강 상태를 보다 적절하게 관리할 수 있는 통제된 운영 환경 덕분입니다. 해상 양식과 비교했을 때, 육상 양식 시스템은 안정성이 높고 환경 변동의 영향을 덜 받는다는 장점이 있습니다. 이를 통해 운영 모니터링이 용이해질 뿐만 아니라, 생산자는 위험을 줄이면서 안정적인 생산량을 유지할 수 있게 됩니다.
2025년, 상업 양식장 부문은 67.7%의 점유율을 차지했습니다. 이 부문은 대규모 수산물 생산 및 공급망의 상업화를 주도하고 있으며, 시장을 독점하고 있습니다. 이러한 양식장은 수산 생물을 시장에 출하할 수 있는 크기까지 키우는 역할을 맡고 있으며, 업계에서 경제적으로 가장 중요한 부분을 차지하고 있습니다. 이러한 대규모 생산 규모를 유지하고, 생산 주기 전반에 걸쳐 효율성을 확보하기 위해서는 첨단 사료 공급 시스템, 수처리 설비, 건강 모니터링 툴 및 수확 기술을 지속적으로 활용하여야 합니다.
미국의 수산양식 설비 시장은 78.9%의 점유율을 차지하며, 2025년에는 30억 달러 규모의 시장에 도달했습니다. 이 국가의 시장은 식품 안전, 환경 보호 및 운영 효율성을 우선시하는 규제 및 관리된 양식 방식에 대한 강력한 중점을 바탕으로 형성되어 있습니다. 생산자들은 안정적인 산소 농도, 깨끗한 수질, 그리고 효율적인 폐기물 관리를 보장하는 시스템에 대한 의존도를 높이고 있습니다. 대규모 상업 양식 사업에서는 수명이 길고 내구성과 고성능을 겸비한 설비의 필요성이 더욱 강조되고 있습니다.
목차
제1장 조사 방법과 범위
제2장 개요
제3장 업계 인사이트
제4장 경쟁 구도
제5장 시장 추산·예측 : 장비 유형별, 2022-2035년
제6장 시장 추산·예측, 장비 유형별 : 종별, 2022-2035년
제7장 시장 추산·예측 : 용도별, 2022-2035년
제8장 시장 추산·예측 : 최종 용도별, 2022-2035년
제9장 시장 추산·예측 : 유통 채널별, 2022-2035년
제10장 시장 추산·예측 : 지역별, 2022-2035년
제11장 기업 개요
KSAThe Global Aquaculture Equipment Market was valued at USD 19.2 billion in 2025 and is estimated to grow at a CAGR of 6% to reach USD 34.3 billion by 2035.

The market is witnessing steady expansion as global seafood production increasingly shifts from wild capture to controlled farming environments. Pressure on natural fish stocks has accelerated the need for aquaculture as a dependable source of protein supply, particularly for fish and shellfish. This structural transition is strengthening reliance on advanced equipment designed to support efficient, scalable, and sustainable aquaculture operations across diverse farming systems. The industry is also evolving as aquaculture equipment becomes central to improving productivity, animal health management, and environmental sustainability. Modern aquaculture systems integrate feeding solutions, water quality control technologies, aeration systems, harvesting equipment, and monitoring tools to ensure smooth day-to-day operations. These solutions are widely used across pond-based farming, tank systems, cage farming, and recirculating aquaculture setups. Equipment advancements have moved beyond basic mechanical support, now focusing on optimizing output efficiency, reducing operational risks, and maintaining stable aquatic environments. Increasing emphasis on sustainable food production and reduced ecological impact is further encouraging adoption of technologically advanced aquaculture systems worldwide.
| Market Scope | |
|---|---|
| Start Year | 2025 |
| Forecast Year | 2026-2035 |
| Start Value | $19.2 Billion |
| Forecast Value | $34.3 Billion |
| CAGR | 6% |
The land-based aquaculture accounted for USD 10.4 billion in 2025, maintaining a leading position in the market. This segment dominates due to its controlled operational environment, which enables better management of water quality, feeding cycles, and fish health conditions. Compared to offshore farming, land-based systems offer improved stability and reduced exposure to environmental disruptions. This makes operational monitoring easier while allowing producers to maintain consistent production output with lower risk exposure.
The commercial aquaculture farms segment held a 67.7% share in 2025. This segment dominates as it forms the core of large-scale seafood production and supply chain commercialization. These farms are responsible for raising aquatic species to market-ready size, making them the most economically significant part of the industry. Their large production scale requires continuous use of advanced feeding systems, water treatment equipment, health monitoring tools, and harvesting technologies to maintain efficiency throughout the production cycle.
U.S. Aquaculture Equipment Market held a 78.9% share, generating USD 3 billion in 2025. The country's market is shaped by a strong focus on regulated and controlled aquaculture practices that prioritize food safety, environmental protection, and operational efficiency. Producers increasingly rely on systems that ensure stable oxygen levels, clean water conditions, and efficient waste management. Large-scale commercial operations further emphasize the need for durable and high-performance equipment with extended service life.
Key companies operating in the Global Aquaculture Equipment Market include AKVA Group, ScaleAQ, Innovasea, Xylem, Grundfos, Veolia, Pentair AES, Poseidon Ocean Systems, VAKI, Landia A/S, Eruvaka, AquaMaof, Optimar, AquaScan, FFF Systems, AQ1 Systems, CPI Equipment, Pioneer Group, IAS Products, and ELDI. Companies in the aquaculture equipment market are increasingly focusing on automation and digital monitoring systems to improve operational efficiency and reduce manual intervention. Investments in smart water quality sensors, real-time tracking solutions, and AI-based feeding systems are helping optimize farm productivity. Manufacturers are also prioritizing energy-efficient and sustainable designs to align with environmental regulations and reduce operational costs. Strategic partnerships with aquaculture farms and seafood producers are strengthening distribution networks and market penetration. Additionally, companies are expanding R&D efforts to develop integrated recirculating systems and advanced filtration technologies that enhance production stability and fish health management while supporting scalable commercial operations.
Table of Contents
Chapter 1 Methodology and scope
- 1.1 Research approach
- 1.2 Quality Commitments
- 1.2.1 GMI AI policy & data integrity commitment
- 1.2.1.1 Source consistency protocol
- 1.2.1 GMI AI policy & data integrity commitment
- 1.3 Research Trail & Confidence Scoring
- 1.3.1 Research Trail Components
- 1.3.2 Scoring Components
- 1.4 Data Collection
- 1.4.1 Partial list of primary sources
- 1.5 Data mining sources
- 1.5.1 Paid sources
- 1.5.1.1 Sources, by region
- 1.5.1 Paid sources
- 1.6 Base estimates and calculations
- 1.6.1 Base year calculation for any one approach
- 1.7 Forecast model
- 1.7.1 Quantified market impact analysis
- 1.7.1.1 Mathematical impact of growth parameters on forecast
- 1.7.1 Quantified market impact analysis
- 1.8 Research transparency addendum
- 1.8.1 Source attribution framework
- 1.8.2 Quality assurance metrics
- 1.8.3 Our commitment to trust
Chapter 2 Executive summary
- 2.1 Industry 360° synopsis
- 2.2 Key market trends
- 2.2.1 By region
- 2.2.2 By equipment type
- 2.2.3 By application
- 2.2.4 By end use
- 2.2.5 By distribution channel
Chapter 3 Industry insights
- 3.1 Industry ecosystem analysis
- 3.1.1 Supplier landscape
- 3.1.2 Profit margin
- 3.1.3 Value addition at each stage
- 3.1.4 Factor affecting the value chain
- 3.2 Industry impact forces
- 3.2.1 Growth drivers
- 3.2.2 Industry pitfalls & challenges
- 3.2.3 Opportunities
- 3.3 Growth potential analysis
- 3.4 Species-to-Equipment Demand Translation Framework
- 3.4.1 Aquaculture species profile
- 3.4.2 Species-equipment crosswalk matrices
- 3.4.3 Regional species mix impact on equipment markets
- 3.5 Future market trends
- 3.6 Technology and innovation landscape
- 3.6.1 Current technological trends
- 3.6.2 Emerging technologies including IoT, AI, and automation
- 3.6.3 Smart aquaculture and precision farming systems
- 3.6.4 Recirculating aquaculture systems advancements
- 3.6.5 Remote monitoring and predictive analytics
- 3.7 Price trends
- 3.7.1 Historical price trend analysis driven by primary research
- 3.7.2 Pricing strategy by player type including premium, value, and cost-plus approaches
- 3.7.3 Regional price variation and key drivers
- 3.7.4 Equipment type price benchmarking
- 3.8 Regulatory landscape
- 3.8.1 Regulatory framework
- 3.8.2 Standards and compliance requirements
- 3.8.3 Regional regulatory frameworks
- 3.8.3.1 North America regulatory landscape including EPA, FDA, and state regulations
- 3.8.3.2 Europe regulatory landscape including EU aquaculture regulations and REACH
- 3.8.3.3 Asia Pacific regulatory landscape including national aquaculture policies
- 3.8.3.4 Latin America regulatory landscape
- 3.8.3.5 Middle East and Africa regulatory landscape
- 3.8.4 Certification standards including ASC, BAP, and Global GAP
- 3.8.5 Environmental discharge and water quality regulations
- 3.9 Porter’s analysis
- 3.10 PESTEL analysis
- 3.11 Trade data analysis (driven by paid database) (HS code: 8414.80/8421.21/8907.90/ others)
- 3.11.1 Import and export volume and value trends (driven by primary research)
- 3.11.2 Key trade corridors and tariff impact (driven by primary research)
- 3.11.3 Regional trade balance and net importers versus exporters
- 3.11.4 HS code classification and trade data granularity
- 3.12 Impact of AI and generative AI on the market
- 3.12.1 AI-driven disruption of existing business models
- 3.12.2 Generative AI use cases and adoption roadmap by segment
- 3.12.3 Risks, limitations, and regulatory considerations
- 3.12.4 AI in predictive health monitoring and disease detection
- 3.12.5 Automated feeding optimization and feed conversion efficiency
- 3.13 Capacity and production landscape driven by primary research
- 3.13.1 Installed capacity by region and key producer driven by primary research
- 3.13.2 Capacity utilization rates and expansion pipelines driven by primary research
- 3.13.3 Manufacturing footprint and regional production hubs
Chapter 4 Competitive landscape, 2025
- 4.1 Introduction
- 4.2 Company market share analysis
- 4.2.1 By region
- 4.2.1.1 North America
- 4.2.1.2 Europe
- 4.2.1.3 Asia Pacific
- 4.2.1.4 Latin America
- 4.2.1.5 Middle East & Africa
- 4.2.1 By region
- 4.3 Company matrix analysis
- 4.4 Competitive analysis of major market players
- 4.5 Competitive positioning matrix
- 4.6 Key developments
- 4.6.1 Mergers & acquisitions
- 4.6.2 Partnerships & collaborations
- 4.6.3 New product launches
- 4.6.4 Expansion plans
Chapter 5 Market Estimates & Forecast, By Equipment type, 2022 - 2035 ($Billion, Thousand Units)
- 5.1 Key trends
- 5.2 Water circulation & transfer equipment (pumps)
- 5.2.1 Centrifugal pumps
- 5.2.2 Submersible pumps
- 5.2.3 Specialized pumps
- 5.2.4 Positive displacement pumps
- 5.3 Aeration & oxygenation equipment
- 5.3.1 Air compressors
- 5.3.2 Air blowers
- 5.3.3 Oxygen generation systems
- 5.3.4 Aeration accessories
- 5.4 Water treatment & conditioning equipment
- 5.4.1 Mixing equipment
- 5.4.2 Biological treatment
- 5.4.3 Physical treatment
- 5.4.4 Chemical/advanced treatment
- 5.5 Feeding & nutrition systems
- 5.6 Fish handling & harvesting equipment
- 5.7 Monitoring & control systems
- 5.8 Structural & containment systems
- 5.9 Other specialized equipment
Chapter 6 Market Estimates & Forecast, Equipment type, By Species, 2022 - 2035 ($Billion, Thousand Units)
- 6.1 Key trends
- 6.2 Salmonids
- 6.3 Marine finfish
- 6.4 Freshwater finfish
- 6.5 Shrimp and crustaceans
- 6.6 Bivalve mollusks
- 6.7 Ornamental and other speciality species
Chapter 7 Market Estimates & Forecast, By Application, 2022 - 2035 ($Billion, Thousand Units)
- 7.1 Key trends
- 7.2 Land-based
- 7.3 Sea-based
Chapter 8 Market Estimates & Forecast, By End use, 2022 - 2035 ($Billion, Thousand Units)
- 8.1 Key trends
- 8.2 Commercial aquaculture farms
- 8.3 Hatcheries and nurseries
- 8.4 Ornamental fish and aquarium trade
- 8.5 Research and educational institutions
- 8.6 Others
Chapter 9 Market Estimates & Forecast, By Distribution Channel, 2022 - 2035 ($Billion, Thousand Units)
- 9.1 Key trends
- 9.2 Direct sales
- 9.3 Indirect sales
Chapter 10 Market Estimates & Forecast, By Region, 2022 - 2035 ($Billion, Million Units)
- 10.1 Key trends
- 10.2 North America
- 10.2.1 U.S.
- 10.2.2 Canada
- 10.3 Europe
- 10.3.1 Germany
- 10.3.2 UK
- 10.3.3 France
- 10.3.4 Spain
- 10.3.5 Italy
- 10.4 Asia Pacific
- 10.4.1 China
- 10.4.2 Japan
- 10.4.3 India
- 10.4.4 Australia
- 10.4.5 South Korea
- 10.5 Latin America
- 10.5.1 Brazil
- 10.5.2 Mexico
- 10.5.3 Argentina
- 10.6 MEA
- 10.6.1 South Africa
- 10.6.2 Saudi Arabia
- 10.6.3 UAE
Chapter 11 Company Profiles
- 11.1 Tier 1: global players (7)
- 11.1.1 AKVA Group
- 11.1.2 ScaleAQ
- 11.1.3 Innovasea
- 11.1.4 Xylem
- 11.1.5 Grundfos
- 11.1.6 Veolia
- 11.1.7 Pentair AES
- 11.2 Tier 2: regional champions (7)
- 11.2.1 Poseidon Ocean Systems
- 11.2.2 VAKI
- 11.2.3 Landia A/S
- 11.2.4 ELDI
- 11.2.5 IAS Products
- 11.2.6 Pioneer Group
- 11.2.7 CPI Equipment
- 11.3 Tier 3: niche/specialists (7)
- 11.3.1 AquaMaof
- 11.3.2 Eruvaka
- 11.3.3 Optimar
- 11.3.4 AquaScan
- 11.3.5 FFF Systems
- 11.3.6 AQ1 Systems
- 11.3.7 Optiras
