
|
시장보고서
상품코드
2061416
상업 및 산업용 태양광발전 모듈 시장 기회, 성장요인, 업계 동향 분석 및 예측(2026-2035년)Commercial and Industrial Solar PV Module Market Opportunity, Growth Drivers, Industry Trend Analysis, and Forecast 2026 - 2035 |
||||||
세계의 상업·산업용 태양광발전 모듈 시장은 2025년에 720억 달러로 평가되고 CAGR 9.7%로 성장하며, 2035년까지 1,794억 달러에 달할 것으로 예측됩니다.

이 시장은 전기 요금 절감과 지속가능성 목표 달성을 위해 태양광발전 시스템 도입을 확대하고 있는 상업용 건물, 산업 시설, 창고, 데이터센터, 제조 거점에서의 투자 증가에 힘입어 강력한 성장을 달성하고 있습니다. 상업 및 산업용으로 특별히 설계된 고효율 태양광 모듈에 대한 수요가 전 세계 시장의 성장을 더욱 견인하고 있습니다. 정부의 지원도 계속해서 중요한 역할을 하고 있으며, 세액 공제, 보조금, 순계량제(net metering) 제도 등의 인센티브가 태양광발전 솔루션의 대규모 도입을 촉진하고 있습니다. 이러한 정책 조치로 인해 초기 설치 비용이 절감되어, 기업 입장에서 태양광발전의 경제적 실현 가능성이 높아졌으며, 지역을 불문하고 시장 보급이 확대되고 있습니다. 고효율 셀 구조, 양면 수광형 모듈 설계, 소재 내구성 향상 등 지속적인 기술 혁신을 통해 제한된 설치 공간 내에서 발전량을 늘릴 수 있게 되었습니다. 이러한 성능 향상은 투자수익률을 대폭 높여, 소규모부터 대규모에 이르는 상업 및 산업 사용자 모두의 도입 확대를 지원하고 있습니다. 또한 에너지 비용 관리와 장기적인 운영 효율에 대한 관심이 높아지면서 전 세계 시장에서 재생에너지 도입이 가속화되고 있으며, 기업의 지속가능성 노력도 재생에너지 시스템으로의 전환을 더욱 지원하고 있습니다.
| 시장 범위 | |
|---|---|
| 시작연도 | 2025년 |
| 예측 기간 | 2026-2035년 |
| 개시 금액 | 720억 달러 |
| 예측액 | 1,794억 달러 |
| CAGR | 9.7% |
계통 연계형 부문은 2035년까지 연평균 성장률(CAGR) 9.1%로 성장할 것으로 예상됩니다. 이 부문의 성장은 기존 송전망 인프라와 원활하게 통합되는 신뢰성이 높고 비용 대비 효과가 뛰어난 전력 솔루션에 대한 수요 증가에 힘입고 있습니다. 기존 전력망에 대한 의존도가 낮아진 데 더해, 정부의 지원 정책, 순계량제(넷 미터링)의 장점, 세제상의 우대 조치 등이 맞물리면서 산업 분야 사용자들의 도입이 확대되고 있습니다. 모듈 효율, 시스템 신뢰성 및 스마트 그리드와의 호환성 측면에서 지속적인 개선이 계통 연계형 태양광발전 시스템의 매력을 한층 더 높이고 있습니다.
옥상 부문은 2035년까지 790억 달러에 달할 것으로 전망됩니다. 에너지 비용 최적화와 장기적인 절감에 대한 관심이 높아짐에 따라 상업 및 산업 사용자들 사이에서 옥상 태양광발전 시스템의 보급이 확대되고 있습니다. 전력 가격의 변동으로 인해 기업은 자체 발전 모델을 통해 에너지 비용을 안정화하려고 하고 있습니다. 지원적인 규제 체계와 인센티브 프로그램 또한 다양한 부문에서 옥상 설치 확대를 더욱 촉진하고 있습니다.
미국의 상업·산업용 태양광 모듈 시장은 2035년까지 연평균 성장률(CAGR) 8%로 성장할 것으로 전망됩니다. 시장의 성장은 투자 결정에 영향을 미치는 환경적 책임 및 지속가능성 노력에 대한 기업의 관심이 높아짐에 따라 주도되고 있습니다. 기업은 브랜드 평판을 높이고 이해관계자들의 신뢰를 강화하기 위해 태양광발전 솔루션을 도입하고 있습니다. 유리한 인센티브 프로그램, 세제 혜택 및 재생에너지 정책이 산업 시설과 상업 시설에서의 태양광발전 시스템 대규모 도입을 더욱 촉진하고 있습니다.
자주 묻는 질문
목차
제1장 조사 방법과 범위
제2장 개요
제3장 업계 인사이트
제4장 경쟁 구도
제5장 시장 규모·예측 : 접속성별, 2022-2035년
제6장 시장 규모·예측 : 설치 방식별, 2022-2035년
제7장 시장 규모·예측 : 기술별, 2022-2035년
제8장 시장 규모·예측 : 지역별, 2022-2035년
제9장 기업 개요
KSA 26.06.24The Global Commercial & Industrial Solar PV Module Market was valued at USD 72 billion in 2025 and is estimated to grow at a CAGR of 9.7% to reach USD 179.4 billion by 2035.
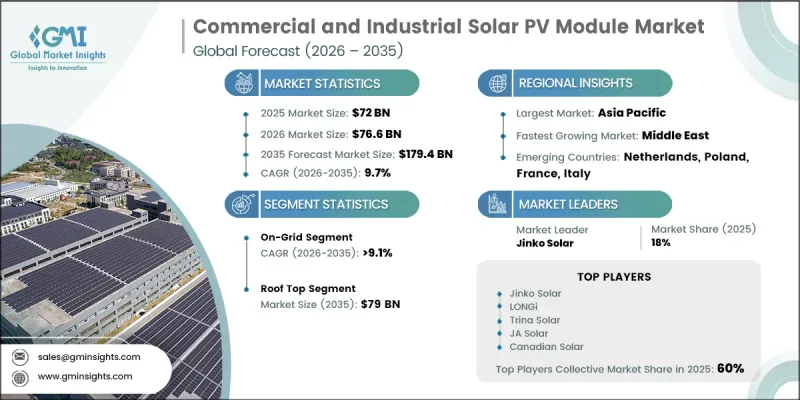
The market is experiencing strong expansion driven by rising investments from commercial buildings, industrial facilities, warehouses, data centers, and manufacturing units that are increasingly adopting solar energy systems to reduce electricity expenses and achieve sustainability targets. Demand for high-efficiency PV modules specifically designed for commercial and industrial applications is further strengthening market growth worldwide. Government support continues to play a pivotal role, with incentives such as tax credits, subsidies, and net metering frameworks encouraging large-scale adoption of solar solutions. These policy measures reduce upfront installation costs, making solar energy more financially viable for enterprises and expanding market penetration across regions. Ongoing technological advancements, including high-efficiency cell architectures, bifacial module designs, and improved material durability, are enabling higher energy output within limited installation spaces. This improved performance significantly enhances return on investment, driving wider adoption across both small and large-scale commercial and industrial users. Increasing focus on energy cost control and long-term operational efficiency is also accelerating deployment across global markets, while corporate sustainability commitments continue to reinforce the transition toward renewable energy systems.
| Market Scope | |
|---|---|
| Start Year | 2025 |
| Forecast Year | 2026-2035 |
| Start Value | $72 Billion |
| Forecast Value | $179.4 Billion |
| CAGR | 9.7% |
The on-grid segment is expected to grow at a CAGR of 9.1% through 2035. Growth in this segment is supported by rising demand for dependable and cost-effective electricity solutions that integrate seamlessly with existing grid infrastructure. Reduced reliance on conventional power sources, combined with supportive government incentives, net metering benefits, and tax advantages, is strengthening adoption across industrial users. Continuous improvements in module efficiency, system reliability, and smart grid compatibility are further enhancing the attractiveness of on-grid solar systems.
The rooftop segment is projected to reach USD 79 billion by 2035. Increasing emphasis on energy cost optimization and long-term savings is driving widespread adoption of rooftop solar systems among commercial and industrial users. Fluctuating electricity prices are encouraging businesses to stabilize energy expenditures through self-generation models. Supportive regulatory frameworks and incentive programs are further contributing to the expansion of rooftop installations across various sectors.
United States Commercial & Industrial Solar PV Module Market is projected to grow at a CAGR of 8% through 2035. Market growth is driven by increasing corporate focus on environmental responsibility and sustainability initiatives that are influencing investment decisions. Companies are adopting solar solutions to enhance brand reputation and strengthen stakeholder trust. Favorable incentive programs, tax benefits, and renewable energy policies are further encouraging large-scale deployment of solar PV systems across industrial and commercial facilities.
Major players operating in the Global Commercial & Industrial Solar PV Module Industry include First Solar, JinkoSolar, LONGi, Trina Solar, JA SOLAR Technology Co., Ltd, Canadian Solar, Risen Energy, SunPower Corporation, Vikram Solar, Waaree, Hanwha Group, Reliance Industries Limited, REC Solar Panels, AIKO Solar, Boviet Solar, CHINT Solar, Maysun Solar, Mission Solar, Rayzon Solar, and Standard Solar. Companies in the commercial & industrial solar PV module market are strengthening their competitive position through continuous innovation in high-efficiency solar technologies and advanced module designs such as bifacial and high-density cell structures. They are expanding production capacity and investing in vertically integrated supply chains to reduce costs and improve reliability. Strategic partnerships with commercial developers and industrial operators are enabling large-scale project deployments. Firms are also focusing on regional expansion in high-growth markets supported by favorable policies and incentives. In addition, digital monitoring solutions and smart energy management systems are being integrated to enhance performance tracking and operational efficiency.
Table of Contents
Chapter 1 Methodology & Scope
- 1.1 Research design
- 1.2 Quality commitment
- 1.2.1 GMI AI policy & data integrity commitment
- 1.2.1.1 Source consistency protocol
- 1.2.1 GMI AI policy & data integrity commitment
- 1.3 Research trail & confidence scoring
- 1.3.1 Research trail components
- 1.3.2 Scoring components
- 1.4 Data collection
- 1.4.1 Partial list of primary sources
- 1.5 Data mining sources
- 1.5.1 Paid sources
- 1.5.1.1 Sources, by region
- 1.5.1 Paid sources
- 1.6 Base estimates and calculations
- 1.6.1 Base year calculation for any one approach
- 1.7 Forecast model
- 1.8 Research transparency addendum
- 1.8.1 Source attribution framework
- 1.8.2 Quality assurance metrics
- 1.8.3 Our commitment to trust
- 1.9 Market definitions
Chapter 2 Executive Summary
- 2.1 Industry synopsis, 2022 - 2035
- 2.2 Business trends
- 2.3 Connectivity trends
- 2.4 Mounting trends
- 2.5 Technology trends
- 2.6 Regional trends
Chapter 3 Industry Insights
- 3.1 Industry ecosystem
- 3.1.1 Raw material availability & sourcing analysis
- 3.1.2 Manufacturing capacity assessment
- 3.1.3 Supply chain resilience & risk factors
- 3.1.4 Distribution network analysis
- 3.2 Regulatory landscape
- 3.2.1 North America
- 3.2.2 Europe
- 3.2.3 Asia Pacific
- 3.2.4 Middle East
- 3.2.5 Africa
- 3.2.6 Latin America
- 3.3 Industry impact forces
- 3.3.1 Growth drivers
- 3.3.2 Industry pitfalls & challenges
- 3.4 Growth potential analysis
- 3.5 Porter's analysis
- 3.5.1 Bargaining power of suppliers
- 3.5.2 Bargaining power of buyers
- 3.5.3 Threat of new entrants
- 3.5.4 Threat of substitutes
- 3.6 PESTEL analysis
- 3.6.1 Political factors
- 3.6.2 Economic factors
- 3.6.3 Social factors
- 3.6.4 Technological factors
- 3.6.5 Legal factors
- 3.6.6 Environmental factors
- 3.7 Cost structure analysis
- 3.7.1 Bill of Materials Breakdown
- 3.7.2 Manufacturing Cost Evolution & Learning Curve
- 3.7.3 Balance of System Cost Trends
- 3.8 Price trend analysis (Driven by Primary Research)
- 3.8.1 Historical price trend analysis
- 3.8.2 Pricing strategy by player type
- 3.9 Trade data analysis (Driven by Primary Research)
- 3.9.1 Import/export value trends
- 3.9.2 Key trade corridors & tariff impact
- 3.10 Production capacity & utilization (Driven by Primary Research)
- 3.10.1 Production capacity by country
- 3.10.2 Utilization rates and expansion pipeline
- 3.11 Impact of AI & generative AI on the market [SOLUTION CORE]
- 3.11.1 Predictive maintenance & fault detection
- 3.11.2 Grid optimization & load forecasting
- 3.11.3 Digital twin simulation & testing
- 3.11.4 Risks, limitations & regulatory considerations
- 3.12 Emerging opportunities & trends
- 3.12.1 Agrivoltaics & Dual-Use Applications
- 3.12.2 Building-Integrated Photovoltaics (BIPV)
- 3.12.3 Floating Solar for Industrial Water Bodies
- 3.12.4 EV Charging Infrastructure Integration
- 3.13 Digitalization & IoT integration
- 3.13.1 Smart module technology and monitoring systems
- 3.13.2 Blockchain for Energy Trading & Certification
- 3.13.3 Digital Platform Ecosystems for Project Management
- 3.14 Investment analysis and future outlook
Chapter 4 Competitive landscape, 2026
- 4.1 Introduction
- 4.2 Company market share analysis, by region, 2025
- 4.2.1 North America
- 4.2.2 Europe
- 4.2.3 Asia Pacific
- 4.2.4 Middle East
- 4.2.5 Africa
- 4.2.6 Latin America
- 4.3 Competitive analysis of major market players
- 4.4 Competitive positioning matrix
- 4.5 Key developments
- 4.5.1 Mergers & acquisitions
- 4.5.2 Partnerships & collaborations
- 4.5.3 New product launches
- 4.5.4 Expansion plans & funding
- 4.6 Company tier benchmarking
- 4.6.1 Tier classification criteria & qualifying thresholds
- 4.6.2 Tier positioning matrix by revenue, geography & innovation
Chapter 5 Market Size and Forecast, By Connectivity, 2022 - 2035 (USD Million & MW)
- 5.1 Key trends
- 5.2 On grid
- 5.3 Off grid
Chapter 6 Market Size and Forecast, By Mounting, 2022 - 2035 (USD Million & MW)
- 6.1 Key trends
- 6.2 Ground Mounted
- 6.3 Rooftop
Chapter 7 Market Size and Forecast, By Technology, 2022 - 2035 (USD Million & MW)
- 7.1 Key trends
- 7.2 Monocrystalline
- 7.2.1 PERC
- 7.2.2 TopCon
- 7.2.3 HJT
- 7.2.4 IBC
- 7.3 Polycrystalline
- 7.4 Thin film
- 7.4.1 Cadmium Telluride (CdTe)
- 7.4.2 Amorphous Silicon (a-Si)
- 7.4.3 CIGS (Copper Indium Gallium Selenide)
Chapter 8 Market Size and Forecast, By Region, 2022 - 2035 (USD Million & MW)
- 8.1 Key trends
- 8.2 North America
- 8.2.1 U.S.
- 8.2.2 Canada
- 8.2.3 Mexico
- 8.3 Europe
- 8.3.1 Austria
- 8.3.2 Norway
- 8.3.3 Denmark
- 8.3.4 Finland
- 8.3.5 Germany
- 8.3.6 Italy
- 8.3.7 Switzerland
- 8.3.8 Spain
- 8.3.9 Sweden
- 8.3.10 UK
- 8.3.11 Netherlands
- 8.3.12 Poland
- 8.3.13 Belgium
- 8.3.14 Ireland
- 8.3.15 Baltics
- 8.3.16 Portugal
- 8.4 Asia Pacific
- 8.4.1 China
- 8.4.2 Australia
- 8.4.3 India
- 8.4.4 Japan
- 8.4.5 South Korea
- 8.4.6 Thailand
- 8.4.7 Philippines
- 8.4.8 Vietnam
- 8.4.9 Malaysia
- 8.4.10 Singapore
- 8.5 Middle East
- 8.5.1 Israel
- 8.5.2 Saudi Arabia
- 8.5.3 UAE
- 8.5.4 Jordan
- 8.5.5 Oman
- 8.5.6 Kuwait
- 8.5.7 Turkey
- 8.6 Africa
- 8.6.1 South Africa
- 8.6.2 Egypt
- 8.6.3 Algeria
- 8.6.4 Nigeria
- 8.6.5 Morocco
- 8.7 Latin America
- 8.7.1 Brazil
- 8.7.2 Chile
- 8.7.3 Argentina
- 8.7.4 Peru
Chapter 9 Company Profiles
- 9.1 AIKO Solar
- 9.2 Boviet Solar
- 9.3 Canadian Solar
- 9.4 CHINT Solar
- 9.5 First Solar
- 9.6 Hanwha Group
- 9.7 JA SOLAR Technology
- 9.8 JinkoSolar
- 9.9 LONGi
- 9.10 Maysun Solar
- 9.11 Mission Solar
- 9.12 Risen Energy
- 9.13 Rayzon Solar
- 9.14 REC Solar Panels
- 9.15 Reliance Industries Limited
- 9.16 Standard Solar
- 9.17 SunPower Corporation
- 9.18 Trina Solar
- 9.19 Vikram Solar
- 9.20 Waaree
