
|
시장보고서
상품코드
2061469
침대 버스 시장 기회, 성장요인, 업계 동향 분석 및 예측(2026-2035년)Sleeper Buses Market Opportunity, Growth Drivers, Industry Trend Analysis, and Forecast 2026 - 2035 |
||||||
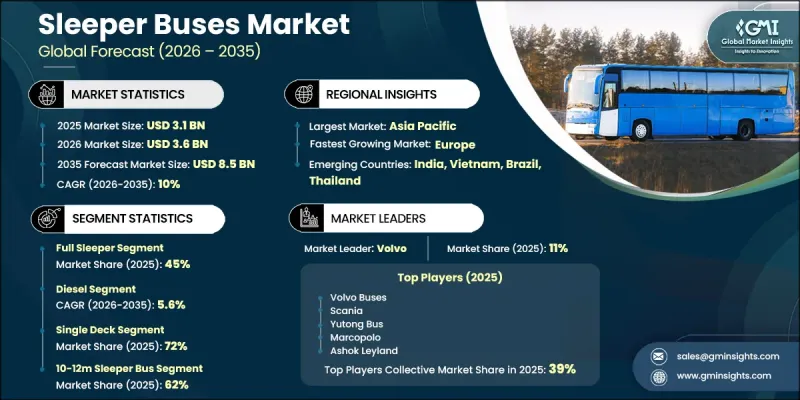
세계의 침대 버스 시장은 2025년에 31억 달러로 평가되고 CAGR 10%로 성장하며, 2035년까지 85억 달러에 달할 것으로 추정되고 있습니다.

장거리 도로 운송 네트워크의 확대와 지역 간 고속도로망의 지속적인 확충에 힘입어 시장은 강력한 성장세를 보이고 있습니다. 도시 간 및 주 간 이동이 증가함에 따라 장거리 여객 운송 솔루션, 특히 야간 여행용으로 설계된 슬리퍼 버스에 대한 의존도가 높아지고 있습니다. 인구 이동성의 증가, 관광 활동의 확대, 그리고 비용 효율이 높은 장거리 이동에 대한 선호도가 높아지면서 시장 수요가 더욱 강화되고 있습니다. 공공 및 민간 사업자들의 차량 현대화 노력에 힘입어, 승차감 향상, 서스펜션 시스템 개선, 디지털 모니터링 툴 및 커넥티드 카 기술을 갖춘 첨단 슬리퍼 버스의 도입이 가속화되고 있습니다. 또한 사업자들은 텔레매틱스 및 GPS 기반 차량 관리 시스템을 도입하여 업무 효율성, 안전성 및 경로 최적화를 도모하고 있습니다. 또한 환경 규제의 강화와 지속가능성 목표에 따라 전기자동차나 대체 연료를 동력으로 하는 침대버스로의 전환이 촉진되면서, 차량 구성이 서서히 변화하고 있습니다. 지속적인 인프라 확충과 효율적인 여객 수송 솔루션에 대한 수요 증가가 맞물리면서, 전 세계 침대버스 업계 전반에 걸쳐 장기적인 시장 성장이 지속될 것으로 예상됩니다.
| 시장 범위 | |
|---|---|
| 시작연도 | 2025년 |
| 예측 기간 | 2026-2035년 |
| 개시 금액 | 31억 달러 |
| 예측액 | 85억 달러 |
| CAGR | 10% |
풀 슬리퍼 부문은 2025년에 45%의 시장 점유율을 차지하며, 2035년까지 연평균 성장률(CAGR) 9.2%로 성장할 것으로 전망됩니다. 장거리 야간 이동에 대한 편의성 수요가 높아짐에 따라 이 부문은 계속해서 시장을 주도하고 있습니다. 풀 슬리퍼 사양은 승객의 휴식과 편의성이 최우선으로 고려되는 장거리 도시 간 및 주 간 노선에서 널리 선호되고 있습니다. 이러한 보급을 지원하고 있는 것은 여행의 편의성 향상에 대한 기대감이 높아지고 있기 때문입니다. 특히 500km를 넘는 여정의 경우, 휴식을 취할 수 있는 좌석 솔루션이 승객의 경험과 이동 효율을 크게 향상시키기 때문에 이에 대한 수요는 더욱 높아지고 있습니다.
디젤 부문은 2025년에 82%의 시장 점유율을 차지하며, 2026-2035년 연평균 성장률(CAGR) 5.6%로 성장할 것으로 전망됩니다. 디젤 구동 슬리퍼 버스는 운영상의 신뢰성, 장거리 주행 능력, 그리고 잘 구축된 주유 인프라 덕분에 여전히 주도적인 위치를 유지하고 있습니다. 이러한 차량은 비용 효율성이 뛰어나고 고속도로망 전반에서 안정적인 성능을 발휘하므로 장거리 운송 사업자들에게 여전히 선호되는 선택지입니다. 연료의 접근성이 높고 초기 투자 비용이 낮다는 점도 슬리퍼 버스 시장에서 디젤 차량의 우위를 더욱 공고히 하고 있습니다.
중국의 침대 버스 시장은 60%의 점유율을 차지했으며, 2025년에는 9억 3,780만 달러의 시장 규모를 기록했습니다. 해당 국가의 시장 성장은 도시 간 교통망의 확대, 승객의 이동 수요 증가, 그리고 경제적인 야간 이동 수단에 대한 수요 증가에 힘입어 이루어지고 있습니다. 고속도로 인프라의 지속적인 확충과 장거리 운송 회랑의 확대로 인해, 침대버스 차량의 운영 효율이 크게 향상되었습니다. 체계적으로 조직된 민간 사업자의 존재와 도시 지역과 지방 중심지 간의 활발한 여객 이동이 전국적인 시장 수요를 더욱 부추기고 있습니다.
자주 묻는 질문
목차
제1장 조사 방법
제2장 개요
제3장 업계 인사이트
제4장 경쟁 구도
제5장 시장 추산·예측 : 구성별, 2022-2035년
제6장 시장 추산·예측 : 추진력별, 2022-2035년
제7장 시장 추산·예측 : 데크 유형별, 2022-2035년
제8장 시장 추산·예측 : 버스 길이별, 2022-2035년
제9장 시장 추산·예측 : 차축 유형별, 2022-2035년
제10장 시장 추산·예측 : 용도별, 2022-2035년
제11장 시장 추산·예측 : 소유 형태별, 2022-2035년
제12장 시장 추산·예측 : 지역별, 2022-2035년
제13장 기업 개요
KSAThe Global Sleeper Buses Market was valued at USD 3.1 billion in 2025 and is estimated to grow at a CAGR of 10% to reach USD 8.5 billion by 2035.
The market is witnessing strong growth momentum driven by the expansion of long-distance road transport networks and continuous improvements in highway connectivity across regions. Rising intercity and interstate mobility is increasing reliance on long-haul passenger transport solutions, particularly sleeper buses designed for overnight travel. Growing population mobility, expanding tourism activity, and increasing preference for cost-efficient long-distance travel are further strengthening market demand. Fleet modernization initiatives across public and private operators are accelerating the adoption of advanced sleeper buses equipped with enhanced comfort features, improved suspension systems, digital monitoring tools, and connected vehicle technologies. Operators are also integrating telematics and GPS-enabled fleet management systems to improve operational efficiency, safety, and route optimization. In addition, tightening environmental regulations and sustainability goals are encouraging the shift toward electric and alternative fuel-powered sleeper buses, gradually reshaping fleet composition. Continuous infrastructure upgrades, combined with rising demand for efficient passenger mobility solutions, are expected to sustain long-term market growth across the global sleeper buses industry.
| Market Scope | |
|---|---|
| Start Year | 2025 |
| Forecast Year | 2026-2035 |
| Start Value | $3.1 Billion |
| Forecast Value | $8.5 Billion |
| CAGR | 10% |
The full sleeper segment held a 45% share in 2025 and is projected to grow at a CAGR of 9.2% through 2035. This segment continues to dominate due to increasing demand for enhanced comfort during long-distance overnight travel. Full sleeper configurations are widely preferred on extended intercity and interstate routes where passenger rest and convenience are key priorities. Their strong adoption is supported by growing expectations for improved travel comfort, especially on journeys exceeding 500 km, where rest-enabled seating solutions significantly enhance passenger experience and travel efficiency.
The diesel segment accounted for 82% share in 2025 and is expected to grow at a CAGR of 5.6% between 2026 and 2035. Diesel-powered sleeper buses continue to lead due to their operational reliability, extended driving range, and well-established refueling infrastructure. These vehicles remain the preferred choice for long-distance transport operators because of their cost-effectiveness and consistent performance across highway networks. Widespread fuel availability and lower initial investment requirements further support their dominance in the sleeper buses market.
China Sleeper Buses Market held a 60% share, generating USD 937.8 million in 2025. Market growth in the country is supported by expanding intercity transportation networks, increasing passenger mobility, and rising demand for economical overnight travel options. Continuous upgrades in highway infrastructure and the expansion of long-distance transport corridors have significantly improved operational efficiency for sleeper bus fleets. The presence of organized private operators and strong passenger movement between urban and regional centers further strengthens market demand across the country.
Major companies operating in the Sleeper Buses Market include Tata Motors, Volvo Buses, Scania, Marcopolo, Ashok Leyland, Zhongtong Bus, Yutong Bus, Higer Bus, Irizar, and King Long. Companies operating in the sleeper buses market are adopting multiple strategies to strengthen their market presence and expand operational reach. Leading manufacturers are focusing on advanced vehicle engineering, enhanced passenger comfort systems, and improved safety features to differentiate their offerings. Investment in electric and alternative fuel technologies is increasing as companies align with global emission reduction targets and sustainability goals. Strategic partnerships with fleet operators, transport authorities, and tourism companies are supporting the wider deployment of sleeper bus solutions. Manufacturers are also integrating digital technologies such as telematics, GPS tracking, and smart fleet management systems to improve efficiency and route optimization.
Table of Contents
Chapter 1 Research Methodology
- 1.1 Research approach
- 1.2 Quality Commitments
- 1.2.1 GMI AI policy & data integrity commitment
- 1.2.1.1 Source consistency protocol
- 1.2.1 GMI AI policy & data integrity commitment
- 1.3 Research Trail & Confidence Scoring
- 1.3.1 Research Trail Components
- 1.3.2 Scoring Components
- 1.4 Data Collection
- 1.4.1 Partial list of primary sources
- 1.5 Data mining sources
- 1.5.1 Paid sources
- 1.5.1.1 Sources, by region
- 1.5.1 Paid sources
- 1.6 Base estimates and calculations
- 1.6.1 Base year calculation for any one approach
- 1.7 Forecast model
- 1.7.1 Quantified market impact analysis
- 1.7.1.1 Mathematical impact of growth parameters on forecast
- 1.7.1 Quantified market impact analysis
- 1.8 Research transparency addendum
- 1.8.1 Source attribution framework
- 1.8.2 Quality assurance metrics
- 1.8.3 Our commitment to trust
Chapter 2 Executive Summary
- 2.1 Industry 360° synopsis, 2022 - 2035
- 2.2 Key market trends
- 2.2.1 Regional
- 2.2.2 Configuration
- 2.2.3 Propulsion
- 2.2.4 Deck Type
- 2.2.5 Bus Length
- 2.2.6 Axle Type
- 2.2.7 Application
- 2.2.8 Ownership
- 2.3 TAM Analysis, 2026-2035
- 2.4 CXO perspectives: Strategic imperatives
Chapter 3 Industry Insights
- 3.1 Industry ecosystem analysis
- 3.1.1 Supplier landscape
- 3.1.2 Profit margin analysis
- 3.1.3 Cost structure
- 3.1.4 Value addition at each stage
- 3.1.5 Factor affecting the value chain
- 3.1.6 Disruptions
- 3.2 Industry impact forces
- 3.2.1 Growth drivers
- 3.2.1.1 Rising long distance and intercity passenger travel demand
- 3.2.1.2 Expansion of highway and road transportation infrastructure
- 3.2.1.3 Growth in tourism and group travel activities
- 3.2.1.4 Fleet modernization by transport operators
- 3.2.2 Industry pitfalls and challenges
- 3.2.2.1 High initial procurement and maintenance costs
- 3.2.2.2 Regulatory compliance and emission standards
- 3.2.3 Market opportunities
- 3.2.3.1 Rising adoption of electric and alternative fuel sleeper buses
- 3.2.3.2 Expansion of premium and luxury bus transportation services
- 3.2.3.3 Growth in smart transportation and connected fleet technologies
- 3.2.1 Growth drivers
- 3.3 Growth potential analysis
- 3.4 Technology and innovation landscape
- 3.4.1 Current technological trends
- 3.4.2 Emerging technologies
- 3.5 Pricing Analysis (Driven by primary research)
- 3.5.1 Historical Price Trend Analysis
- 3.5.2 Pricing Strategy by Player Type
- 3.6 Regulatory landscape
- 3.6.1 North America
- 3.6.1.1 U.S. Federal Motor Carrier Safety Administration passenger transportation regulations
- 3.6.1.2 National Highway Traffic Safety Administration bus safety standards
- 3.6.1.3 Environmental Protection Agency heavy duty vehicle emission regulations
- 3.6.1.4 Americans with Disabilities Act accessibility standards
- 3.6.1.5 Transport Canada commercial passenger vehicle regulations
- 3.6.2 Europe
- 3.6.2.1 European Union General Safety Regulation for commercial vehicles
- 3.6.2.2 Euro VI emission standards for buses
- 3.6.2.3 UNECE passenger vehicle safety standards
- 3.6.2.4 European passenger rights regulations for bus transportation
- 3.6.2.5 Cross border road transportation compliance frameworks
- 3.6.3 Asia Pacific
- 3.6.3.1 China commercial bus safety and emission regulations
- 3.6.3.2 China VI heavy duty vehicle emission standards
- 3.6.3.3 India Central Motor Vehicles Rules and AIS standards
- 3.6.3.4 Japan commercial passenger vehicle inspection regulations
- 3.6.3.5 Australia heavy passenger vehicle safety standards
- 3.6.4 Latin America
- 3.6.4.1 Brazil commercial passenger transportation regulations
- 3.6.4.2 Brazil PROCONVE emission standards
- 3.6.4.3 Mexico commercial vehicle safety regulations
- 3.6.4.4 Mercosur regional transportation compliance frameworks
- 3.6.5 Middle East & Africa
- 3.6.5.1 GCC commercial vehicle technical regulations
- 3.6.5.2 Saudi Arabia SASO vehicle conformity standards
- 3.6.5.3 UAE passenger transportation operational regulations
- 3.6.5.4 South Africa commercial vehicle safety standards
- 3.6.5.5 African regional transportation harmonization frameworks
- 3.6.1 North America
- 3.7 Porter’s analysis
- 3.8 PESTEL analysis
- 3.9 Patent analysis (Driven by primary research)
- 3.10 Trade Data Analysis (Driven by paid database)
- 3.10.1 Import/export volume & value trends
- 3.10.2 Key trade corridors & tariff impact
- 3.11 Cost breakdown analysis
- 3.12 Impact of AI and Generative AI on the Market
- 3.12.1 AI Driven Disruption of Existing Business Models
- 3.12.2 GenAI Use Cases and Adoption Roadmap by Segment
- 3.12.3 Risks Limitations and Regulatory Considerations
- 3.13 Capacity & Production Landscape (Driven by Primary Research)
- 3.13.1 Installed Capacity by Region & Key Producer
- 3.13.2 Capacity Utilization Rates & Expansion Pipelines
- 3.14 Sustainability and environmental aspects
- 3.14.1 Sustainable practices
- 3.14.2 Waste reduction strategies
- 3.14.3 Energy efficiency in production
- 3.14.4 Eco-friendly Initiatives
- 3.14.5 Carbon footprint considerations
- 3.15 Forecast assumptions & scenario analysis (Driven by Primary Research)
- 3.15.1 Base Case- Key Macro & Industry Variables Driving CAGR
- 3.15.2 Optimistic Scenarios- Favorable macro and industry tailwinds
- 3.15.3 Pessimistic Scenario - Macroeconomic slowdown or industry headwinds
Chapter 4 Competitive Landscape, 2025
- 4.1 Introduction
- 4.2 Company market share analysis
- 4.2.1 North America
- 4.2.2 Europe
- 4.2.3 Asia Pacific
- 4.2.4 LATAM
- 4.2.5 MEA
- 4.3 Competitive analysis of major market players
- 4.4 Competitive positioning matrix
- 4.5 Key developments
- 4.5.1 Mergers & acquisitions
- 4.5.2 Partnerships & collaborations
- 4.5.3 New Product Launches
- 4.5.4 Expansion Plans and funding
- 4.6 Company tier benchmarking
- 4.6.1 Tier classification criteria & qualifying thresholds
- 4.6.2 Tier positioning matrix by revenue, geography & innovation
Chapter 5 Market Estimates & Forecast, By Configuration, 2022 - 2035 (USD Mn, Units)
- 5.1 Key trends
- 5.2 Semi-Sleeper
- 5.3 Full Sleeper
- 5.4 Seater-Sleeper Combination
Chapter 6 Market Estimates & Forecast, By Propulsion, 2022 - 2035 (USD Mn, Units)
- 6.1 Key trends
- 6.2 Diesel
- 6.3 CNG/LNG
- 6.4 Hybrid
- 6.5 Electric
Chapter 7 Market Estimates & Forecast, By Deck Type, 2022 - 2035 (USD Mn, Units)
- 7.1 Key trends
- 7.2 Single Deck
- 7.3 Double Deck
Chapter 8 Market Estimates & Forecast, By Bus Length, 2022 - 2035 (USD Mn, Units)
- 8.1 Key trends
- 8.2 Below 10 m
- 8.3 10-12 m
- 8.4 Above 12 m
Chapter 9 Market Estimates & Forecast, By Axle Type, 2022 - 2035 (USD Mn, Units)
- 9.1 Key trends
- 9.2 Single Axle
- 9.3 Multi-Axle
Chapter 10 Market Estimates & Forecast, By Application, 2022 - 2035 (USD Mn, Units)
- 10.1 Key trends
- 10.2 Scheduled Intercity Services
- 10.3 Charter Services
- 10.4 Tourism Services
- 10.5 Corporate/Staff Transportation
Chapter 11 Market Estimates & Forecast, By Ownership, 2022 - 2035 (USD Mn, Units)
- 11.1 Key trends
- 11.2 Private Fleet Operators
- 11.3 Government/Public Transport Operators
Chapter 12 Market Estimates & Forecast, By Region, 2022 - 2035 (USD Mn, Units)
- 12.1 Key trends
- 12.2 North America
- 12.2.1 US
- 12.2.2 Canada
- 12.3 Europe
- 12.3.1 Germany
- 12.3.2 UK
- 12.3.3 France
- 12.3.4 Italy
- 12.3.5 Spain
- 12.3.6 Russia
- 12.3.7 Norway
- 12.3.8 Netherlands
- 12.3.9 Sweden
- 12.4 Asia Pacific
- 12.4.1 China
- 12.4.2 India
- 12.4.3 Japan
- 12.4.4 Australia
- 12.4.5 South Korea
- 12.4.6 Singapore
- 12.4.7 Thailand
- 12.4.8 Indonesia
- 12.4.9 Vietnam
- 12.5 Latin America
- 12.5.1 Brazil
- 12.5.2 Mexico
- 12.5.3 Argentina
- 12.6 MEA
- 12.6.1 South Africa
- 12.6.2 Saudi Arabia
- 12.6.3 UAE
- 12.6.4 Turkey
Chapter 13 Company Profiles
- 13.1 Global Players
- 13.1.1 Higer Bus
- 13.1.2 King Long
- 13.1.3 Scania
- 13.1.4 Tata Motors
- 13.1.5 Volvo Buses
- 13.1.6 Yutong Bus
- 13.2 Regional Players
- 13.2.1 Ankai (Anhui Ankai Automobile)
- 13.2.2 Ashok Leyland
- 13.2.3 Irizar
- 13.2.4 MAN Truck & Bus SE
- 13.2.5 Marcopolo
- 13.2.6 SML Isuzu
- 13.2.7 THACO
- 13.2.8 VE Commercial Vehicles (Eicher Trucks & Buses)
- 13.2.9 Zhongtong Bus
- 13.3 Emerging Players / Disruptors
- 13.3.1 LeafyBus
- 13.3.2 NueGo (GreenCell Mobility)
- 13.3.3 Olectra Greentech
- 13.3.4 Switch Mobility
- 13.3.5 Zhengzhou Yutong New Energy
