
|
시장보고서
상품코드
2061473
태양광발전 시장 기회, 성장요인, 업계 동향 분석 및 예측(2026-2035년)Solar Photovoltaic (PV) Market Opportunity, Growth Drivers, Industry Trend Analysis, and Forecast 2026 - 2035 |
||||||
세계의 태양광발전 시장은 2025년에 4,043억 달러로 평가되고 CAGR 8.3%로 성장하며, 2035년까지 8,676억 달러에 달할 것으로 추정되고 있습니다.

이 업계는 전 세계에서 재생에너지 솔루션의 보급 확대와 대규모 발전소, 상업 시설, 분산형 발전 프로젝트에서의 도입 증가에 힘입어 강력한 성장을 달성하고 있습니다. 농업 및 상업 환경에서의 태양광발전 시스템 활용 확대는 에너지 생산과 경제적 생산성 모두를 지원하는 토지의 이중 활용을 가능하게 하여, 수요를 더욱 높이고 있습니다. 태양광발전 설비의 생산 능력 확대를 위한 지속적인 투자와 이해관계자들의 관심이 높아짐에 따라 공급 능력이 더욱 강화되고 있습니다. 설치 비용의 감소, 패널 효율의 향상, 그리고 유리한 조건의 부지 확보가 대규모 도입을 가속화하고 있습니다. 또한 기존 전력원과 비교했을 때 태양광발전의 비용 경쟁력이 높아짐에 따라 태양광발전의 더 광범위한 보급이 지원되고 있습니다. 전 세계적인 자금 조달 구상의 증가와 태양광발전 설비 제조의 현지화 역시 업계의 성장을 지원하고 있습니다. 양면 수광 모듈 및 박막 기술의 혁신과 같은 기술적 진보에 힘입어 발전량과 효율이 향상되고 있으며, 이는 다양한 용도에서의 시장 침투를 더욱 촉진하고 있습니다.
| 시장 범위 | |
|---|---|
| 시작연도 | 2025년 |
| 예측 기간 | 2026-2035년 |
| 개시 금액 | 4,043억 달러 |
| 예측액 | 8,676억 달러 |
| CAGR | 8.3% |
태양광발전 업계는 농업 시스템 및 상업 인프라와의 통합을 통해 혜택을 보고 있으며, 토지 활용 최적화와 복합 용도 활용이 주목받고 있습니다. 이러한 시스템은 청정 전력을 생산할 뿐만 아니라, 토지 전체의 생산성을 높이고, 다양한 분야를 아우르는 가치 창출을 지원하고 있습니다. 제조 생태계에 대한 기업의 투자 확대와 지속적인 설비 확충을 통해 전 세계 공급망이 강화되고 있습니다. 경제성 향상과 도입 여건의 개선에 힘입어 대규모 태양광발전 프로젝트가 탄력을 받고 있습니다. 패널 성능 향상과 설계 혁신을 통해 효율이 더욱 높아지면서, 태양광발전의 대규모 도입이 점점 더 현실적인 선택지가 되고 있습니다.
오프그리드 태양광발전 부문은 2026-2035년 연평균 성장률(CAGR) 14.3%로 성장할 것으로 예상됩니다. 이러한 성장은 주로 신뢰할 수 있는 송전망에 대한 접근이 여전히 제한적인 외딴 지역이나 전력 공급이 부족한 지역의 전력 수요 증가에 의해 주도되고 있습니다. 농촌 지역의 전기화 프로그램 확대, 에너지 저장 기술의 발전, 태양광 부품 비용의 하락, 그리고 이를 지원하는 정책 체계가 맞물려 도입을 촉진하고 있습니다. 또한 오프그리드 분야에서의 스마트 에너지 관리 시스템 도입 확대는 에너지 최적화와 시스템 신뢰성을 높여, 시장 기회를 더욱 확대하고 있습니다.
옥상 태양광발전 부문은 분산형 에너지 솔루션의 도입 확대와 에너지 공급자와 최종사용자 간의 협력 강화에 힘입어, 2026-2035년 연평균 성장률(CAGR) 8.3%로 성장할 것으로 전망됩니다. 분산형 발전 시스템과 지역 밀착형 태양광발전 구상에 대한 관심이 높아짐에 따라 주거용 및 상업용 옥상에서 해당 부문의 성장이 더욱 가속화되고 있습니다.
미국의 태양광발전 시장은 2025년에 360억 달러 규모에 달했습니다. 북미는 2025년 세계 시장에서 9.2%의 점유율을 차지하고 있으며, 2035년까지 그 입지를 더욱 공고히 할 것으로 예상됩니다. 태양광발전 설비와 함께 에너지 저장 시스템의 도입이 증가하고 있는 것이 태양광발전과 에너지 저장을 결합한 통합 솔루션의 성장을 지원하고 있습니다. 투자 증가와 신뢰성이 높은 재생에너지에 대한 수요 증가가 이 지역에서의 도입을 더욱 가속화하고 있습니다.
자주 묻는 질문
목차
제1장 조사 방법과 범위
제2장 개요
제3장 업계 인사이트
제4장 경쟁 구도
제5장 시장 규모·예측 : 접속성별, 2022-2035년
제6장 시장 규모·예측 : 설치 방식별, 2022-2035년
제7장 시장 규모·예측 : 최종 사용별, 2022-2035년
제8장 시장 규모·예측 : 컴포넌트별, 2022-2035년
제9장 시장 규모·예측 : 기술별, 2022-2035년
제10장 시장 규모·예측 : 지역별, 2022-2035년
제11장 기업 개요
KSA 26.06.24The Global Solar Photovoltaic Market was valued at USD 404.3 billion in 2025 and is estimated to grow at a CAGR of 8.3% to reach USD 867.6 billion by 2035.
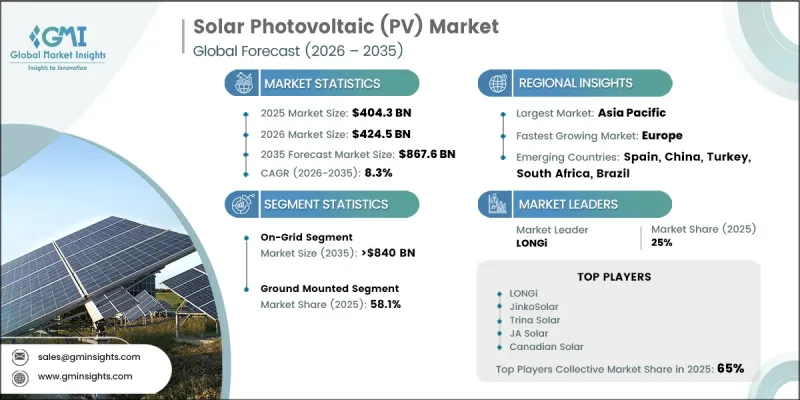
The industry is witnessing strong growth driven by rising global adoption of renewable energy solutions and increasing deployment across utility-scale, commercial, and distributed generation projects. Expanding use of solar PV systems across agricultural and commercial environments is further enhancing demand by enabling dual land utilization that supports both energy generation and economic productivity. Continuous investments in solar manufacturing capacity expansion and growing interest from corporate stakeholders are further strengthening supply capabilities. Declining installation costs, improving panel efficiencies, and favorable land availability are accelerating large-scale deployment. In addition, solar energy's increasing cost competitiveness compared to conventional power sources is supporting broader adoption. Rising global funding initiatives and localization of solar manufacturing are also reinforcing industry expansion. Technological advancements such as bifacial modules and thin-film innovations are improving energy output and efficiency, further driving market penetration across diverse applications.
| Market Scope | |
|---|---|
| Start Year | 2025 |
| Forecast Year | 2026-2035 |
| Start Value | $404.3 Billion |
| Forecast Value | $867.6 Billion |
| CAGR | 8.3% |
The solar photovoltaic industry is also benefiting from integration with agricultural systems and commercial infrastructure, where land optimization and dual-use applications are gaining traction. These systems not only generate clean electricity but also enhance overall land productivity, supporting cross-sector value creation. Expanding corporate investments in manufacturing ecosystems and ongoing capacity additions are strengthening the global supply chain. Utility-scale solar projects are gaining momentum due to improved economics and favorable deployment conditions. Enhanced panel performance and design innovation are further increasing efficiency levels, making solar power increasingly viable for large-scale adoption.
The off-grid solar photovoltaic segment is expected to grow at a CAGR of 14.3% from 2026 to 2035. This growth is primarily driven by rising electricity demand in remote and underserved regions where reliable grid access remains limited. Expanding rural electrification programs, advancements in energy storage technologies, declining costs of solar components, and supportive policy frameworks are collectively strengthening adoption. The increasing deployment of smart energy management systems in off-grid applications is also improving energy optimization and system reliability, further expanding market opportunities.
The rooftop solar photovoltaic segment is projected to grow at a CAGR of 8.3% from 2026 to 2035, supported by increasing adoption of decentralized energy solutions and growing collaboration between energy providers and end users. Rising interest in distributed generation systems and community-based solar initiatives is further supporting segment expansion across residential and commercial rooftops.
U.S. Solar Photovoltaic Market was valued at USD 36 billion in 2025. North America accounted for a 9.2% share of the global market in 2025 and is expected to strengthen its position through 2035. Increasing deployment of energy storage systems alongside solar installations is supporting the growth of integrated solar-plus-storage solutions. Rising investments and growing demand for reliable renewable energy are further accelerating regional adoption.
Prominent players operating in the Global Solar Photovoltaic Industry include Canadian Solar, First Solar, Jinko Solar, Trina Solar, JA Solar Technology, LONGi, Risen Energy, Q CELLS, REC Solar Holdings, SunPower Corporation, LG Electronics, Vikram Solar, Yingli Solar, Emmvee Solar, Motech Industries, Solaria Corporation, Solar Frontier, Renesola, GCL-SI, CsunSolarTech, Shenzhen Shine Solar, Su-vastika Solar, Shunfeng International Clean Energy, and Asun Trackers. Companies in the Global Solar Photovoltaic Market are focusing on expanding manufacturing capacities and improving technological efficiency to strengthen their market position. A key strategy involves investment in advanced solar technologies such as high-efficiency bifacial and thin-film modules to improve energy yield. Market participants are also enhancing vertical integration to secure supply chains and reduce production costs. Strategic partnerships with utilities, governments, and corporate buyers are supporting large-scale project development. Firms are increasingly investing in R&D to improve panel durability, efficiency, and performance under diverse environmental conditions. Geographic expansion into emerging markets is also a major focus to capture the rising demand. In addition, companies are adopting automation in manufacturing processes and digital monitoring systems to improve operational efficiency and project performance, while also aligning with sustainability and carbon reduction goals globally.
Table of Contents
Chapter 1 Methodology & Scope
- 1.1 Research design
- 1.2 Quality commitment
- 1.2.1 GMI AI policy & data integrity commitment
- 1.2.1.1 Source consistency protocol
- 1.2.1 GMI AI policy & data integrity commitment
- 1.3 Research Trail & Confidence Scoring
- 1.3.1 Research Trail Components
- 1.3.2 Scoring Components
- 1.4 Data Collection
- 1.4.1 Partial list of primary sources
- 1.5 Data mining sources
- 1.5.1 Paid sources
- 1.5.1.1 Sources, by region
- 1.5.1 Paid sources
- 1.6 Base estimates and calculations
- 1.6.1 Base year calculation for any one approach
- 1.7 Forecast model
- 1.8 Research transparency addendum
- 1.8.1 Source attribution framework
- 1.8.2 Quality assurance metrics
- 1.8.3 Our commitment to trust
- 1.9 Market definitions
Chapter 2 Executive Summary
- 2.1 Industry synopsis, 2022 - 2035
- 2.2 Business trends
- 2.3 Connectivity trends
- 2.4 Mounting trends
- 2.5 End use trends
- 2.6 Component trends
- 2.7 Technology trends
- 2.8 Regional trends
Chapter 3 Industry Insights
- 3.1 Industry ecosystem
- 3.1.1 Raw material availability & sourcing analysis
- 3.1.2 Manufacturing capacity assessment
- 3.1.3 Supply chain resilience & risk factors
- 3.1.4 Distribution network analysis
- 3.2 Regulatory landscape
- 3.2.1 Global Renewable Energy Mandates & Targets
- 3.2.2 Net Metering & Feed-in Tariff Policies
- 3.2.3 Import/Export Duties & Anti-Dumping Regulations
- 3.2.4 Permitting, Zoning & Land-Use Regulations
- 3.2.5 Carbon Credit & ESG Compliance Frameworks
- 3.3 Industry impact forces
- 3.3.1 Growth drivers
- 3.3.2 Industry pitfalls & challenges
- 3.4 Growth potential analysis
- 3.5 Porter's analysis
- 3.5.1 Bargaining power of suppliers
- 3.5.2 Bargaining power of buyers
- 3.5.3 Threat of new entrants
- 3.5.4 Threat of substitutes
- 3.6 PESTEL analysis
- 3.6.1 Political factors
- 3.6.2 Economic factors
- 3.6.3 Social factors
- 3.6.4 Technological factors
- 3.6.5 Legal factors
- 3.6.6 Environmental factors
- 3.7 Technology & innovation landscape
- 3.7.1 Next-Generation Panel Technologies
- 3.7.2 Bifacial & Tandem Cell Advancements
- 3.8 Cost structure analysis
- 3.9 Price trend analysis (Driven by Primary Research)
- 3.9.1 Historical price trend analysis
- 3.9.2 Pricing strategy by player type
- 3.10 Trade data analysis (Driven by Primary Research)
- 3.10.1 Import/export value trends
- 3.10.2 Key trade corridors & tariff impact
- 3.11 Production capacity & utilization (Driven by Primary Research)
- 3.11.1 Production capacity by country
- 3.11.2 Utilization rates and expansion pipeline
- 3.12 Impact of AI & generative AI on the market [SOLUTION CORE]
- 3.12.1 Predictive maintenance & fault detection
- 3.12.2 Grid optimization & load forecasting
- 3.12.3 Digital twin simulation & testing
- 3.12.4 Risks, limitations & regulatory considerations
- 3.13 Emerging opportunities & trends
- 3.14 Digitalization & IoT integration
- 3.15 Investment analysis and future outlook
Chapter 4 Competitive landscape, 2026
- 4.1 Introduction
- 4.2 Company market share analysis, by region, 2025
- 4.2.1 North America
- 4.2.2 Europe
- 4.2.3 Asia Pacific
- 4.2.4 Middle East
- 4.2.5 Africa
- 4.2.6 Latin America
- 4.3 Competitive analysis of major market players
- 4.4 Competitive positioning matrix
- 4.5 Key developments
- 4.5.1 Mergers & acquisitions
- 4.5.2 Partnerships & collaborations
- 4.5.3 New product launches
- 4.5.4 Expansion plans & funding
- 4.6 Company tier benchmarking
- 4.6.1 Tier classification criteria & qualifying thresholds
- 4.6.2 Tier positioning matrix by revenue, geography & innovation
Chapter 5 Market Size and Forecast, By Connectivity, 2022 - 2035 (USD Billion & MW)
- 5.1 Key trends
- 5.2 On grid
- 5.3 Off grid
Chapter 6 Market Size and Forecast, By Mounting, 2022 - 2035 (USD Billion & MW)
- 6.1 Key trends
- 6.2 Ground mounted
- 6.3 Roof top
Chapter 7 Market Size and Forecast, By End Use, 2022 - 2035 (USD Billion & MW)
- 7.1 Key trends
- 7.2 Residential
- 7.3 Commercial & industrial
- 7.4 Utility
Chapter 8 Market Size and Forecast, By Component, 2022 - 2035 (USD Billion & MW)
- 8.1 Key trends
- 8.2 Modules
- 8.3 Inverters
- 8.4 Trackers
- 8.5 BOS
Chapter 9 Market Size and Forecast, By Technology, 2022 - 2035 (USD Billion & MW)
- 9.1 Key trends
- 9.2 Monocrystalline
- 9.2.1 PERC
- 9.2.2 TopCon
- 9.2.3 HJT
- 9.2.4 IBC/TBC
- 9.3 Polycrystalline
- 9.4 Thin film
- 9.4.1 Cadmium Telluride
- 9.4.2 Amorphous Silicon
- 9.4.3 Copper Indium Gallium Diselenide
Chapter 10 Market Size and Forecast, By Region, 2022 - 2035 (USD Billion & MW)
- 10.1 Key trends
- 10.2 North America
- 10.2.1 U.S.
- 10.2.2 Canada
- 10.2.3 Mexico
- 10.3 Europe
- 10.3.1 Austria
- 10.3.2 Norway
- 10.3.3 Denmark
- 10.3.4 Finland
- 10.3.5 France
- 10.3.6 Italy
- 10.3.7 Switzerland
- 10.3.8 Spain
- 10.3.9 Sweden
- 10.3.10 UK
- 10.3.11 Netherlands
- 10.3.12 Poland
- 10.3.13 Belgium
- 10.3.14 Ireland
- 10.3.15 Baltics
- 10.3.16 Portugal
- 10.4 Asia Pacific
- 10.4.1 China
- 10.4.2 Japan
- 10.4.3 South Korea
- 10.4.4 India
- 10.4.5 Australia
- 10.4.6 Malaysia
- 10.4.7 Singapore
- 10.4.8 Thailand
- 10.4.9 Philippines
- 10.4.10 Vietnam
- 10.5 Middle East
- 10.5.1 Israel
- 10.5.2 Saudi Arabia
- 10.5.3 UAE
- 10.5.4 Jordan
- 10.5.5 Oman
- 10.5.6 Kuwait
- 10.5.7 Turkey
- 10.6 Africa
- 10.6.1 South Africa
- 10.6.2 Egypt
- 10.6.3 Algeria
- 10.6.4 Nigeria
- 10.6.5 Morocco
- 10.7 Latin America
- 10.7.1 Brazil
- 10.7.2 Argentina
- 10.7.3 Chile
- 10.7.4 Peru
Chapter 11 Company Profiles
- 11.1 Asun Trackers
- 11.2 Canadian Solar
- 11.3 CsunSolarTech
- 11.4 Emmvee Solar
- 11.5 First Solar
- 11.6 GCL-SI
- 11.7 Jinko Solar
- 11.8 JA Solar Technology
- 11.9 LONGi
- 11.10 Q CELLS
- 11.11 LG Electronics
- 11.12 Motech Industries
- 11.13 Renesola
- 11.14 REC Solar Holdings
- 11.15 Risen Energy
- 11.16 Solar Frontier KK
- 11.17 SunPower Corporation
- 11.18 Solaria Corporation
- 11.19 Shunfeng International Clean Energy
- 11.20 Shenzhen Shine Solar
- 11.21 Su-vastika Solar
- 11.22 Trina Solar
- 11.23 Vikram Solar
- 11.24 Yingli Solar
