
|
시장보고서
상품코드
2071237
바이오에너지 시장 : 기회, 성장요인, 업계 동향 분석 및 예측(2026-2035년)Bioenergy Market Opportunity, Growth Drivers, Industry Trend Analysis, and Forecast 2026 - 2035 |
||||||
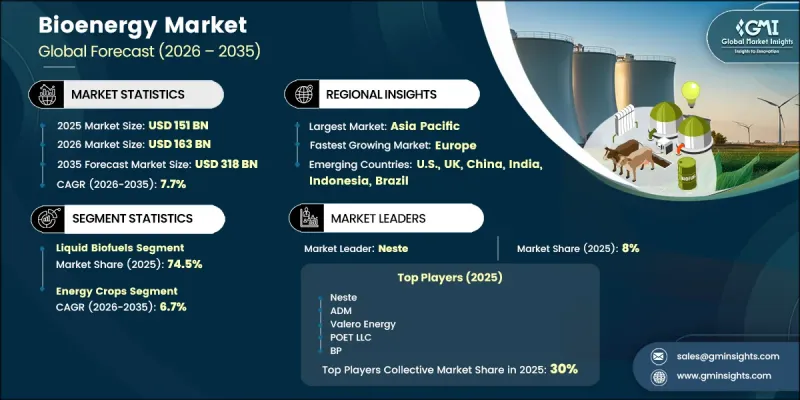
세계의 바이오에너지 시장은 2025년에 1,510억 달러 규모가 되어, CAGR 7.7%로 성장하여 2035년까지 3,180억 달러에 이를 것으로 추정되고 있습니다.

시장의 성장은 기존의 바이오연료 생산 방식에서 첨단 폐기물 기반 바이오에너지 기술로의 지속적인 전환에 의해 주도되고 있으며, 이러한 변화는 업계 전반의 투자 우선순위, 원료 조달 전략 및 경쟁 구도에 영향을 미치고 있습니다. 지역별 시장 동향에는 큰 편차가 나타나고 있으며, 아시아태평양이 최대 매출 점유율을 유지하고 있는 반면, 유럽은 정책 체계, 지속가능성 노력, 자원 확보 가능성의 차이로 인해 계속해서 가장 강력한 성장세를 보이고 있습니다. 정부와 기업이 설정한 장기적인 탈탄소화 목표는 여전히 업계 확장의 주요 원동력으로 작용하고 있습니다. 바이오에너지는 조절 가능한 전력, 산업용 열, 운송용 연료를 공급할 수 있기 때문에 재생에너지 분야에서 독보적인 위치를 차지하고 있습니다. 또한, 여러 지역에 걸쳐 바이오매스 자원을 널리 활용할 수 있다는 점도 장기적인 시장 발전을 뒷받침하고 있습니다. 그러나 원료 공급은 여전히 계절적 변동, 지리적 제약, 그리고 생산의 경제성에 영향을 미칠 수 있는 경쟁적인 최종 용도 수요의 영향을 받기 쉬운 상황에 놓여 있습니다. 지속 가능한 자원 이용 및 토지 관리 실천에 대한 관심이 높아지고 있는 것은 전 세계 바이오에너지 시장 전반의 원료 조달 전략에 계속해서 영향을 미치고 있습니다.
| 시장 범위 | |
|---|---|
| 시작 연도 | 2025년 |
| 예측 기간 | 2026-2035년 |
| 시작 연도 시장 규모 | 1,510억 달러 |
| 예측 금액 | 3,180억 달러 |
| CAGR | 7.7% |
액체 바이오연료 부문은 74.5%의 시장 점유율을 차지하고 있으며, 2035년까지 연평균 성장률(CAGR) 8%로 성장할 것으로 전망됩니다. 이 범주에는 기존의 에너지 용도와 신흥 에너지 용도 모두에 활용되는 다양한 재생 가능 연료 기술이 포함되어 있습니다. 이 부문은 첨단 연료 생산 기술에 대한 투자 확대, 변환 효율 향상, 그리고 저탄소형 운송용 에너지 솔루션에 대한 수요 증가로 인해 계속해서 혜택을 보고 있습니다. 액체 바이오연료 부문 중에서도 지속가능성 측면에서 높은 평가를 받는 재생 가능 연료의 대체품은 예측 기간 동안 가장 강력한 성장 기회를 창출할 것으로 전망됩니다.
에너지 작물 부문은 2025년에 51.1%의 점유율을 차지하고, 2035년까지 연평균 성장률(CAGR) 6.7%로 성장할 것으로 전망됩니다. 이 부문의 선도적 지위는 대규모 바이오에너지 생산을 뒷받침하는 전용 원료 재배 및 가공 인프라의 광범위한 구축을 반영하고 있습니다. 농업 생산성 향상, 원료 최적화, 그리고 첨단 바이오매스 전환 기술에 대한 지속적인 투자를 통해, 이 부문이 시장 성장에 기여하는 비중은 더욱 높아질 것으로 예측됩니다. 또한, 원료 수확량 증대와 자원 효율 개선을 위한 노력을 강화함으로써, 에너지 작물을 기반으로 한 바이오에너지 생산의 장기적인 지속가능성을 뒷받침하고 있습니다.
북미의 바이오에너지 시장은 2025년에 22%의 점유율을 차지하고, 2035년까지 연평균 성장률(CAGR) 7%로 성장할 것으로 전망됩니다. 이 지역은 세계 바이오연료 생산에서 여전히 중요한 역할을 수행하고 있으며, 첨단 재생 가능 연료 기술 전반에 걸쳐 계속해서 막대한 투자를 유치하고 있습니다. 북미 전역 시장에 진출한 기업들은 탄소 강도 저감, 지속가능성 제고, 그리고 운영 효율 개선을 통해 타사와의 차별화를 꾀하고 있습니다. 지원적인 규제 체계, 지속적인 인프라 투자, 그리고 재생에너지 솔루션에 대한 수요 증가로 인해 향후 몇 년간 해당 지역 시장 성장이 지속될 것으로 예측됩니다.
자주 묻는 질문
목차
제1장 조사 방법과 범위
제2장 주요 요약
제3장 업계 인사이트
제4장 경쟁 구도
제5장 시장 규모 및 예측 : 유형별, 2022-2035년
제6장 시장 규모 및 예측 : 원료별, 2022-2035년
제7장 시장 규모 및 예측 : 기술별, 2022-2035년
제8장 시장 규모 및 예측 : 용도별, 2022-2035년
제9장 시장 규모 및 예측 : 최종 용도별, 2022-2035년
제10장 시장 규모 및 예측 : 지역별, 2022-2035년
제11장 기업 개요
JHS 26.07.01The Global Bioenergy Market was valued at USD 151 billion in 2025 and is estimated to grow at a CAGR of 7.7% to reach USD 318 billion by 2035.
Market growth is driven by the ongoing shift from conventional biofuel production methods toward advanced and waste-based bioenergy technologies, a transformation that is influencing investment priorities, feedstock sourcing strategies, and competitive dynamics throughout the industry. Regional market performance varies considerably, with Asia Pacific maintaining the largest revenue share while Europe continues to demonstrate the strongest growth trajectory due to differing policy frameworks, sustainability initiatives, and resource availability. Long-term decarbonization objectives established by governments and corporations remain a major catalyst for industry expansion. Bioenergy occupies a unique position within the renewable energy landscape because it can deliver dispatchable electricity, industrial heat, and transportation fuels. In addition, the broad availability of biomass resources across multiple regions supports long-term market development. However, feedstock supply remains subject to seasonal fluctuations, geographic limitations, and competing end-use demands that can affect production economics. The increasing focus on sustainable resource utilization and land management practices continues to influence feedstock procurement strategies across the global bioenergy market.
| Market Scope | |
|---|---|
| Start Year | 2025 |
| Forecast Year | 2026-2035 |
| Start Value | $151 Billion |
| Forecast Value | $318 Billion |
| CAGR | 7.7% |
The liquid biofuels segment accounted for 74.5% share and is projected to grow at a CAGR of 8% through 2035. This category includes a diverse range of renewable fuel technologies that serve both established and emerging energy applications. The segment continues to benefit from increasing investments in advanced fuel production technologies, improved conversion efficiencies, and rising demand for lower-carbon transportation energy solutions. Among liquid biofuel categories, renewable fuel alternatives with enhanced sustainability profiles are expected to generate the strongest revenue growth opportunities during the forecast period.
The energy crops segment accounted for 51.1% share in 2025 and is anticipated to grow at a CAGR of 6.7% through 2035. The segment's leading position reflects the extensive development of dedicated feedstock cultivation and processing infrastructure that supports large-scale bioenergy production. Continued investments in agricultural productivity, feedstock optimization, and advanced biomass conversion technologies are expected to strengthen the segment's contribution to market growth. In addition, increasing efforts to improve feedstock yields and resource efficiency are supporting the long-term viability of energy crop-based bioenergy production.
North America Bioenergy Market held 22% share in 2025 and is projected to grow at a CAGR of 7% through 2035. The region remains a key contributor to global biofuel production and continues to attract significant investment across advanced renewable fuel technologies. Market participants throughout North America are increasingly differentiating themselves through lower carbon intensity profiles, enhanced sustainability performance, and operational efficiency improvements. Supportive regulatory frameworks, ongoing infrastructure investments, and growing demand for renewable energy solutions are expected to sustain regional market expansion over the coming years.
Major companies operating in the global bioenergy market include Neste, ADM, POET LLC, Drax Group, and Raizen. Companies active in the bioenergy market are implementing a range of strategic initiatives to strengthen their market position and expand their global footprint. Key strategies include increasing investments in advanced biofuel technologies, expanding production capacity, and enhancing feedstock diversification to improve supply security. Industry participants are also pursuing strategic partnerships, joint ventures, and long-term supply agreements to strengthen value chain integration and secure access to critical resources. Investments in research and development remain a priority as companies seek to improve conversion efficiency, reduce production costs, and develop next-generation renewable fuel solutions. Many organizations are further focusing on sustainability certifications, carbon reduction initiatives, and digital technologies to enhance operational performance.
Table of Contents
Chapter 1 Methodology & Scope
- 1.1 Research approach
- 1.2 Quality commitments
- 1.2.1 GMI AI policy & data integrity commitment
- 1.2.1.1 Source consistency protocol
- 1.2.1 GMI AI policy & data integrity commitment
- 1.3 Research trail & confidence scoring
- 1.3.1 Research trail components
- 1.3.2 Scoring components
- 1.4 Data collection
- 1.4.1 Partial list of primary sources
- 1.5 Data mining sources
- 1.5.1 Paid sources
- 1.5.1.1 Sources, by region
- 1.5.1 Paid sources
- 1.6 Base estimates and calculations
- 1.6.1 Base year calculation for any one approach
- 1.7 Market estimates & forecasts parameters
- 1.8 Forecast model
- 1.8.1 Quantified market impact analysis
- 1.8.1.1 Mathematical impact of growth parameters on forecast
- 1.8.1 Quantified market impact analysis
- 1.9 Research transparency addendum
- 1.9.1 Source attribution framework
- 1.9.2 Quality assurance metrics
- 1.9.3 Our commitment to trust
- 1.10 Market definitions
Chapter 2 Executive Summary
- 2.1 Industry synopsis, 2022 - 2035
- 2.1.1 Business trends
- 2.1.2 Type trends
- 2.1.3 Feedstock trends
- 2.1.4 Technology trends
- 2.1.5 Application trends
- 2.1.6 End use trends
- 2.1.7 Regional trends
Chapter 3 Industry Insights
- 3.1 Industry ecosystem analysis
- 3.1.1 Raw material availability & sourcing analysis
- 3.1.2 Production capacity assessment
- 3.1.3 Supply chain resilience & risk factors
- 3.1.4 Distribution network analysis
- 3.2 Regulatory landscape
- 3.3 Industry impact forces
- 3.3.1 Growth drivers
- 3.3.1.1 Decarbonization goals and net-zero targets
- 3.3.1.2 Abundant availability of biomass feedstock
- 3.3.1.3 Supportive policies, subsidies, and blending mandates
- 3.3.2 Industry pitfalls & challenges
- 3.3.2.1 High capital intensity and technology commercialization risk
- 3.3.1 Growth drivers
- 3.4 Growth potential analysis
- 3.5 Porter's analysis
- 3.5.1 Bargaining power of suppliers
- 3.5.2 Bargaining power of buyers
- 3.5.3 Threat of new entrants
- 3.5.4 Threat of substitutes
- 3.6 PESTEL analysis
- 3.6.1 Political factors
- 3.6.2 Economic factors
- 3.6.3 Social factors
- 3.6.4 Technological factors
- 3.6.5 Legal factors
- 3.6.6 Environmental factors
- 3.7 Price trend analysis (USD/EJ) (Driven by primary research)
- 3.7.1 By type
- 3.7.2 By region
- 3.8 Impact of AI & generative AI on the market
- 3.8.1 AI-Driven production optimization
- 3.8.2 Predictive maintenance & fault detection
- 3.9 Emerging opportunities & trends
- 3.10 Investment analysis & future prospects
- 3.11 Sustainability initiatives & industry 4.0 integration
Chapter 4 Competitive Landscape, 2026
- 4.1 Introduction
- 4.2 Company market share analysis, by region, 2025
- 4.2.1 North America
- 4.2.2 Europe
- 4.2.3 Asia Pacific
- 4.2.4 Middle East & Africa
- 4.2.5 Latin America
- 4.3 Key developments
- 4.3.1 Key partnerships & collaborations
- 4.3.2 Major M&A activities
- 4.3.3 Product innovations & launches
- 4.3.4 Market expansion strategies
- 4.4 Competitive positioning matrix
Chapter 5 Market Size and Forecast, By Type, 2022 - 2035 (EJ & USD Million)
- 5.1 Key trends
- 5.2 Liquid biofuels
- 5.3 Solid biomass
- 5.4 Biogas/biomethane
- 5.5 Others
Chapter 6 Market Size and Forecast, By Feedstock, 2022 - 2035 (EJ & USD Million)
- 6.1 Key trends
- 6.2 Energy crops
- 6.3 Forest residues
- 6.4 Agricultural residues
- 6.5 Organic waste
- 6.6 Others
Chapter 7 Market Size and Forecast, By Technology, 2022 - 2035 (EJ & USD Million)
- 7.1 Key trends
- 7.2 Thermochemical
- 7.3 Biochemical
- 7.4 Chemical processes
- 7.5 Others
Chapter 8 Market Size and Forecast, By Application, 2022 - 2035 (EJ & USD Million)
- 8.1 Key trends
- 8.2 Power generation
- 8.3 Heat generation
- 8.4 Transportation fuels
- 8.5 Combined heat & power
- 8.6 Others
Chapter 9 Market Size and Forecast, By End use, 2022 - 2035 (EJ & USD Million)
- 9.1 Key trends
- 9.2 Power utilities
- 9.3 Industrial
- 9.4 Residential
- 9.5 Commercial
- 9.6 Transportation
- 9.7 Others
Chapter 10 Market Size and Forecast, By Region, 2022 - 2035 (EJ & USD Million)
- 10.1 Key trends
- 10.2 North America
- 10.2.1 U.S.
- 10.2.2 Canada
- 10.2.3 Mexico
- 10.3 Europe
- 10.3.1 Germany
- 10.3.2 UK
- 10.3.3 France
- 10.3.4 Netherlands
- 10.3.5 Italy
- 10.4 Asia Pacific
- 10.4.1 China
- 10.4.2 India
- 10.4.3 Japan
- 10.4.4 Indonesia
- 10.4.5 Australia
- 10.5 Middle East & Africa
- 10.5.1 Saudi Arabia
- 10.5.2 UAE
- 10.5.3 South Africa
- 10.6 Latin America
- 10.6.1 Brazil
- 10.6.2 Argentina
Chapter 11 Company Profiles
- 11.1 ADM
- 11.2 Alto Ingredients
- 11.3 BP Bioenergy
- 11.4 Cargill
- 11.5 Chevron REG
- 11.6 CropEnergies
- 11.7 Drax Group
- 11.8 Enviva Inc.
- 11.9 Fortum
- 11.10 Green Plains
- 11.11 Neste
- 11.12 Orsted Group
- 11.13 Petrobras Biocombustivel
- 11.14 POET LLC
- 11.15 Raizen
- 11.16 RWE
- 11.17 TotalEnergies
- 11.18 Valero Energy
- 11.19 Verbio AG
- 11.20 Wilmar International
