
|
시장보고서
상품코드
2071238
LNG 액화 트레인 시장 : 비즈니스 기회, 성장요인, 업계 동향 분석 및 예측(2026-2035년)LNG Liquefaction Train Market Opportunity, Growth Drivers, Industry Trend Analysis, and Forecast 2026 - 2035 |
||||||
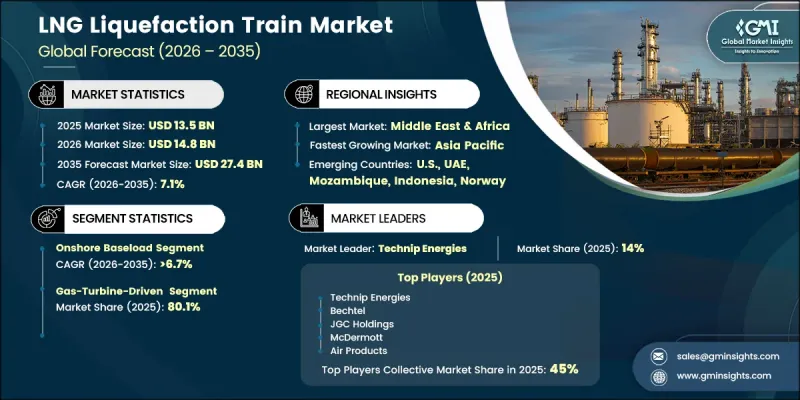
세계 LNG 액화 트레인 시장은 2025년에 135억 달러 규모가 되어, 2035년까지 연평균 복합 성장률(CAGR) 7.1%로 성장하여 274억 달러에 이를 것으로 추정되고 있습니다.

이러한 성장 추세는 주요 지역의 LNG 수출 인프라에 대한 투자 증가와 더불어, 에너지 조달 전략의 다각화를 위한 광범위한 정책 전환에 힘입어 지속되고 있습니다. 액화천연가스(LNG)에 대한 수요 증가는 특히 석탄 기반 에너지 시스템에서 벗어나 기존 파이프라인 가스망에 대한 의존도를 낮추고 있는 지역에서 LNG가 ‘과도기적 연료’로서의 역할을 수행하고 있다는 점이 원동력이 되고 있습니다. 또한, 재기화 능력의 지속적인 확대와 장기 공급 계약 체결을 통해 업스트림 프로젝트의 실현 가능성이 높아지고 있습니다. 기술의 발전도 중요한 역할을 하고 있으며, 액화 공정의 발전으로 인해 운영 효율과 환경 성능이 향상되고 있습니다. 모듈식 시스템의 도입, 전동화된 플랜트 설계, 그리고 디지털 최적화 도구의 통합을 통해 자본 집약도를 높이는 동시에 플랜트의 신뢰성과 수명 주기 경제성을 향상시키고 있으며, 시장은 지속적인 장기 성장 궤도에 올라 있습니다.
| 시장 범위 | |
|---|---|
| 시작 연도 | 2025년 |
| 예측 기간 | 2026-2035년 |
| 시작 연도 시장 규모 | 135억 달러 |
| 예측 금액 | 274억 달러 |
| CAGR | 7.1% |
LNG 액화 트레인 업계는 효율성을 높이고 배출량을 줄이는 첨단 시스템 구성에 대한 수요가 증가함에 따라 진화를 거듭하고 있습니다. 더 많은 국가들이 액화천연가스(LNG)의 수입 및 처리를 위한 인프라에 투자하는 가운데, 국제 무역량의 꾸준한 증가가 전 세계 LNG 수요 증가를 뒷받침하고 있습니다. 에너지의 안정적인 공급과 공급 중단에 대한 우려가 커짐에 따라, 각국의 에너지 전략에서 LNG의 중요성이 더욱 부각되고 있습니다. 동시에, 핵심인 액화 기술 분야의 혁신을 통해 플랜트의 생산성이 향상되고, 유지보수 주기가 연장되며, 예기치 못한 가동 중단이 최소화되고 있습니다.
육상 베이스로드 시스템 부문은 2025년에 55.9%의 시장 점유율을 차지하고, 2035년까지 연평균 성장률(CAGR) 6.7%로 성장할 것으로 전망됩니다. 해당 부서가 계속해서 주도적인 위치를 유지하고 있는 것은 높은 생산 능력과 운영 효율을 동시에 달성할 수 있다는 점에 기인합니다. 이러한 대규모 구성은 분산형이나 소규모 모듈식 시스템에 비해 확장성이 뛰어나고 복잡성이 상대적으로 낮기 때문에 널리 채택되고 있으며, 대량 액화 요건에 적합합니다.
가스 터빈 기반 시스템 부문은 2025년에 80.1%의 점유율을 차지하며, 전 세계적으로 확고한 입지와 운영상의 신뢰성을 바탕으로 주도적인 위치를 유지하고 있습니다. 이러한 시스템은 특히 안정적인 전력 인프라에 대한 접근이 제한된 환경, 대체 전력 솔루션이 경제적으로 실현 불가능한 환경에서 개발 사업자들에게 여전히 선호되는 선택지로 남아 있습니다. 이러한 적응성과 입증된 성능 덕분에 주요 액화 프로젝트 전반에 걸쳐 광범위한 도입이 지속적으로 뒷받침되고 있습니다.
북미의 LNG 액화 트레인 시장은 2025년에 34.1%의 점유율을 차지하고, 2035년까지 연평균 성장률(CAGR) 6.1%로 성장할 것으로 전망됩니다. 이 지역의 경쟁력은 잘 구축된 수출 생태계와 현재 진행 중인 생산 능력 확대 노력에 힘입어 뒷받침되고 있습니다. 프로젝트 활동 증가에 더해, 유리한 규제 환경과 투자 환경이 어우러져 LNG 생산 및 수출 인프라 개발 분야의 주요 허브로서의 입지를 더욱 공고히 하고 있습니다.
목차
제1장 조사 방법과 범위
제2장 주요 요약
제3장 업계 인사이트
제4장 경쟁 구도
제5장 시장 규모 및 예측 : 플랜트 유형별, 2022-2035년
제6장 시장 규모 및 예측 : 구동 전력 아키텍처별, 2022-2035년
제7장 시장 규모 및 예측 : 용량별, 2022-2035년
제8장 시장 규모 및 예측 : 개발업자별, 2022-2035년
제9장 시장 규모 및 예측 : 지역별, 2022-2035년
제10장 기업 개요
JHSThe Global LNG Liquefaction Train Market was valued at USD 13.5 billion in 2025 and is estimated to grow at a CAGR of 7.1% to reach USD 27.4 billion by 2035.
The upward movement is supported by rising investments in LNG export infrastructure across key regions, alongside a broader policy shift toward diversified energy sourcing strategies. Expanding demand for liquefied natural gas is being driven by its role as a transitional fuel, particularly in regions moving away from coal-based energy systems and reducing reliance on conventional pipeline gas networks. Additionally, continuous expansion in regasification capacity and long-term supply agreements are strengthening upstream project viability. Technological progress is also playing a central role, with advancements in liquefaction processes enhancing operational efficiency and environmental performance. The integration of modular systems, electrified train designs, and digital optimization tools is enabling higher capital intensity while improving plant reliability and lifecycle economics, positioning the market for sustained long-term growth.
| Market Scope | |
|---|---|
| Start Year | 2025 |
| Forecast Year | 2026-2035 |
| Start Value | $13.5 Billion |
| Forecast Value | $27.4 Billion |
| CAGR | 7.1% |
The LNG liquefaction train industry is evolving with increasing preference for advanced system configurations that enhance efficiency and reduce emissions. Strengthened global demand for LNG is being supported by consistent growth in international trade volumes, as more countries invest in infrastructure to import and process liquefied gas. Rising concerns over energy reliability and supply disruption have further reinforced the importance of LNG within national energy strategies. At the same time, innovation across core liquefaction technologies is improving plant output, extending maintenance cycles, and minimizing unexpected operational interruptions.
The onshore baseload systems segment accounted for 55.9% share in 2025 and is projected to grow at a CAGR of 6.7% through 2035. Their continued dominance is attributed to their ability to deliver high production capacity with operational efficiency. These large-scale configurations are widely adopted due to their scalability and relatively lower complexity when compared to distributed or smaller modular systems, making them suitable for high-volume liquefaction requirements.
The gas turbine-based systems segment held 80.1% share in 2025, maintaining their leadership due to their established global presence and operational reliability. These systems remain a preferred choice for developers, particularly in environments where access to stable electricity infrastructure is limited or where alternative power solutions are not economically feasible. Their adaptability and proven performance continue to support widespread deployment across major liquefaction projects.
North America LNG Liquefaction Train Market represented 34.1% share in 2025 and is anticipated to grow at a CAGR of 6.1% through 2035. The region's prominence is supported by a well-developed export ecosystem and ongoing capacity expansion initiatives. Increasing project activity, coupled with favorable regulatory and investment environments, continues to reinforce its position as a leading hub for LNG production and export infrastructure development.
Key companies operating in the LNG Liquefaction Train Market include Technip Energies, Bechtel, Saipem, JGC Corporation, McDermott International, Samsung Heavy Industries, Linde, Air Products, Siemens Energy, Baker Hughes, GE Vernova, Wartsila, and Honeywell. Market participants are strengthening their competitive positioning through strategic investments in technology development, project execution capabilities, and global expansion. Companies are focusing on enhancing process efficiency and reducing emissions through continuous innovation in liquefaction systems. Partnerships and long-term agreements across the value chain are helping secure project pipelines and stabilize revenue streams. Firms are also prioritizing modular construction approaches and digital integration to improve project timelines and operational performance. Expanding regional presence and aligning with evolving regulatory frameworks are additional strategies being adopted to capture emerging opportunities and reinforce market leadership in the LNG liquefaction train industry.
Table of Contents
Chapter 1 Methodology & Scope
- 1.1 Research approach
- 1.2 Quality commitments
- 1.2.1 GMI AI policy & data integrity commitment
- 1.2.1.1 Source consistency protocol
- 1.2.1 GMI AI policy & data integrity commitment
- 1.3 Research trail & confidence scoring
- 1.3.1 Research trail components
- 1.3.2 Scoring components
- 1.4 Data collection
- 1.4.1 Partial list of primary sources
- 1.5 Data mining sources
- 1.5.1 Paid sources
- 1.5.1.1 Sources, by region
- 1.5.1 Paid sources
- 1.6 Base estimates and calculations
- 1.6.1 Base year calculation for any one approach
- 1.7 Market estimates & forecasts parameters
- 1.8 Forecast model
- 1.8.1 Quantified market impact analysis
- 1.8.1.1 Mathematical impact of growth parameters on forecast
- 1.8.1 Quantified market impact analysis
- 1.9 Research transparency addendum
- 1.9.1 Source attribution framework
- 1.9.2 Quality assurance metrics
- 1.9.3 Our commitment to trust
- 1.10 Market definitions
Chapter 2 Executive Summary
- 2.1 Industry synopsis, 2022 - 2035
- 2.1.1 Business trends
- 2.1.2 Plant type trends
- 2.1.3 Drive & power architecture trends
- 2.1.4 Capacity trends
- 2.1.5 Developer trends
- 2.1.6 Regional trends
Chapter 3 Industry Insights
- 3.1 Industry ecosystem analysis
- 3.1.1 Raw material availability & sourcing analysis
- 3.1.2 Manufacturing capacity assessment
- 3.1.3 Supply chain resilience & risk factors
- 3.1.4 Distribution network analysis
- 3.2 Regulatory landscape
- 3.3 Industry impact forces
- 3.3.1 Growth drivers
- 3.3.2 Industry pitfalls & challenges
- 3.4 Growth potential analysis
- 3.5 Porter's analysis
- 3.5.1 Bargaining power of suppliers
- 3.5.2 Bargaining power of buyers
- 3.5.3 Threat of new entrants
- 3.5.4 Threat of substitutes
- 3.6 PESTEL analysis
- 3.6.1 Political factors
- 3.6.2 Economic factors
- 3.6.3 Social factors
- 3.6.4 Technological factors
- 3.6.5 Legal factors
- 3.6.6 Environmental factors
- 3.7 Impact of AI & Generative AI on the market
- 3.7.1 AI-Driven disruption of existing business models
- 3.7.2 GenAI use cases & adoption roadmap
- 3.7.3 Risks, limitations & regulatory considerations
- 3.8 Investment analysis & future prospects
- 3.9 Sustainability initiatives & industry 4.0 integration
- 3.10 Future outlook & opportunities
- 3.10.1 Emerging market opportunities
- 3.10.1.1 Stranded gas monetization via flng
- 3.10.1.2 Coal-to-gas switching in asia
- 3.10.1.3 Small-scale lng for remote applications
- 3.10.2 Technology evolution & roadmap
- 3.10.2.1 All-electric liquefaction trains
- 3.10.2.2 Carbon capture integration
- 3.10.2.3 Hydrogen co-production facilities
- 3.10.3 Investment hotspots
- 3.10.4 Disruptive trends & wild cards
- 3.10.1 Emerging market opportunities
Chapter 4 Competitive Landscape, 2026
- 4.1 Introduction
- 4.2 Company market share analysis, by region, 2025
- 4.2.1 North America
- 4.2.2 Europe
- 4.2.3 Asia Pacific
- 4.2.4 Middle East & Africa
- 4.2.5 Latin America
- 4.3 Key developments
- 4.3.1 Key partnerships & collaborations
- 4.3.2 Major M&A activities
- 4.3.3 Product innovations & launches
- 4.3.4 Market expansion strategies
- 4.4 Competitive positioning matrix
- 4.4.1 Tier classification criteria & qualifying thresholds
- 4.4.2 Tier positioning matrix by revenue, geography & innovation
Chapter 5 Market Size and Forecast, By Plant type, 2022 - 2035 (USD Million)
- 5.1 Key trends
- 5.2 Onshore baseload
- 5.3 Modular & mid-scale onshore
- 5.4 FLNG
Chapter 6 Market Size and Forecast, By Drive & Power Architecture, 2022 - 2035 (USD Million)
- 6.1 Key trends
- 6.2 Gas turbine driven
- 6.3 Electric motor driven
- 6.4 Hybrid & dual driven
Chapter 7 Market Size and Forecast, By Capacity, 2022 - 2035 (USD Million)
- 7.1 Key trends
- 7.2 Small scale
- 7.3 Mid scale
- 7.4 Large scale
Chapter 8 Market Size and Forecast, By Developer, 2022 - 2035 (USD Million)
- 8.1 Key trends
- 8.2 NOC
- 8.3 IOC
- 8.4 Independent developer
Chapter 9 Market Size and Forecast, By Region, 2022 - 2035 (USD Million)
- 9.1 Key trends
- 9.2 North America
- 9.2.1 U.S.
- 9.2.2 Canada
- 9.2.3 Mexico
- 9.3 Europe
- 9.3.1 Norway
- 9.3.2 UK
- 9.3.3 Netherlands
- 9.3.4 Russia
- 9.4 Asia Pacific
- 9.4.1 China
- 9.4.2 Australia
- 9.4.3 Malaysia
- 9.4.4 Papua New Guinea
- 9.5 Middle East & Africa
- 9.5.1 Qatar
- 9.5.2 UAE
- 9.5.3 Oman
- 9.5.4 Nigeria
- 9.5.5 Mozambique
- 9.6 Latin America
- 9.6.1 Brazil
- 9.6.2 Argentina
Chapter 10 Company Profiles
- 10.1 Air Products
- 10.2 Baker Hughes
- 10.3 Bechtel
- 10.4 Black & Veatch
- 10.5 Chiyoda Corporation
- 10.6 CTCI Corporation
- 10.7 ConocoPhillips
- 10.8 Fluor
- 10.9 GE Vernova
- 10.10 Honeywell
- 10.11 JGC Corporation
- 10.12 Linde
- 10.13 Technip Energies
- 10.14 McDermott
- 10.15 MODEC
- 10.16 Saipem
- 10.17 Siemens Energy
- 10.18 Samsung Heavy Industries (SHI)
- 10.19 Wartsila
- 10.20 Worley


