
|
시장보고서
상품코드
2071258
타이어 검사 시장 : 기회, 성장요인, 업계 동향 분석 및 예측(2026-2035년)Tire Inspection Market Opportunity, Growth Drivers, Industry Trend Analysis, and Forecast 2026 - 2035 |
||||||
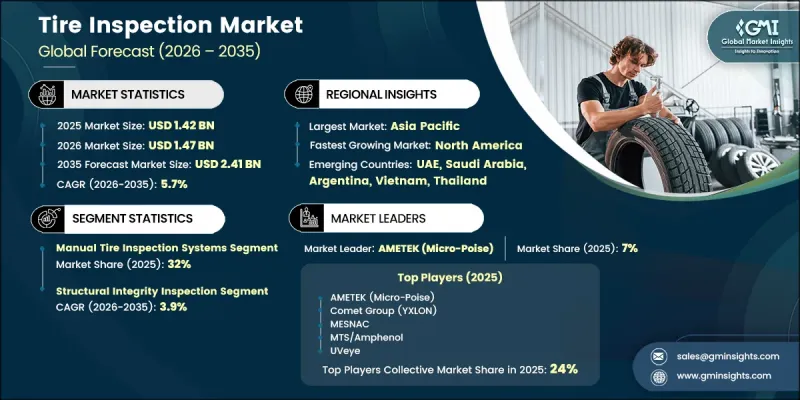
세계의 타이어 검사 시장은 2025년에 14억 2,000만 달러 규모가 되어, CAGR 5.7%로 성장하여 2035년까지 24억 1,000만 달러에 이를 것으로 추정되고 있습니다.

이러한 성장 추세는 선진국 및 신흥 지역의 안전 기준 요건 변화, 정교한 검사 기능을 필요로 하는 전기차의 보급 확대, 그리고 타이어 생산 현장에 대한 인더스트리 4.0 기술의 지속적인 도입이 복합적으로 작용하여 촉진되고 있습니다. 자동화 시스템에서 모바일 지원 도구에 이르기까지, 검사 솔루션의 활용 가능성이 높아짐에 따라 그 용도는 산업 분야에 그치지 않고 보다 광범위한 상업 및 서비스 분야로 확대되고 있습니다. 미국 국가도로교통안전국(NHTSA) 등 당국이 시행하고 있는 규제 체계는 생산 단계 및 수명 주기의 모든 단계에서 엄격한 타이어 성능 기준을 의무화하고 있습니다. 특히 아시아태평양의 타이어 생산량 증가는 검사 기술에 대한 수요를 지속적으로 촉진하고 있습니다. 또한, 전기차는 독자적인 성능 요건을 제시하고 있으며, 이에 따른 중량 증가로 인해 내구성 향상과 더욱 엄격한 품질 검증 프로세스가 요구되고 있습니다.
| 시장 범위 | |
|---|---|
| 시작 연도 | 2025년 |
| 예측 기간 | 2026-2035년 |
| 시작 연도 시장 규모 | 14억 2,000만 달러 |
| 예측 금액 | 24억 1,000만 달러 |
| CAGR | 5.7% |
수동 타이어 검사 솔루션 분야는 2025년에 32%의 시장 점유율을 차지하고, 2035년까지 연평균 성장률(CAGR) 4.1%로 성장할 것으로 전망됩니다. 이러한 성장은 다양한 운영 환경에서 비용 대비 효과가 높고 휴대성이 뛰어난 검사 도구의 중요성이 계속해서 높아지고 있음을 반영하고 있습니다. 이러한 시스템에는 트레드 마모 측정, 구조적 불일치 감지, 공기압 모니터링 및 재료 특성 평가를 목적으로 하는 장치가 포함됩니다. 가격이 수십 달러에서 수천 달러로 저렴하기 때문에 자동화에 대한 막대한 설비 투자가 어려운 서비스 제공업체, 독립 정비업체, 차량 관리 담당자 및 재가공 시설에서 널리 채택되고 있습니다.
구조 건전성 검사 부문은 28%의 시장 점유율을 차지하고 있으며, 2035년까지 연평균 성장률(CAGR) 3.9%로 성장할 것으로 전망됩니다. 이 부문은 소재와 구조가 성능 요건을 충족하는지 확인하기 위해 타이어의 내부 구성 및 내구성 평가에 중점을 두고 있습니다. 생산 공정에서 정밀도와 신뢰성을 최우선으로 여기는 대규모 제조업체들 사이에서 도입이 가장 활발히 이루어지고 있습니다.
북미 타이어 검사 시장은 2025년에 35%의 점유율을 차지하고, 2035년까지 연평균 성장률(CAGR) 5%로 성장할 것으로 전망됩니다. 이 지역은 타이어의 전체 수명 주기에 걸쳐 종합적인 안전 및 품질 기준을 시행하는 확립된 규제 환경의 혜택을 누리고 있습니다. 미국은 엄격한 규정 준수 체제와 기술 발전 및 표준화를 촉진하는 업계의 협력적인 노력을 바탕으로, 계속해서 지역 수요를 주도하고 있습니다.
자주 묻는 질문
목차
제1장 조사 방법과 범위
제2장 주요 요약
제3장 업계 인사이트
제4장 경쟁 구도
제5장 시장 추산 및 예측 : 시스템별, 2022-2035년
제6장 시장 추산 및 예측 : 기술별, 2022-2035년
제7장 시장 추산 및 예측 : 검사별, 2022-2035년
제8장 시장 추산 및 예측 : 용도별, 2022-2035년
제9장 시장 추산 및 예측 : 최종 용도별, 2022-2035년
제10장 시장 추산 및 예측 : 지역별, 2022-2035년
제11장 기업 개요
JHS 26.07.01The Global Tire Inspection Market was valued at USD 1.42 billion in 2025 and is estimated to grow at a CAGR of 5.7% to reach USD 2.41 billion by 2035.
The upward movement is driven by a combination of evolving safety compliance requirements across developed and emerging regions, rising electric vehicle adoption that requires advanced inspection capabilities, and the ongoing implementation of Industry 4.0 technologies in tire production environments. The growing availability of inspection solutions, ranging from automated systems to mobile-enabled tools, is expanding usage beyond industrial settings into broader commercial and service applications. Regulatory frameworks enforced by authorities such as the National Highway Traffic Safety Administration mandate stringent tire performance standards across production and lifecycle stages. Increased tire manufacturing output, particularly in Asia Pacific, continues to stimulate demand for inspection technologies. Additionally, electric vehicles introduce unique performance requirements, as their higher weight profile necessitates enhanced durability and more stringent quality validation processes.
| Market Scope | |
|---|---|
| Start Year | 2025 |
| Forecast Year | 2026-2035 |
| Start Value | $1.42 Billion |
| Forecast Value | $2.41 Billion |
| CAGR | 5.7% |
The manual tire inspection solutions segment accounted for 32% share in 2025 and is expected to grow at a CAGR of 4.1% through 2035. This growth reflects the continued importance of cost-effective and portable inspection tools across diverse operational settings. These systems include devices designed for measuring tread wear, detecting structural inconsistencies, monitoring pressure, and assessing material properties. Their affordability, with costs ranging from tens to thousands of USD, supports widespread adoption among service providers, independent maintenance operators, fleet managers, and retreading facilities where high capital investment in automation is not feasible.
The structural integrity inspection segment accounted for 28% share, growing at a 3.9% CAGR through 2035. This segment focuses on evaluating the internal composition and durability of tires to ensure that materials and construction meet performance expectations. Adoption remains strongest among large-scale manufacturers that prioritize precision and reliability in production processes.
North America Tire Inspection Market held a 35% share in 2025 and is forecast to grow at a CAGR of 5% through 2035. The region benefits from a well-established regulatory environment that enforces comprehensive safety and quality standards throughout the tire lifecycle. The United States continues to lead regional demand, supported by strict compliance systems and coordinated industry efforts that encourage technological advancement and standardization.
Key companies operating in the global tire inspection market include AMETEK, MESNAC, MTS Systems Corporation (Amphenol), UVeye, Comet Group (YXLON), Micro-Epsilon, and Nikon Corporation. Companies in the tire inspection market are strengthening their positions through a combination of technological innovation, strategic partnerships, and geographic expansion. Many players are investing in advanced inspection systems that integrate artificial intelligence, machine learning, and automation to improve accuracy and operational efficiency. Collaborations with automotive manufacturers and mobility solution providers are enabling deeper market penetration and long-term contracts. Firms are also expanding their presence in high-growth regions, particularly in Asia Pacific, to align with increasing tire production capacity. In addition, product diversification remains a key approach, with companies offering scalable solutions that cater to both high-volume industrial users and smaller service providers.
Table of Contents
Chapter 1 Methodology & Scope
- 1.1 Research approach
- 1.2 Quality Commitments
- 1.2.1 GMI AI policy & data integrity commitment
- 1.2.1.1 Source consistency protocol
- 1.2.1 GMI AI policy & data integrity commitment
- 1.3 Research Trail & Confidence Scoring
- 1.3.1 Research Trail Components
- 1.3.2 Scoring Components
- 1.4 Data Collection
- 1.4.1 Partial list of primary sources
- 1.5 Data mining sources
- 1.5.1 Paid sources
- 1.5.1.1 Sources, by region
- 1.5.1 Paid sources
- 1.6 Base estimates and calculations
- 1.6.1 Base year calculation
- 1.7 Forecast model
- 1.7.1 Quantified market impact analysis
- 1.7.1.1 Mathematical impact of growth parameters on forecast
- 1.7.1 Quantified market impact analysis
- 1.8 Research transparency addendum
- 1.8.1 Source attribution framework
- 1.8.2 Quality assurance metrics
- 1.8.3 Our commitment to trust
Chapter 2 Executive Summary
- 2.1 Industry 360° synopsis
- 2.2 Key market trends
- 2.2.1 System
- 2.2.2 Technology
- 2.2.3 Inspection
- 2.2.4 Application
- 2.2.5 End Use
- 2.3 TAM Analysis, 2026-2035
- 2.4 CXO perspectives: Strategic imperatives
Chapter 3 Industry Insights
- 3.1 Industry ecosystem analysis
- 3.1.1 Supplier landscape
- 3.1.1.1 Raw material suppliers
- 3.1.1.2 Component suppliers
- 3.1.1.3 Manufacturers
- 3.1.1.4 Service providers
- 3.1.1.5 Distribution channel
- 3.1.1.6 End Use
- 3.1.2 Cost structure
- 3.1.3 Profit margin
- 3.1.4 Value addition at each stage
- 3.1.5 Vertical integration trends
- 3.1.6 Disruptors
- 3.1.1 Supplier landscape
- 3.2 Industry impact forces
- 3.2.1 Growth drivers
- 3.2.1.1 Stringent vehicle safety regulations
- 3.2.1.2 Rising tire production volumes globally
- 3.2.1.3 Growth of electric vehicle tire requirements
- 3.2.1.4 Industry 4.0 adoption in tire manufacturing
- 3.2.2 Industry pitfalls & challenges
- 3.2.2.1 High capital cost of X-ray systems
- 3.2.2.2 Technical complexity & integration challenges
- 3.2.3 Market opportunities
- 3.2.3.1 AI-powered automatic defect recognition
- 3.2.3.2 Integration of X-ray with vision systems
- 3.2.3.3 Mobile and drive-through inspection solutions
- 3.2.3.4 Real-time data analytics & cloud connectivity
- 3.2.1 Growth drivers
- 3.3 Growth potential analysis
- 3.4 Pricing Analysis (Driven by Primary Research)
- 3.4.1 Historical Price Trend Analysis
- 3.4.2 Pricing Strategy by Player Type (Premium / Value / Cost-plus)
- 3.5 Regulatory landscape
- 3.5.1 North America
- 3.5.1.1 U.S.: National Highway Traffic Safety Administration (NHTSA)
- 3.5.1.2 U.S.: Tire Safety Standards (FMVSS)
- 3.5.1.3 Canada: Motor Vehicle Tire Safety Regulations ( SOR /2013-198)
- 3.5.2 Europe
- 3.5.2.1 German Road Traffic Licensing Regulations
- 3.5.2.2 UK: Ministry of Transport (MOT) Test
- 3.5.2.3 EU Tire Labeling Regulation
- 3.5.2.4 REACH Compliance & Sustainable Material Standards
- 3.5.3 Asia-Pacific
- 3.5.3.1 Japan Low Rolling Resistance Tires Certification
- 3.5.3.2 Malaysia: JPJ Puspakom Mandatory Tread Depth
- 3.5.3.3 Australia: HVNL Defect Management
- 3.5.3.4 China Tire Quality Certification Standards
- 3.5.4 Latin America
- 3.5.4.1 Brazil INMETRO Tire Labeling Program
- 3.5.4.2 Mexico NOM Tire Safety Regulations
- 3.5.5 Middle East & Africa
- 3.5.5.1 GCC Tire Quality & Import Regulations
- 3.5.5.2 South Africa Tire Safety Compliance Standards
- 3.5.1 North America
- 3.6 Technology and Innovation landscape
- 3.6.1 Current technologies
- 3.6.2 Emerging technologies
- 3.7 Porter's analysis
- 3.8 PESTEL analysis
- 3.9 Patent analysis (Driven by Primary Research)
- 3.10 Impact of AI & generative AI on the market
- 3.10.1 AI-Driven Disruption of Existing Business Models
- 3.10.2 Automated design optimization
- 3.10.3 Supply chain AI for demand forecasting
- 3.10.4 GenAI use cases & adoption roadmap by segment
- 3.10.5 Risks, Limitations & Regulatory Considerations
- 3.11 Forecast assumptions & scenario analysis (Driven by Primary Research)
- 3.11.1 Base Case - key macro & industry variables driving CAGR
- 3.11.2 Optimistic Scenarios - Favorable Macro and Industry Tailwinds
- 3.11.3 Pessimistic Scenario - Macroeconomic slowdown or industry headwinds
- 3.12 Sustainability and environmental aspects
- 3.12.1 Sustainable practices
- 3.12.2 Waste reduction strategies
- 3.12.3 Energy efficiency in production
- 3.12.4 Eco-friendly Initiatives
- 3.12.5 Carbon footprint considerations
Chapter 4 Competitive Landscape, 2025
- 4.1 Introduction
- 4.2 Company market share analysis
- 4.2.1 North America
- 4.2.2 Europe
- 4.2.3 Asia-Pacific
- 4.2.4 Latin America
- 4.2.5 Middle East & Africa
- 4.3 Competitive positioning matrix
- 4.4 Key developments
- 4.4.1 Mergers & acquisitions
- 4.4.2 Partnerships & collaborations
- 4.4.3 New product launches
- 4.4.4 Expansion plans and funding
- 4.5 Company tier benchmarking
- 4.5.1 Tier classification criteria & qualifying thresholds
- 4.5.2 Tier positioning matrix by revenue, geography & innovation
Chapter 5 Market Estimates & Forecast, By System, 2022 - 2035 ($Mn)
- 5.1 Key trends
- 5.2 Manual Tire Inspection Systems
- 5.3 Automated Tire Inspection Systems
Chapter 6 Market Estimates & Forecast, By Technology, 2022 - 2035 ($Mn)
- 6.1 Key trends
- 6.2 Camera-Based Inspection
- 6.3 X-Ray Based Inspection
- 6.4 Ultrasonic Inspection
- 6.5 Laser Inspection
- 6.6 Others
Chapter 7 Market Estimates & Forecast, By Inspection, 2022 - 2035 ($Mn)
- 7.1 Key trends
- 7.2 Tread Depth Measurement
- 7.3 Structural Integrity Inspection
- 7.4 Pressure & Inflation Monitoring
- 7.5 Surface & Visual Defect Detection
- 7.6 Multi-Parameter Inspection
Chapter 8 Market Estimates & Forecast, By Application, 2022 - 2035 ($Mn)
- 8.1 Key trends
- 8.2 Tire Manufacturing Facilities
- 8.3 Automobile Assembly Facilities
- 8.4 MRO & Service Centres
- 8.5 Fleet Management Operations
- 8.6 Retail & Point-of-Sale Inspection
Chapter 9 Market Estimates & Forecast, By End Use, 2022 - 2035 ($Mn)
- 9.1 Key trends
- 9.2 Automotive
- 9.3 Aerospace
- 9.4 Industrial
- 9.5 Railway
Chapter 10 Market Estimates & Forecast, By Region, 2022 - 2035 ($Mn)
- 10.1 North America
- 10.1.1 US
- 10.1.2 Canada
- 10.2 Europe
- 10.2.1 UK
- 10.2.2 Germany
- 10.2.3 France
- 10.2.4 Italy
- 10.2.5 Spain
- 10.2.6 Belgium
- 10.2.7 Netherlands
- 10.2.8 Sweden
- 10.2.9 Russia
- 10.3 Asia Pacific
- 10.3.1 China
- 10.3.2 India
- 10.3.3 Japan
- 10.3.4 Australia
- 10.3.5 Singapore
- 10.3.6 South Korea
- 10.3.7 Vietnam
- 10.3.8 Indonesia
- 10.3.9 Thailand
- 10.4 Latin America
- 10.4.1 Brazil
- 10.4.2 Mexico
- 10.4.3 Argentina
- 10.5 MEA
- 10.5.1 South Africa
- 10.5.2 Saudi Arabia
- 10.5.3 UAE
- 10.5.4 Turkey
Chapter 11 Company Profiles
- 11.1 Global players
- 11.1.1 A&D Technology
- 11.1.2 AMETEK Micro-Poise
- 11.1.3 Comet (YXLON)
- 11.1.4 Erhardt+Leimer
- 11.1.5 MESNAC
- 11.1.6 Micro-Epsilon
- 11.1.7 Mitsubishi Heavy Industries
- 11.1.8 MTS Systems
- 11.1.9 Nikon
- 11.1.10 Technip Energies
- 11.2 Regional players
- 11.2.1 Blue Star Engineering & Electronics
- 11.2.2 CyXplus
- 11.2.3 Dandong Aolong Radiative Instrument
- 11.2.4 Mabri.Vision
- 11.2.5 Numetrix Technologies
- 11.2.6 Parth Systems India
- 11.2.7 TMSI
- 11.3 Emerging players
- 11.3.1 Anyline
- 11.3.2 Proovstation
- 11.3.3 Uveye
(주말 및 공휴일 제외)
