
|
시장보고서
상품코드
2071414
EV 커넥터 시장 기회, 성장 촉진요인, 업계 동향 분석 및 예측(2026-2035년)EV Connector Market Opportunity, Growth Drivers, Industry Trend Analysis, and Forecast 2026 - 2035 |
||||||
세계의 EV 커넥터 시장은 2025년에 42억 달러 규모에 이르고, CAGR 15.1%로 성장하여 2035년까지 171억 달러에 달할 것으로 추정되고 있습니다.
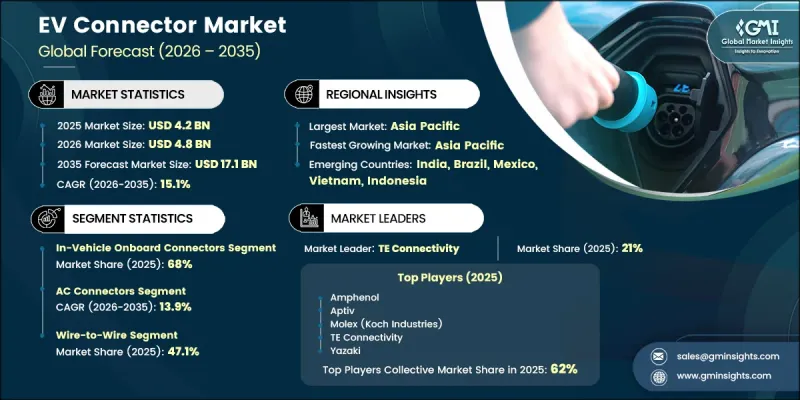
이 시장의 성장은 자동차 업계의 구조적 변화에 힘입어 이루어지고 있습니다. 전동화가 진전됨에 따라 충전 인프라 및 차량 탑재 시스템 분야에서 EV 커넥터의 적용 범위가 대폭 확대되고 있습니다. 이러한 성장은 단순히 수량 증가뿐만 아니라, 승용 배터리식 전기차, 상용 전기차, 전동 이륜차 등 각각에 특화된 커넥터 솔루션이 필요한 전기 모빌리티 플랫폼의 다양화에 의해서도 이루어지고 있습니다. 전기차 생산 대수가 증가함에 따라, 특히 고전압 아키텍처의 도입으로 인해 차량 1대당 커넥터 장착 수는 더욱 늘어나고 있습니다. 또한, 충전 인프라에 대한 정부의 투자로 인해 전 세계적으로 도입 속도가 빨라지고 있습니다. 800V 전기 시스템으로의 대대적인 기술적 전환도 업계의 양상을 일신하고 있으며, 더 빠른 충전과 구동 시스템의 효율 향상을 가능하게 하고 있습니다. 자동차 제조업체들은 충전 시간 단축과 고성능 전기차 지원을 목적으로 400V 플랫폼에서 800V 플랫폼으로의 전환을 가속화하고 있으며, 이에 따라 첨단 커넥터 기술에 대한 수요가 크게 증가하고 있습니다.
| 시장 범위 | |
|---|---|
| 개시 연도 | 2025년 |
| 예측 기간 | 2026-2035년 |
| 개시 금액 | 42억 달러 |
| 예측 금액 | 171억 달러 |
| CAGR | 15.1% |
자동차용 커넥터 부문은 2025년에 68%의 시장 점유율을 차지할 것으로 예상되며, 2026년부터 2035년까지 연평균 성장률(CAGR) 14.5%로 성장할 것으로 전망됩니다. 이 부문은 기존의 복잡한 배선 시스템을 보다 중앙 집중화된 컴퓨팅 모델로 대체하는 ‘ 존 기반 전기 아키텍처”로의 전환에 따라 그 양상이 새롭게 바뀌고 있습니다. 이러한 전환으로 인해 배선 구조가 단순화되고, 차량 중량이 감소하며, 데이터 전송 효율이 향상됨에 따라 첨단 차량용 커넥터 시스템에 대한 수요가 더욱 높아지고 있습니다.
와이어-투-와이어(Wire-to-Wire) 부문은 2025년에 47.1%의 시장 점유율을 차지할 것으로 예상되며, 2026년부터 2035년까지 연평균 성장률(CAGR) 14.3%를 기록하며 성장할 것으로 전망됩니다. 와이어-투-와이어 커넥터는 그 신뢰성과 전력 및 신호 전송을 위한 단순한 설계 덕분에 EV 플랫폼에서 여전히 널리 사용되고 있습니다. 소형 전자 아키텍처의 발전에 따라 그 우위는 점차 약화되고 있지만, 배전 시스템, 기존의 배선 구성, 그리고 높은 내구성이 요구되는 자동차 환경과 같은 용도에서는 여전히 없어서는 안 될 존재입니다.
미국의 전기차 커넥터 시장은 2025년에 7억 4,550만 달러에 달할 것으로 예상되며, 2035년까지 연평균 성장률(CAGR) 14.8%를 기록하며 성장할 것으로 전망됩니다. 시장 성장은 테슬라의 NACS 충전 표준으로의 전환에 힘입어 이루어지고 있으며, 이는 각 OEM 업체와 충전 인프라 사업자 전반의 커넥터 설계 전략에 영향을 미치고 있습니다. 이러한 전환으로 인해 듀얼 호환 및 고전압 DC 커넥터에 대한 수요가 증가하는 한편, 생태계의 단절 해소에도 기여하고 있습니다. 또한, 연방 정부의 NEVI(신에너지 차량 인프라) 자금도 고속도로변의 급속 충전 네트워크를 대규모로 구축하는 데 기여하고 있어, 시장 확대를 더욱 뒷받침하고 있습니다.
자주 묻는 질문
목차
제1장 조사 방법
제2장 주요 요약
제3장 업계 인사이트
제4장 경쟁 구도
제5장 시장 추산 및 예측 : 커넥터별, 2022년-2035년
제6장 시장 추산 및 예측 : 전류별, 2022년-2035년
제7장 시장 추산 및 예측 : 용도별, 2022년-2035년
제8장 시장 추산 및 예측 : 전압별, 2022년-2035년
제9장 시장 추산 및 예측 : 접속 방식별, 2022년-2035년
제10장 시장 추산 및 예측 : 지역별, 2022년-2035년
제11장 기업 개요
LSH 26.07.02The Global EV Connector Market was valued at USD 4.2 billion in 2025 and is estimated to grow at a CAGR of 15.1% to reach USD 17.1 billion by 2035.

The market expansion is driven by a structural transformation in the automotive industry, where electrification is significantly broadening the application scope of EV connectors across charging infrastructure and in-vehicle systems. Growth is not only volume-driven but also shaped by increasing diversity in electric mobility platforms, including passenger battery electric vehicles, commercial EVs, and electric two-wheelers, each requiring specialized connector solutions. Rising EV production levels are further increasing connector content per vehicle, particularly with the adoption of high-voltage architectures. Government investments in charging infrastructure are accelerating deployment rates globally. A major technological shift toward 800V electrical systems is also reshaping the industry, enabling faster charging speeds and improved drivetrain efficiency. Automakers are increasingly transitioning from 400V to 800V platforms to reduce charging times and support high-performance electric vehicles, which is significantly strengthening demand for advanced connector technologies.
| Market Scope | |
|---|---|
| Start Year | 2025 |
| Forecast Year | 2026-2035 |
| Start Value | $4.2 Billion |
| Forecast Value | $17.1 Billion |
| CAGR | 15.1% |
The in-vehicle onboard connectors segment held a 68% share in 2025 and is expected to grow at a CAGR of 14.5% from 2026 to 2035. This segment is being reshaped by the shift toward zonal electrical architectures, which replace traditional complex wiring systems with more centralized computing models. This transition reduces wiring complexity, lowers vehicle weight, and enhances data transmission efficiency, further strengthening the demand for advanced onboard connector systems.
The wire-to-wire segment accounted for 47.1% share in 2025 and is projected to grow at a CAGR of 14.3% during 2026-2035. Wire-to-wire connectors continue to be widely used in EV platforms due to their reliability and straightforward design for power and signal transfer. Although their dominance is gradually easing due to evolving compact electronic architectures, they remain essential for power distribution systems, legacy wiring setups, and applications requiring high durability in automotive environments.
U.S. EV Connector Market reached USD 745.5 million in 2025 and is projected to grow at a CAGR of 14.8% through 2035. Market growth is being shaped by the transition toward the Tesla NACS charging standard, which is influencing connector design strategies across OEMs and charging infrastructure operators. This shift is increasing demand for dual-compatible and high-voltage DC connectors while helping reduce ecosystem fragmentation. Federal NEVI funding is also supporting large-scale deployment of highway fast-charging networks, further strengthening market expansion.
Major players operating in the EV connector industry include ABB, Amphenol, Aptiv, Harting, Hirose Electric, ITT, Mennekes Elektrotechnik, Molex (Koch Industries), Phoenix Contact, Rosenberger, Sumitomo Electric, TE Connectivity, and Yazaki. Companies in the EV connector market are prioritizing the development of high-voltage and fast-charging compatible connector systems to align with evolving EV architectures. Strong investment in R&D is enabling improved thermal performance, miniaturization, and durability. Strategic partnerships with automakers and charging infrastructure providers help accelerate product standardization and ecosystem compatibility. Manufacturers are expanding production capacities to meet rising EV demand while strengthening supply chain resilience. Integration of smart connectors with enhanced data communication capabilities is also gaining traction.
Table of Contents
Chapter 1 Methodology
- 1.1 Research approach
- 1.2 Quality commitments
- 1.3 GMI AI policy & data integrity commitment
- 1.4 Research trail & confidence scoring
- 1.4.1 Research trail components
- 1.4.2 Scoring components
- 1.5 Data collection
- 1.5.1 Partial list of primary sources
- 1.6 Data mining sources
- 1.6.1 Paid sources
- 1.7 Base estimates and calculations
- 1.7.1 Base year calculation
- 1.8 Forecast model
- 1.9 Research transparency addendum
Chapter 2 Executive Summary
- 2.1 Industry 360° synopsis
- 2.2 Key market trends
- 2.2.1 Regional
- 2.2.2 Connector
- 2.2.3 Current
- 2.2.4 Application
- 2.2.5 Voltage
- 2.2.6 Connection
- 2.3 TAM analysis, 2026-2035
- 2.4 CXO perspectives: Strategic imperatives
Chapter 3 Industry Insights
- 3.1 Industry ecosystem analysis
- 3.1.1 Supplier landscape
- 3.1.2 Profit margin
- 3.1.3 Cost structure
- 3.1.4 Value addition at each stage
- 3.1.5 Factor affecting the value chain
- 3.1.6 Disruptions
- 3.2 Industry impact forces
- 3.2.1 Growth drivers
- 3.2.1.1 Rapid EV adoption growth
- 3.2.1.2 Charging infrastructure expansion
- 3.2.1.3 High-voltage platform shift
- 3.2.1.4 Increasing onboard electronics density
- 3.2.2 Industry pitfalls and challenges
- 3.2.2.1 Standard fragmentation complexity
- 3.2.2.2 Raw material price volatility
- 3.2.3 Market opportunities
- 3.2.3.1 Wireless charging emergence
- 3.2.3.2 Heavy-duty EV electrification
- 3.2.3.3 Emerging market expansion
- 3.2.3.4 Smart connector integration
- 3.2.1 Growth drivers
- 3.3 Growth potential analysis
- 3.4 Technology and innovation landscape
- 3.4.1 Current technological trends
- 3.4.2 Emerging technologies
- 3.5 Pricing analysis (Driven by Primary Research)
- 3.5.1 Historical price trend analysis
- 3.5.2 Pricing strategy by player type (premium / value / cost-plus)
- 3.6 Regulatory landscape
- 3.6.1 North America
- 3.6.1.1 SAE International
- 3.6.1.2 National Highway Traffic Safety Administration (NHTSA)
- 3.6.2 Europe
- 3.6.2.1 European Commission (EC)
- 3.6.2.2 European Committee for Standardization (CEN-CENELEC)
- 3.6.3 Asia Pacific
- 3.6.3.1 Ministry of Industry and Information Technology (MIIT, China)
- 3.6.3.2 Bureau of Indian Standards (BIS)
- 3.6.4 Latin America
- 3.6.4.1 National Institute of Metrology, Quality and Technology (INMETRO - Brazil)
- 3.6.4.2 Mexican Secretariat of Economy (SE)
- 3.6.5 Middle East & Africa
- 3.6.5.1 Gulf Standardization Organization (GSO)
- 3.6.5.2 South African Bureau of Standards (SABS)
- 3.6.1 North America
- 3.7 Porter's analysis
- 3.8 PESTEL analysis
- 3.9 Patent analysis (Driven by Primary Research)
- 3.10 Trade data analysis (Driven by paid database)
- 3.10.1 Import/export volume & value trends
- 3.10.2 Key trade corridors & tariff impact
- 3.11 Impact of AI & Generative AI on the Market
- 3.11.1 AI-driven disruption of existing business models
- 3.11.2 Gen AI use cases & adoption roadmap by segment
- 3.11.3 Risks, limitations & regulatory considerations
- 3.12 Capacity & Production Landscape (Driven by Primary Research)
- 3.12.1 Production Capacity by Region & Key Producer
- 3.12.2 Capacity Utilization Rates & Expansion Pipelines
- 3.13 Sustainability and environmental aspects
- 3.13.1 Sustainable practices
- 3.13.2 Waste reduction strategies
- 3.13.3 Energy efficiency in production
- 3.13.4 Eco-friendly initiatives
- 3.13.5 Carbon footprint considerations
- 3.14 Forecast assumptions & scenario analysis (Driven by primary research)
- 3.14.1 Base Case - key macro & industry variables driving CAGR
- 3.14.2 Optimistic Scenarios - Favorable macro and industry tailwinds
- 3.14.3 Pessimistic Scenario - Macroeconomic slowdown or industry headwinds
Chapter 4 Competitive Landscape, 2025
- 4.1 Introduction
- 4.2 Company market share analysis
- 4.2.1 North America
- 4.2.2 Europe
- 4.2.3 Asia Pacific
- 4.2.4 LATAM
- 4.2.5 MEA
- 4.3 Competitive analysis of major market players
- 4.4 Competitive positioning matrix
- 4.5 Key developments
- 4.5.1 Mergers & acquisitions
- 4.5.2 Partnerships & collaborations
- 4.5.3 New product launches
- 4.5.4 Expansion plans and funding
Chapter 5 Market Estimates & Forecast, By Connector, 2022 - 2035 ($Mn, Mn units)
- 5.1 Key trends
- 5.2 Charging interface connectors
- 5.3 In-vehicle onboard connectors
Chapter 6 Market Estimates & Forecast, By Current, 2022 - 2035 ($Mn, Mn units)
- 6.1 Key trends
- 6.2 AC connectors
- 6.3 DC connectors
- 6.4 Combined AC/DC connectors
Chapter 7 Market Estimates & Forecast, By Application, 2022 - 2035 ($Mn, Mn units)
- 7.1 Key trends
- 7.2 Charging
- 7.3 Body control & interiors
- 7.4 Infotainment systems
- 7.5 Powertrain & engine management
- 7.6 Battery management system
- 7.7 Others
Chapter 8 Market Estimates & Forecast, By Voltage, 2022 - 2035 ($Mn, Mn units)
- 8.1 Key trends
- 8.2 Low voltage connectors (<60V)
- 8.3 Medium voltage connectors (60V-400V)
- 8.4 High voltage connectors (>400V)
Chapter 9 Market Estimates & Forecast, By Connection, 2022 - 2035 ($Mn, Mn units)
- 9.1 Key trends
- 9.2 Wire-to-wire
- 9.3 Wire-to-board
- 9.4 Board-to-board
Chapter 10 Market Estimates & Forecast, By Region, 2022 - 2035 ($Mn, Mn units)
- 10.1 Key trends
- 10.2 North America
- 10.2.1 U.S.
- 10.2.2 Canada
- 10.3 Europe
- 10.3.1 Germany
- 10.3.2 France
- 10.3.3 UK
- 10.3.4 Italy
- 10.3.5 Spain
- 10.3.6 Netherlands
- 10.3.7 Sweden
- 10.3.8 Norway
- 10.3.9 Poland
- 10.3.10 Belgium
- 10.4 Asia Pacific
- 10.4.1 China
- 10.4.2 India
- 10.4.3 Japan
- 10.4.4 South Korea
- 10.4.5 Indonesia
- 10.4.6 Vietnam
- 10.4.7 Thailand
- 10.4.8 Malaysia
- 10.4.9 Australia
- 10.4.10 Singapore
- 10.5 Latin America
- 10.5.1 Brazil
- 10.5.2 Mexico
- 10.5.3 Argentina
- 10.6 MEA
- 10.6.1 South Africa
- 10.6.2 Saudi Arabia
- 10.6.3 UAE
Chapter 11 Company Profiles
- 11.1 Global players
- 11.1.1 Amphenol
- 11.1.2 Aptiv
- 11.1.3 Hirose Electric
- 11.1.4 Molex
- 11.1.5 Rosenberger Hochfrequenztechnik
- 11.1.6 Sumitomo Electric Industries
- 11.1.7 TE Connectivity
- 11.1.8 Yazaki
- 11.2 Regional players
- 11.2.1 Fujikura
- 11.2.2 Furukawa Electric
- 11.2.3 HUBER+SUHNER
- 11.2.4 JST (Japan Solderless Terminal)
- 11.2.5 KOSTAL
- 11.2.6 Leoni
- 11.2.7 Mennekes Elektrotechnik
- 11.2.8 Phoenix Contact E-Mobility
- 11.3 Emerging players
- 11.3.1 JONHON (Avic Jonhon Optronic)
- 11.3.2 Luxshare-ICT
- 11.3.3 SINBON Electronics
- 11.3.4 Yonggui Electric Equipment
