
|
시장보고서
상품코드
2071420
부유식 태양광발전 시장 기회, 성장 촉진요인, 업계 동향 분석 및 예측(2026-2035년)Floating Solar PV Market Opportunity, Growth Drivers, Industry Trend Analysis, and Forecast 2026 - 2035 |
||||||
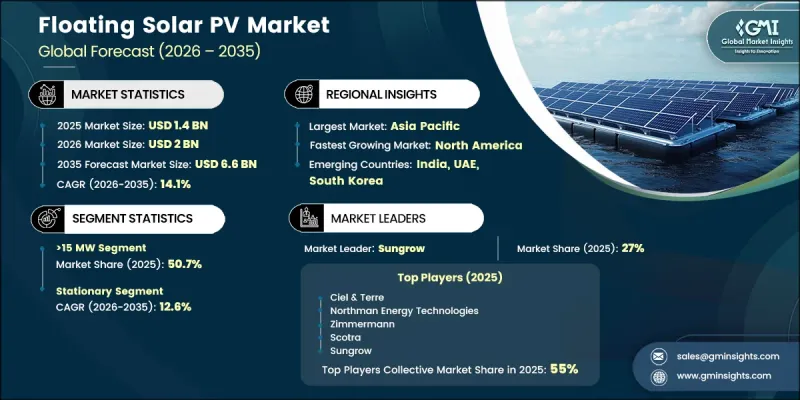
세계의 부유식 태양광발전 시장은 2025년에 14억 달러에 이르고, 2035년까지 연평균 복합 성장률(CAGR)14.1%로 성장하여 66억 달러에 달할 것으로 추정되고 있습니다.
부유식 태양광발전 시스템은 저수지, 해양, 호수 등의 수면에 설치된 태양광 패널 군으로 구성되어 있으며, 패널은 육지를 차지하지 않고 부력이 있는 구조물 위에 설치됩니다. 이러한 구성 덕분에 육상 공간을 차지하지 않고도 발전이 가능해지며, 동시에 충분히 활용되지 않고 있는 수역을 활용할 수 있습니다. 부유식 태양광발전과 수력 발전 시설의 통합이 진행되고 있는 점, 내구성이 뛰어난 부유 구조 및 개선된 계류 기술 등 재료 공학 분야의 지속적인 발전 덕분에 도입이 급속히 확대되고 있습니다. 이러한 발전 덕분에 설치 안정성이 향상되었으며, 시스템의 수명도 연장되고 있습니다. 수상 자연 냉각을 통한 에너지 효율 향상과 증발률 저감은 기온이 높은 지역이나 담수 자원이 제한된 지역에서의 도입을 촉진하고 있습니다. 이용 가능한 토지가 제한적인 도서 지역이나 연안 지역에서의 이용 확대 역시 시장 전망을 더욱 견고하게 만들고 있습니다. 고밀도 폴리에틸렌 및 기타 내성이 뛰어난 소재로 제작된 새로운 플랫폼은 자외선, 기상 변화, 해양 환경을 견딜 수 있도록 설계되어, 가혹한 환경에서도 더욱 신뢰할 수 있는 시스템 성능을 보장합니다.
| 시장 범위 | |
|---|---|
| 개시 연도 | 2025년 |
| 예측 기간 | 2026-2035년 |
| 개시 금액 | 14억 달러 |
| 예측 금액 | 66억 달러 |
| CAGR | 14.1% |
2025년에는 15 MW를 초과하는 용량 범주가 50.7%의 점유율을 차지했습니다. 이는 대규모 프로젝트의 확대, 새로운 기술 역량, 그리고 정책 주도적 지원에 힘입은 결과입니다. 중국, 한국, 인도 등 여러 국가에서 도입이 확대됨에 따라, 국가 송전망에 막대한 전력을 공급하는 유틸리티 규모의 부유식 시스템은 계속해서 성장세를 이어가고 있습니다. 이러한 설비는 수력 발전 시설과의 인프라 공유를 통해 혜택을 받는 경우가 많아, 통합 비용 절감과 재무적 실현성 향상으로 이어지고 있으며, 이는 더 폭넓은 투자자들의 참여를 촉진하고 있습니다.
추적 기술 부문은 2035년까지 연평균 성장률(CAGR) 18.9%로 성장할 것으로 전망됩니다. 태양광발전량 극대화가 점점 더 중요시되는 가운데, 수상 프로젝트에 적합한 첨단 추적 시스템에 대한 수요가 증가하고 있습니다. 포르투갈과 스페인을 비롯한 각국은 토지 제약과의 균형을 유지하면서 재생에너지 발전량 증대에 주력하고 있으며, 이것이 설치 건수 증가에 기여하고 있습니다. 부유식 환경에 특화된 추적 설계의 개선을 통해 시스템의 적응성과 장기적인 신뢰성은 지속적으로 향상되고 있습니다.
북미의 부유식 태양광발전 시장은 2035년까지 연평균 성장률(CAGR) 30.2%를 나타낼 것으로 예측됩니다. 이 지역의 성장은 혁신적인 태양광 기술 도입을 촉진하는 주 차원의 재생에너지 관련 정책 및 인센티브와 밀접한 관련이 있습니다. Sungrow Group을 비롯한 여러 제조업체들은 해당 지역의 다양한 기후 조건을 견딜 수 있는 맞춤형 부유식 모듈을 개발하고 있습니다.
자주 묻는 질문
목차
제1장 조사 방법과 범위
제2장 주요 요약
제3장 업계 인사이트
제4장 경쟁 구도
제5장 시장 규모와 예측 : 용량별, 2022년-2035년
제6장 시장 규모와 예측 : 제품별, 2022년-2035년
제7장 시장 규모와 예측 : 로케이션별, 2022년-2035년
제8장 시장 규모와 예측 : 지역별, 2022년-2035년
제9장 기업 개요
LSH 26.07.02The Global Floating Solar PV Market was valued at USD 1.4 billion in 2025 and is estimated to grow at a CAGR of 14.1% to reach USD 6.6 billion by 2035.

Floating solar photovoltaic systems consist of solar arrays installed on water surfaces such as reservoirs, oceans, and lakes, where panels rest on buoyant structures instead of occupying land. This configuration enables power generation without competing for terrestrial space while making use of underutilized water areas. Strong adoption is emerging from the growing integration of floating solar with hydropower facilities and the ongoing improvements in material engineering, including durable floating structures and enhanced anchoring technology. These advancements support better installation stability and longer system life. Higher energy efficiency achieved through natural cooling on water and reduced evaporation rates encourages deployment in regions with elevated temperatures or limited freshwater resources. Increasing utilization in island communities and coastal territories with minimal available land further strengthens the market outlook. New platforms made with high-density polyethylene and other resistant materials are engineered to withstand UV exposure, fluctuating weather, and marine conditions, ensuring more reliable system performance across demanding environments.
| Market Scope | |
|---|---|
| Start Year | 2025 |
| Forecast Year | 2026-2035 |
| Start Value | $1.4 Billion |
| Forecast Value | $6.6 Billion |
| CAGR | 14.1% |
The capacity category above 15 MW held 50.7% share in 2025, fueled by expanding large-scale project activity, new technical capabilities, and policy-driven support. Growing adoption in nations such as China, South Korea, and India continues to elevate utility-scale floating systems that contribute substantial power to national grids. These installations often benefit from shared infrastructure with hydropower facilities, reducing integration costs and improving financial feasibility, which has encouraged broader investor participation.
The tracking technology segment is projected to grow at a CAGR of 18.9% through 2035. Rising emphasis on maximizing solar yield is strengthening demand for advanced tracking configurations suitable for water-based projects. Countries, including Portugal and Spain, are focusing on improving renewable energy output while balancing land constraints, contributing to increased installations. Enhancements in tracking design tailored for floating environments continue to improve system adaptability and long-term reliability.
North America Floating Solar PV Market is expected to grow at a CAGR of 30.2% by 2035. Regional growth is tied to state-level renewable initiatives and incentives that encourage the adoption of innovative solar technologies. Manufacturers such as Sungrow Group and others are developing customized floating modules capable of withstanding varying climate conditions across the region.
Key participants in the Global Floating Solar PV Market include Amoy Solar Tech, Ciel & Terre International, China Three Gorges New Energy, Floatex Solar, Intech Clean Energy, First Solar, Kyocera Corporation, Jinko Solar, Longi Solar, Ocean Sun, Scotra, SolarDeck, Swimsol, Sharp Corporation, Statkraft, Sungrow Group, Vikram Solar, Zimmermann PV, Eni Energy Solutions, and Yingli Solar. Key strategies adopted by companies in the Floating Solar PV Market aim to enhance performance, reduce installation complexities, and broaden global project footprints. Many firms are investing heavily in advanced float materials designed to improve durability and resistance in marine and freshwater environments. Companies are also focusing on modular system designs that simplify assembly and reduce construction timelines. Partnerships with utilities and government agencies help accelerate deployment across hydropower reservoirs and water treatment facilities.
Table of Contents
Chapter 1 Methodology & Scope
- 1.1 Research design
- 1.2 Quality commitment
- 1.2.1 GMI AI policy & data integrity commitment
- 1.2.1.1 Source consistency protocol
- 1.2.1 GMI AI policy & data integrity commitment
- 1.3 Research Trail & Confidence Scoring
- 1.3.1 Research trail components
- 1.3.2 Scoring components
- 1.4 Data Collection
- 1.4.1 Partial list of primary sources
- 1.5 Data mining sources
- 1.5.1 Paid sources
- 1.5.1.1 Sources, by region
- 1.5.1 Paid sources
- 1.6 Base estimates and calculations
- 1.6.1 Base year calculation for any one approach
- 1.7 Forecast model
- 1.8 Research transparency addendum
- 1.8.1 Source attribution framework
- 1.8.2 Quality assurance metrics
- 1.8.3 Our commitment to trust
- 1.9 Market definitions
Chapter 2 Executive Summary
- 2.1 Industry 360-degree synopsis, 2022 - 2035
- 2.2 Business trends
- 2.3 Capacity trends
- 2.4 Product trends
- 2.5 Location trends
- 2.6 Regional trends
Chapter 3 Industry Insights
- 3.1 Industry ecosystem
- 3.2 Regulatory landscape
- 3.2.1 Inland water body regulations
- 3.2.2 Near-shore & coastal zone regulations
- 3.2.3 Cross-jurisdictional compliance
- 3.3 Major floating solar PV projects
- 3.3.1 Operational
- 3.3.2 Upcoming
- 3.4 Industry impact forces
- 3.4.1 Growth drivers
- 3.4.2 Industry pitfalls & challenges
- 3.5 Growth potential analysis
- 3.6 Cost structure analysis
- 3.7 Price trend analysis
- 3.7.1 Historic price trend analysis by segment
- 3.7.2 Pricing strategy by player type
- 3.8 Porter's analysis
- 3.8.1 Bargaining power of suppliers
- 3.8.2 Bargaining power of buyers
- 3.8.3 Threat of new entrants
- 3.8.4 Threat of substitutes
- 3.9 PESTEL analysis
- 3.9.1 Political factors
- 3.9.2 Economic factors
- 3.9.3 Social factors
- 3.9.4 Technological factors
- 3.9.5 Legal factors
- 3.9.6 Environmental factors
- 3.10 Emerging opportunities & trends
- 3.11 Digitalization & IoT integration
- 3.12 Investment analysis and future outlook
Chapter 4 Competitive landscape, 2026
- 4.1 Introduction
- 4.2 Company market share analysis, by region, 2025
- 4.2.1 North America
- 4.2.2 Europe
- 4.2.3 Asia Pacific
- 4.2.4 Middle East & Africa
- 4.2.5 Latin America
- 4.3 Competitive analysis of major market players
- 4.4 Competitive positioning matrix
- 4.5 Key developments
- 4.5.1 Mergers & acquisitions
- 4.5.2 Partnerships & collaborations
- 4.5.3 New product launches
- 4.5.4 Expansion plans & funding
- 4.6 Company tier benchmarking
- 4.6.1 Tier classification criteria & qualifying thresholds
- 4.6.2 Tier positioning matrix by revenue, geography & innovation
Chapter 5 Market Size and Forecast, By Capacity, 2022 - 2035 (USD Billion & MW)
- 5.1 Key trends
- 5.2 <5 MW
- 5.3 5-15 MW
- 5.4 >15 MW
Chapter 6 Market Size and Forecast, By Product, 2022 - 2035 (USD Billion & MW)
- 6.1 Key trends
- 6.2 Stationary
- 6.3 Tracking
Chapter 7 Market Size and Forecast, By Location, 2022 - 2035 (USD Billion & MW)
- 7.1 Key trends
- 7.2 Inland
- 7.3 Near Shore
Chapter 8 Market Size and Forecast, By Region, 2022 - 2035 (USD Billion & MW)
- 8.1 Key trends
- 8.2 North America
- 8.2.1 U.S.
- 8.2.2 Canada
- 8.3 Europe
- 8.3.1 Germany
- 8.3.2 France
- 8.3.3 Netherlands
- 8.3.4 Italy
- 8.3.5 Norway
- 8.4 Asia Pacific
- 8.4.1 China
- 8.4.2 Japan
- 8.4.3 South Korea
- 8.4.4 India
- 8.4.5 Indonesia
- 8.5 Middle East & Africa
- 8.5.1 Morocco
- 8.5.2 UAE
- 8.6 Latin America
- 8.6.1 Brazil
- 8.6.2 Chile
Chapter 9 Company Profiles
- 9.1 Amoy Solar Tech
- 9.2 China Three Gorges New Energy
- 9.3 Ciel & Terre International
- 9.4 Eni Energy Solutions
- 9.5 First Solar
- 9.6 Floatex Solar
- 9.7 Intech Clean Energy
- 9.8 Jinko Solar
- 9.9 Kyocera Corporation
- 9.10 Longi Solar
- 9.11 Ocean Sun
- 9.12 Scotra
- 9.13 SolarDeck
- 9.14 Sungrow Power Supply
- 9.15 Statkraft
- 9.16 Swimsol
- 9.17 Sharp Corporation
- 9.18 Vikram Solar
- 9.19 Yingli Solar
- 9.20 Zimmermann PV
