

|
시장보고서
상품코드
2083054
N형 태양광 모듈 시장 기회, 성장 촉진요인, 업계 동향 분석 및 예측(2026-2035년)N Type Solar Module Market Opportunity, Growth Drivers, Industry Trend Analysis, and Forecast 2026 - 2035 |
||||||

세계의 N형 태양광 모듈 시장은 2025년에 580억 달러 규모에 달하고, CAGR 5.3%로 성장하여 2035년까지 998억 달러에 달할 것으로 추정됩니다.
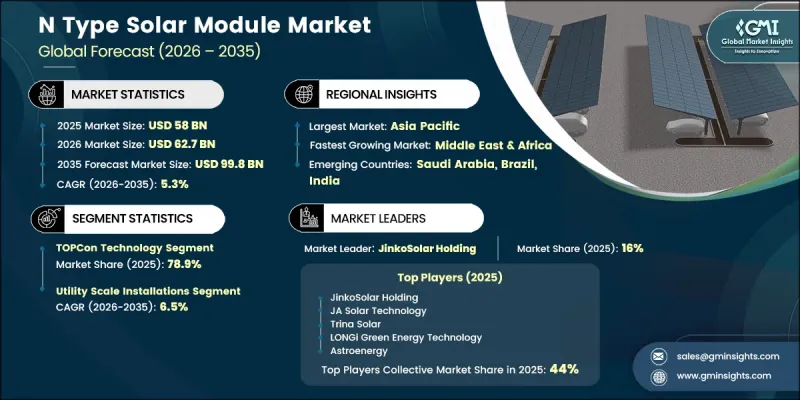
N형 태양광 모듈 시장의 성장은 재생에너지 정책, 제조 비용의 하락, 그리고 전 세계 태양광 시장에서 프로젝트의 경제성 향상이 맞물려 촉진되고 있습니다. 첨단 셀 구조의 도입이 확대됨에 따라 모듈의 성능이 향상되고, 장기적인 발전량이 증가하는 동시에 운영 효율 향상에도 기여하고 있습니다. 기존 태양광발전 기술과 비교했을 때, N형 모듈은 열화율이 낮고 신뢰성이 높으며, 다양한 환경 조건에서도 뛰어난 성능을 발휘하기 때문에 프로젝트 개발자나 투자자들에게 점점 더 매력적인 선택지가 되고 있습니다. 이러한 장점은 태양광발전 설비의 수명 기간에 걸친 전체 수명 주기 동안 에너지 생산량을 향상시키고, 더 유리한 발전 경제성을 실현하는 데 기여하고 있습니다. 정부, 전력회사, 민간 기업이 재생에너지 발전 도입 용량을 지속적으로 확대해 나가는 가운데, 고효율 태양광발전 기술에 대한 수요는 더욱 증가할 것으로 예상됩니다. 지속적인 기술 발전, 제조 규모의 확대, 그리고 장기적인 자산 성과에 대한 중요성이 커짐에 따라, 예측 기간 동안 시장의 성장 전망이 계속해서 뒷받침되고 있습니다.
| 시장 범위 | |
|---|---|
| 시작 연도 | 2025년 |
| 예측 기간 | 2026-2035년 |
| 초기 시장 규모 | 580억 달러 |
| 예측액 | 998억 달러 |
| CAGR | 5.3% |
2025년에는 TOPCon 기술이 78.9%의 시장 점유율을 차지했습니다. 이러한 선도적인 지위는 제조 분야의 뛰어난 확장성, 높은 변환 효율, 그리고 기존 태양광발전 생산 인프라와의 호환성에 의해 뒷받침되고 있습니다. 이 기술은 24.5%를 넘는 효율 수준을 유지하면서 상업적 규모의 생산을 실현할 수 있음을 입증했으며, 생산량과 모듈 성능의 최적화를 목표로 하는 제조업체들에게 매력적인 솔루션이 되고 있습니다. 제조업체들이 첨단 제조 역량에 대한 투자를 지속하는 가운데, TOPCon 기술은 비용 효율성, 성능, 생산 유연성 간의 균형이 뛰어나기 때문에 시장 내에서 확고한 입지를 유지할 것으로 예상됩니다.
2025년에는 유틸리티 규모의 설치가 시장 점유율의 67.9%를 차지했으며, 2035년까지 연평균 성장률(CAGR) 6.5%를 기록할 것으로 전망되어, 이는 가장 빠르게 성장하는 용도 부문으로 꼽히고 있습니다. 대규모 태양광발전 프로젝트에서는 장기적인 성능 특성의 우수성, 낮은 열화율, 발전 능력 향상 등의 이유로 N형 모듈이 점점 더 선호되고 있습니다. 유틸리티 개발 사업자들은 프로젝트의 경제성을 높이는 동시에, 장기적인 운영 신뢰성을 뒷받침하는 기술을 지속적으로 우선시하고 있습니다. 또한, 프로젝트 운영자들이 설치 효율 향상, 토지 이용 최적화, 그리고 시스템 전체의 비용 절감을 도모하는 가운데, 고출력 모듈 형식에 대한 수요 증가도 이 부문의 성장에 기여하고 있습니다. 이러한 요인들로 인해, 유틸리티 규모의 프로젝트는 전 세계적으로 N형 태양광 모듈의 주요 수요 견인 역할로서의 입지를 더욱 공고히 하고 있습니다.
북미의 N형 태양광 모듈 시장은 2025년에 17.9%의 점유율을 차지했으며, 2035년까지 연평균 성장률(CAGR) 6.6%로 성장할 것으로 전망되어 가장 빠르게 성장하는 지역 시장 중 하나가 되고 있습니다. 이 지역의 시장 성장은 재생에너지에 대한 우호적인 정책, 태양광발전 도입 목표 상향 조정, 그리고 국내 태양광발전 생산능력 강화를 목표로 한 투자에 힘입어 이루어지고 있습니다. 지원적인 규제 체계와 재정적 인센티브는 첨단 태양광발전 기술의 보급을 촉진하는 동시에, 현지에서 제조된 제품의 경쟁력을 높이고 있습니다. 또한, 에너지 안보에 대한 수요 증가, 지속가능성 추구, 그리고 청정에너지 발전에 대한 수요 증대가 북미 전역의 태양광발전 인프라 투자를 지속적으로 견인하고 있으며, 이는 장기적인 시장 확대를 위한 유리한 여건을 조성하고 있습니다.
자주 묻는 질문
목차
제1장 조사 방법과 범위
제2장 주요 요약
제3장 업계 인사이트
제4장 경쟁 구도
제5장 시장 규모 및 예측 : 셀 기술별, 2022-2035년
제6장 시장 규모 및 예측 : 모듈 구성별, 2022-2035년
제7장 시장 규모 및 예측 : 셀 형식별, 2022-2035년
제8장 시장 규모 및 예측 : 출력 정격별, 2022-2035년
제9장 시장 규모 및 예측 : 용도별, 2022-2035년
제10장 시장 규모 및 예측 : 지역별, 2022-2035년
제11장 기업 개요
KSM 26.07.15The Global N-Type Solar Module Market was valued at USD 58 billion in 2025 and is estimated to grow at a CAGR of 5.3% to reach USD 99.8 billion by 2035.
Growth in the N-Type Solar Module Market is being driven by the combined impact of renewable energy policies, declining manufacturing costs, and improving project economics across global solar markets. The increasing adoption of advanced cell architectures is enhancing module performance, improving long-term energy generation, and supporting greater operational efficiency. Compared with conventional photovoltaic technologies, N-type modules offer lower degradation rates, improved reliability, and stronger performance under varying environmental conditions, making them increasingly attractive to project developers and investors. These advantages contribute to enhanced lifecycle energy output and more favorable electricity generation economics over the lifespan of solar installations. As governments, utilities, and private-sector organizations continue to expand renewable energy capacity, demand for high-efficiency solar technologies is expected to strengthen further. Ongoing technological advancements, manufacturing scale improvements, and growing emphasis on long-term asset performance continue to reinforce the market's growth outlook through the forecast period.
| Market Scope | |
|---|---|
| Start Year | 2025 |
| Forecast Year | 2026-2035 |
| Start Value | $58 Billion |
| Forecast Value | $99.8 Billion |
| CAGR | 5.3% |
TOPCon technology accounted for 78.9% share in 2025. Its leadership position is supported by strong manufacturing scalability, high conversion efficiency, and compatibility with existing solar production infrastructure. The technology has demonstrated its ability to achieve commercial-scale production while maintaining efficiency levels exceeding 24.5%, making it an attractive solution for manufacturers seeking to optimize production output and module performance. As producers continue investing in advanced manufacturing capabilities, TOPCon technology is expected to maintain its strong position within the market due to its balance of cost efficiency, performance, and production flexibility.
Utility-scale installations represented 67.9% share in 2025 and is projected to register a CAGR of 6.5% through 2035, making this the fastest-growing application segment. Large-scale solar projects increasingly favor N-type modules because of their superior long-term performance characteristics, lower degradation profiles, and enhanced energy generation capabilities. Utility developers continue to prioritize technologies that improve project economics while supporting long-term operational reliability. Growing demand for higher-wattage module formats is also contributing to segment growth, as project operators seek to improve installation efficiency, optimize land utilization, and reduce overall system costs. These factors continue to strengthen the role of utility-scale projects as the primary demand driver for N-type solar modules globally.
North America N-Type Solar Module Market accounted for 17.9% share in 2025 and is expected to grow at a CAGR of 6.6% through 2035, representing one of the fastest-growing regional markets. Market growth in the region is being supported by favorable renewable energy policies, increasing solar deployment targets, and investments aimed at strengthening domestic solar manufacturing capabilities. Supportive regulatory frameworks and financial incentives are encouraging broader adoption of advanced solar technologies while improving the competitiveness of locally manufactured products. In addition, growing demand for energy security, sustainability initiatives, and clean energy generation continues to drive investment in solar infrastructure across North America, creating favorable conditions for long-term market expansion.
Major companies operating in the Global N-Type Solar Module Market include Trina Solar, JinkoSolar Holding, Canadian Solar, LONGi Green Energy Technology, JA Solar Technology, Hanwha Q CELLS, First Solar, REC Group, Astroenergy, and Waaree Technologies. Companies operating in the N-Type Solar Module Market are implementing several strategic initiatives to strengthen their market position and expand global market share. Product innovation remains a primary focus, with manufacturers investing heavily in advanced cell technologies, higher conversion efficiencies, and improved module durability. Capacity expansion programs are being pursued to support growing global demand while reducing production costs through economies of scale. Many companies are also enhancing vertical integration across the value chain to improve supply chain control and operational efficiency. Strategic partnerships, long-term supply agreements, and geographic expansion efforts are helping market participants increase customer reach and strengthen distribution networks.
Table of Contents
Chapter 1 Methodology & Scope
- 1.1 Research design
- 1.2 Quality commitment
- 1.2.1 GMI AI policy & data integrity commitment
- 1.2.1.1 Source consistency protocol
- 1.2.1 GMI AI policy & data integrity commitment
- 1.3 Research Trail & Confidence Scoring
- 1.3.1 Research trail components
- 1.3.2 Scoring components
- 1.4 Data Collection
- 1.4.1 Partial list of primary sources
- 1.5 Data mining sources
- 1.5.1 Paid sources
- 1.5.1.1 Sources, by region
- 1.5.1 Paid sources
- 1.6 Base estimates and calculations
- 1.6.1 Base year calculation for any one approach
- 1.7 Forecast model
- 1.8 Research transparency addendum
- 1.8.1 Source attribution framework
- 1.8.2 Quality assurance metrics
- 1.8.3 Our commitment to trust
- 1.9 Market definitions
Chapter 2 Executive Summary
- 2.1 Industry 360° synopsis, 2022 - 2035
- 2.2 Business trends
- 2.3 Cell technology trends
- 2.4 Module configuration trends
- 2.5 Cell format trends
- 2.6 Power rating trends
- 2.7 Application trends
- 2.8 Regional trends
Chapter 3 Industry Insights
- 3.1 Industry ecosystem
- 3.2 Regulatory landscape
- 3.3 Industry impact forces
- 3.3.1 Growth drivers
- 3.3.2 Industry pitfalls & challenges
- 3.4 Growth potential analysis
- 3.5 Cost structure analysis
- 3.6 Technology & Innovation Landscape
- 3.7 Price trend analysis
- 3.7.1 Historic price trend analysis by segment
- 3.7.2 Pricing strategy by player type
- 3.8 Porter's analysis
- 3.8.1 Bargaining power of suppliers
- 3.8.2 Bargaining power of buyers
- 3.8.3 Threat of new entrants
- 3.8.4 Threat of substitutes
- 3.9 PESTEL analysis
- 3.9.1 Political factors
- 3.9.2 Economic factors
- 3.9.3 Social factors
- 3.9.4 Technological factors
- 3.9.5 Legal factors
- 3.9.6 Environmental factors
- 3.10 Emerging opportunities & trends
- 3.11 Digitalization & IoT integration
- 3.12 Investment analysis and future outlook
Chapter 4 Competitive landscape, 2026
- 4.1 Introduction
- 4.2 Company market share analysis, by region, 2025
- 4.2.1 North America
- 4.2.2 Europe
- 4.2.3 Asia Pacific
- 4.2.4 Middle East & Africa
- 4.2.5 Latin America
- 4.3 Competitive analysis of major market players
- 4.4 Competitive positioning matrix
- 4.5 Key developments
- 4.5.1 Mergers & acquisitions
- 4.5.2 Partnerships & collaborations
- 4.5.3 New product launches
- 4.5.4 Expansion plans & funding
- 4.6 Company tier benchmarking
- 4.6.1 Tier classification criteria & qualifying thresholds
- 4.6.2 Tier positioning matrix by revenue, geography & innovation
Chapter 5 Market Size and Forecast, By Cell Technology, 2022 - 2035 (USD Million & MW)
- 5.1 Key trends
- 5.2 TOPCon
- 5.3 HJT
- 5.4 IBC
- 5.5 Others
Chapter 6 Market Size and Forecast, By Module Configuration, 2022 - 2035 (USD Million & MW)
- 6.1 Key trends
- 6.2 Monofacial
- 6.3 Bifacial
Chapter 7 Market Size and Forecast, By Cell Format, 2022 - 2035 (USD Million & MW)
- 7.1 Key trends
- 7.2 Half cut cell
- 7.3 Shingled cell
- 7.4 Full cell
Chapter 8 Market Size and Forecast, By Power Rating, 2022 - 2035 (USD Million & MW)
- 8.1 Key trends
- 8.2 <500 W
- 8.3 500-600 W
- 8.4 600-700 W
- 8.5 >700 W
Chapter 9 Market Size and Forecast, By Application, 2022 - 2035 (USD Million & MW)
- 9.1 Key trends
- 9.2 Residential
- 9.3 Commercial & Industrial
- 9.4 Utility
Chapter 10 Market Size and Forecast, By Region, 2022 - 2035 (USD Million & MW)
- 10.1 Key trends
- 10.2 North America
- 10.2.1 U.S.
- 10.2.2 Canada
- 10.2.3 Mexico
- 10.3 Europe
- 10.3.1 Germany
- 10.3.2 France
- 10.3.3 Netherlands
- 10.3.4 Italy
- 10.3.5 Spain
- 10.4 Asia Pacific
- 10.4.1 China
- 10.4.2 Japan
- 10.4.3 South Korea
- 10.4.4 India
- 10.4.5 Australia
- 10.5 Middle East & Africa
- 10.5.1 Saudi Arabia
- 10.5.2 UAE
- 10.5.3 South Africa
- 10.6 Latin America
- 10.6.1 Brazil
- 10.6.2 Chile
Chapter 11 Company Profiles
- 11.1 AIKO Solar
- 11.2 Astronergy
- 11.3 Canadian Solar Inc.
- 11.4 DMEGC Solar
- 11.5 First Solar
- 11.6 Hanwha Q CELLS
- 11.7 Huasun Energy
- 11.8 JinkoSolar Holding
- 11.9 JA Solar Technology
- 11.10 LONGi Green Energy Technology
- 11.11 Maxeon Solar Technologies
- 11.12 REC Group
- 11.13 Risen Energy
- 11.14 Seraphim Energy Group
- 11.15 TCL Solar
- 11.16 Tongwei Solar
- 11.17 Trina Solar
- 11.18 VSUN Solar
- 11.19 Waaree Energies
- 11.20 Yingli Solar


