
|
시장보고서
상품코드
2083094
비파괴 검사 장비 시스템 시장 기회, 성장 촉진요인, 업계 동향 분석 및 예측(2026-2035년)Non-Destructive Testing (NDT) Equipment System Market Opportunity, Growth Drivers, Industry Trend Analysis, and Forecast 2026 - 2035 |
||||||

세계의 비파괴 검사 장비 시장은 2025년에 42억 달러로 평가되었으며, CAGR 8.6%로 성장하여 2035년까지 93억 달러에 달할 것으로 추정됩니다.
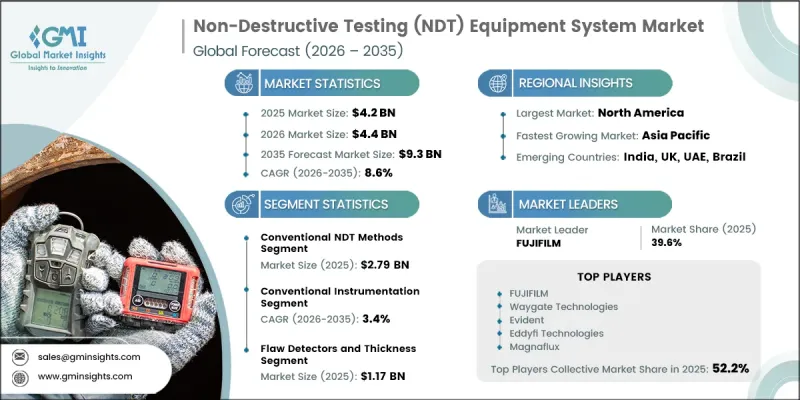
시장 성장을 주도하고 있는 요인은 자산 건전성 관리에 대한 요구 증가, 품질 보증 기준의 강화, 그리고 규제가 엄격한 업계 전반에 걸쳐 신뢰할 수 있는 검사 기술에 대한 수요 확대입니다. 각 조직은 끊임없이 진화하는 안전 및 성능 관련 규정을 준수하는 한편, 중요 인프라의 수명을 연장하는 데 더욱 중점을 두고 있습니다. 그 결과, 비파괴 검사 장비는 산업용 유지보수, 품질 관리 및 위험 관리 프로그램에서 필수적인 요소로 자리 잡고 있습니다. 또한, 이 시장은 검출 정밀도의 향상, 데이터 추적성의 개선, 그리고 예측 유지보수 전략 지원으로 이어지는 첨단 검사 기술의 지속적인 통합으로부터도 혜택을 받고 있습니다. 제조업체와 최종사용자들은 기존의 검사 방법을 대체하기보다는, 정교한 디지털 기능, 자동화 및 데이터 기반 분석 도구를 기존 워크플로우에 통합하는 경향을 점점 더 보이고 있습니다. 고가치이며 기술적으로 정교한 부품에 대한 검사 수요가 증가함에 따라 시장 확대가 더욱 가속화되고 있습니다. 이는 각 업계가 자산을 손상시키지 않으면서 결함이나 구조상의 이상을 파악할 수 있는 솔루션을 찾고 있기 때문입니다. 이러한 장기적인 추세에 따라 전 세계 제조, 에너지, 운송, 항공우주, 인프라 등 각 분야에서 비파괴 검사 장비의 중요성이 더욱 커지고 있습니다.
| 시장 범위 | |
|---|---|
| 시작 연도 | 2025년 |
| 예측 기간 | 2026-2035년 |
| 초기 시장 규모 | 42억 달러 |
| 예측액 | 93억 달러 |
| CAGR | 8.6% |
기존의 비파괴 검사 분야는 2025년에 27억 9,000만 달러의 시장 규모를 기록하며 시장 점유율의 67.4%를 차지했습니다. 이러한 검사 기술은 입증된 신뢰성, 확립된 업계 표준, 그리고 자격을 갖춘 인력의 폭넓은 확보 덕분에 계속해서 널리 채택되고 있습니다. 이 부문의 수요는 정기적인 검사 활동, 예방적 유지보수 프로그램, 자재 검증 프로세스, 그리고 다양한 산업 분야에 걸친 품질 보증 요건에 의해 뒷받침되고 있습니다. 이 부문에는 구조적 건전성 평가, 결함 탐지 및 지속적인 자산 관리 활동을 지원하기 위해 설계된 다양한 검사 장비와 시험 솔루션이 포함됩니다.
기존형 계측 기기 부문은 2025년에 17억 6,000만 달러에 달하며, 42.6%의 시장 점유율을 차지했습니다. 이 부문은 2026년부터 2035년까지 연평균 성장률(CAGR) 3.4%로 성장할 것으로 예상됩니다. 기존 검사 장비는 내구성, 사용 편의성 및 비용 효율성이 여전히 중요한 구매 결정 기준이 되는 산업 분야에서 계속해서 중요한 역할을 수행하고 있습니다. 이러한 기술은 유지보수가 빈번하게 이루어지는 환경에서 널리 활용되고 있으며, 다양한 산업 분야에서 신뢰성 높은 검사 기능을 지속적으로 제공하고 있습니다.
북미의 비파괴 검사 장비 시장은 광범위한 산업 기반, 첨단 제조 활동, 인프라 유지 관리 수요, 그리고 엄격한 품질 보증 기준에 힘입어 2025년에는 14억 6,000만 달러의 시장 규모를 기록하며 35.2%의 점유율을 차지했습니다. 산업 안전, 운영 신뢰성 및 자산 성과 최적화를 위한 지속적인 투자가 해당 지역 전체에서 비파괴 검사 기술의 꾸준한 보급을 뒷받침하고 있습니다.
자주 묻는 질문
목차
제1장 조사 방법과 범위
제2장 주요 요약
제3장 업계 인사이트
제4장 경쟁 구도
제5장 시장 추정 및 예측 : 검사 방법별, 2022-2035년
제6장 시장 추정 및 예측 : 기술별, 2022-2035년
제7장 시장 추정 및 예측 : 장비 유형별, 2022-2035년
제8장 시장 추정 및 예측 : 용도별, 2022-2035년
제9장 시장 추정 및 예측 : 최종 이용 산업별, 2022-2035년
제10장 시장 추정 및 예측 : 지역별, 2022-2035년
제11장 기업 개요
KSM 26.07.16The Global Non-Destructive Testing Equipment Market was valued at USD 4.2 billion in 2025 and is estimated to grow at a CAGR of 8.6% to reach USD 9.3 billion by 2035.
Market growth is driven by increasing requirements for asset integrity management, stricter quality assurance standards, and the growing need for reliable inspection technologies across highly regulated industries. Organizations are placing greater emphasis on extending the operational life of critical infrastructure while maintaining compliance with evolving safety and performance regulations. As a result, non-destructive testing equipment is becoming an essential component of industrial maintenance, quality control, and risk management programs. The market is also benefiting from the ongoing integration of advanced inspection technologies that enhance detection accuracy, improve data traceability, and support predictive maintenance strategies. Rather than replacing established inspection methods, manufacturers and end users are increasingly incorporating sophisticated digital capabilities, automation, and data-driven analysis tools into existing workflows. Growing demand for the inspection of high-value and technologically advanced components is further accelerating market expansion, as industries seek solutions capable of identifying defects and structural irregularities without damaging assets. These long-term trends are reinforcing the importance of non-destructive testing equipment across manufacturing, energy, transportation, aerospace, and infrastructure sectors worldwide.
| Market Scope | |
|---|---|
| Start Year | 2025 |
| Forecast Year | 2026-2035 |
| Start Value | $4.2 Billion |
| Forecast Value | $9.3 Billion |
| CAGR | 8.6% |
The conventional non-destructive testing methods segment generated USD 2.79 billion in 2025, accounting for 67.4% share. These inspection techniques continue to maintain widespread adoption due to their proven reliability, established industry standards, and broad availability of qualified personnel. Demand within this segment is supported by routine inspection activities, preventive maintenance programs, material verification processes, and quality assurance requirements across multiple industrial sectors. The segment includes a wide range of inspection instruments and testing solutions designed to evaluate structural integrity, detect flaws, and support ongoing asset management initiatives.
The conventional instrumentation segment reached USD 1.76 billion in 2025 representing 42.6% share. The segment is expected to grow at a CAGR of 3.4% during 2026-2035. Traditional inspection equipment continues to play an important role in industries where durability, operational familiarity, and cost efficiency remain critical purchasing considerations. These technologies are widely utilized in maintenance-intensive environments and continue to provide dependable inspection capabilities across a variety of industrial applications.
North America Non-Destructive Testing Equipment Market generated USD 1.46 billion in 2025, holding a 35.2% share, owing to its extensive industrial base, advanced manufacturing activities, infrastructure maintenance requirements, and stringent quality assurance standards. Ongoing investments in industrial safety, operational reliability, and asset performance optimization continue to support strong adoption of non-destructive testing technologies throughout the region.
Key companies operating in the global non-destructive testing equipment market include Nikon Metrology, Waygate Technologies, Magnaflux, Evident Scientific, FUJIFILM NDT Systems, Eddyfi Technologies, Shimadzu Corporation, Sonatest, Creaform, and YXLON International. Companies operating in the non-destructive testing equipment market are pursuing a variety of strategic initiatives to strengthen their competitive position and expand their global footprint. Significant investments in research and development remain a primary focus, enabling manufacturers to enhance inspection accuracy, automation capabilities, and digital integration features. Many market participants are developing advanced inspection platforms that support real-time data analysis, predictive maintenance, and improved operational efficiency. Strategic partnerships, acquisitions, and collaborations are also being utilized to broaden product portfolios and increase access to new customer segments. Companies are increasingly investing in software solutions, digital inspection technologies, and connected systems that improve traceability and streamline inspection workflows.
Table of Contents
Chapter 1 Methodology & Scope
- 1.1 Research approach
- 1.2 Quality Commitments
- 1.2.1 GMI AI policy & data integrity commitment
- 1.2.1.1 Source consistency protocol
- 1.2.1 GMI AI policy & data integrity commitment
- 1.3 Research Trail & Confidence Scoring
- 1.3.1 Research Trail Components
- 1.3.2 Scoring Components
- 1.4 Data Collection
- 1.4.1 Partial list of primary sources
- 1.5 Data mining sources
- 1.5.1 Paid sources
- 1.5.1.1 Sources, by region
- 1.5.1 Paid sources
- 1.6 Base estimates and calculations
- 1.6.1 Base year calculation
- 1.7 Forecast
- 1.7.1 Quantified market impact analysis
- 1.7.1.1 Mathematical impact of growth parameters on forecast
- 1.7.1 Quantified market impact analysis
- 1.8 Research transparency addendum
- 1.8.1 Source attribution framework
- 1.8.2 Quality assurance metrics
- 1.8.3 Our commitment to trust
Chapter 2 Executive Summary
- 2.1 Industry 360° synopsis
- 2.2 Key market trends
- 2.2.1 Regional
- 2.2.2 Testing Method
- 2.2.3 Technology
- 2.2.4 Equipment Type
- 2.2.5 Application
- 2.2.6 End-Use Industry
- 2.3 TAM Analysis, 2026-2035
- 2.4 CXO perspectives: Strategic imperatives
Chapter 3 Industry Insights
- 3.1 Industry ecosystem analysis
- 3.1.1 Supplier landscape
- 3.1.1.1 Raw material suppliers
- 3.1.1.2 Component suppliers
- 3.1.1.3 Manufacturers
- 3.1.1.4 Service providers
- 3.1.1.5 Distribution channel
- 3.1.1.6 End Use
- 3.1.2 Cost structure
- 3.1.3 Profit margin
- 3.1.4 Value addition at each stage
- 3.1.5 Vertical integration trends
- 3.1.6 Disruptors
- 3.1.1 Supplier landscape
- 3.2 Industry impact forces
- 3.2.1 Growth drivers
- 3.2.1.1 Stringent safety, quality, and regulatory compliance requirements
- 3.2.1.2 Aging infrastructure requiring inspection and structural integrity assessment
- 3.2.1.3 Growth in aerospace, automotive, energy, and industrial manufacturing activities
- 3.2.1.4 Preventive maintenance, asset reliability, and downtime reduction
- 3.2.2 Industry pitfalls & challenges
- 3.2.2.1 High capital investment required for advanced NDT equipment and automation systems
- 3.2.2.2 Shortage of skilled and certified NDT inspectors and technicians
- 3.2.3 Market opportunities
- 3.2.3.1 AI-powered defect recognition and predictive analytics
- 3.2.3.2 Robotic, drone-based, and autonomous inspection platforms
- 3.2.3.3 Digital asset integrity management and digital twin integration
- 3.2.3.4 Electronics, semiconductor, EV battery, and additive manufacturing inspection
- 3.2.1 Growth drivers
- 3.3 Growth potential analysis
- 3.4 Pricing Analysis (Driven by Primary Research)
- 3.4.1 Historical Price Trend Analysis
- 3.4.2 Pricing Strategy by Player Type (Premium / Value / Cost-plus)
- 3.5 Regulatory landscape
- 3.5.1 North America
- 3.5.1.1 American Society for Nondestructive Testing (ASNT)
- 3.5.1.2 American Petroleum Institute (API)
- 3.5.2 Europe
- 3.5.2.1 European Federation for Non-Destructive Testing (EFNDT)
- 3.5.2.2 European Committee for Standardization (CEN)
- 3.5.3 Asia-Pacific
- 3.5.3.1 Chinese Society for Non-Destructive Testing (ChSNDT)
- 3.5.3.2 Standardization Administration of China (SAC)
- 3.5.4 Latin America
- 3.5.4.1 Brazilian Association for Non-Destructive Testing and Inspection (ABENDI)
- 3.5.4.2 National Institute of Metrology, Standardization and Industrial Quality (INMETRO)
- 3.5.5 Middle East & Africa
- 3.5.5.1 Gulf Standardization Organization (GSO)
- 3.5.5.2 Saudi Standards, Metrology and Quality Organization (SASO)
- 3.5.1 North America
- 3.6 Technology and Innovation landscape
- 3.6.1 Current technologies
- 3.6.2 Emerging technologies
- 3.7 Porter's analysis
- 3.8 PESTEL analysis
- 3.9 Patent analysis (Driven by Primary Research)
- 3.10 Trade data analysis (Driven by Paid Research)
- 3.10.1 Import/export volume & value trends
- 3.10.2 Key trade corridors & tariff impact
- 3.11 Impact of AI & generative AI on the market
- 3.11.1 AI-Driven Disruption of Existing Business Models
- 3.11.2 Automated design optimization
- 3.11.3 Supply chain AI for demand forecasting
- 3.11.4 GenAI use cases & adoption roadmap by segment
- 3.11.5 Risks, Limitations & Regulatory Considerations
- 3.12 Sustainability and environmental aspects
- 3.12.1 Sustainable practices
- 3.12.2 Waste reduction strategies
- 3.12.3 Energy efficiency in production
- 3.12.4 Eco-friendly Initiatives
- 3.12.5 Carbon footprint considerations
- 3.13 Forecast assumptions & scenario analysis (Driven by Primary Research)
- 3.13.1 Base Case - key macro & industry variables driving CAGR
- 3.13.2 Optimistic Scenarios - Favorable Macro and Industry Tailwinds
- 3.13.3 Pessimistic Scenario - Macroeconomic slowdown or industry headwinds
Chapter 4 Competitive Landscape, 2025
- 4.1 Introduction
- 4.2 Company market share analysis
- 4.2.1 North America
- 4.2.2 Europe
- 4.2.3 Asia-Pacific
- 4.2.4 Latin America
- 4.2.5 Middle East & Africa
- 4.3 Competitive positioning matrix
- 4.4 Key developments
- 4.4.1 Mergers & acquisitions
- 4.4.2 Partnerships & collaborations
- 4.4.3 New product launches
- 4.4.4 Expansion plans and funding
- 4.5 Company tier benchmarking
- 4.5.1 Tier classification criteria & qualifying thresholds
- 4.5.2 Tier positioning matrix by revenue, geography & innovation
Chapter 5 Market Estimates & Forecast, By Testing Method, 2022 - 2035 ($Mn, Units)
- 5.1 Key trends
- 5.2 Conventional NDT Methods
- 5.2.1 Ultrasonic Testing (UT)
- 5.2.2 Radiographic Testing (RT)
- 5.2.3 Magnetic Particle Testing (MT)
- 5.2.4 Liquid Penetrant Testing (PT)
- 5.2.5 Eddy Current Testing (ECT)
- 5.2.6 Visual Testing (VT)
- 5.2.7 Others (Leak Testing, Hardness Testing)
- 5.3 Advanced NDT Methods
- 5.3.1 Phased Array Ultrasonic Testing (PAUT)
- 5.3.2 Time-of-Flight Diffraction (TOFD)
- 5.3.3 Total Focusing Method / Full Matrix Capture (TFM/FMC)
- 5.3.4 Digital Radiography (DR) & Computed Tomography (CT)
- 5.3.5 Acoustic Emission Testing (AET)
- 5.3.6 Thermographic / Infrared Testing (IRT)
- 5.3.7 Guided Wave Testing (GWT)
- 5.3.8 Ground Penetrating Radar (GPR)
- 5.3.9 Alternating Current Field Measurement (ACFM)
- 5.3.10 Others (Laser UT, Neutron Radiography, Air-Coupled UT)
Chapter 6 Market Estimates & Forecast, By Technology, 2022 - 2035 ($Mn, Units)
- 6.1 Key trends
- 6.2 Conventional Instrumentation
- 6.3 Digital & Imaging Systems
- 6.4 AI & Machine Learning-Integrated Systems
- 6.5 Robotic & Autonomous Systems
Chapter 7 Market Estimates & Forecast, By Equipment Type, 2022 - 2035 ($Mn, Units)
- 7.1 Key trends
- 7.2 Flaw Detectors & Thickness Gauges
- 7.3 Imaging & Radiography Systems
- 7.4 Probes, Transducers & Accessories
- 7.5 Automated & Robotic Inspection Systems
- 7.6 NDT Software & Data Management Systems
Chapter 8 Market Estimates & Forecast, By Application, 2022 - 2035 ($Mn, Units)
- 8.1 Key trends
- 8.2 Defect Detection
- 8.3 Thickness Measurement
- 8.4 Structural Health Monitoring (SHM)
- 8.5 Quality Assurance & Quality Control (QA/QC)
- 8.6 Preventive Maintenance
Chapter 9 Market Estimates & Forecast, By End-Use Industry, 2022 - 2035 ($Mn, Units)
- 9.1 Key trends
- 9.2 Oil & Gas
- 9.3 Aerospace & Defense
- 9.4 Automotive & Transportation
- 9.5 Power Generation
- 9.6 Manufacturing & Heavy Engineering
- 9.7 Construction & Infrastructure
- 9.8 Electronics & Semiconductor
- 9.9 Others (Mining, Medical Devices, Rail)
Chapter 10 Market Estimates & Forecast, By Region, 2022 - 2035 ($Mn, Units)
- 10.1 North America
- 10.1.1 US
- 10.1.2 Canada
- 10.2 Europe
- 10.2.1 UK
- 10.2.2 Germany
- 10.2.3 France
- 10.2.4 Italy
- 10.2.5 Spain
- 10.2.6 Belgium
- 10.2.7 Netherlands
- 10.2.8 Sweden
- 10.2.9 Russia
- 10.3 Asia Pacific
- 10.3.1 China
- 10.3.2 India
- 10.3.3 Japan
- 10.3.4 Australia
- 10.3.5 Singapore
- 10.3.6 South Korea
- 10.3.7 Vietnam
- 10.3.8 Indonesia
- 10.3.9 Thailand
- 10.4 Latin America
- 10.4.1 Brazil
- 10.4.2 Mexico
- 10.4.3 Argentina
- 10.5 MEA
- 10.5.1 South Africa
- 10.5.2 Saudi Arabia
- 10.5.3 UAE
Chapter 11 Company Profiles
- 11.1 Global Players
- 11.1.1 Evident Scientific
- 11.1.2 Waygate
- 11.1.3 Eddyfi
- 11.1.4 YXLON
- 11.1.5 Creaform
- 11.1.6 Sonatest
- 11.1.7 Nikon Metrology
- 11.1.8 Shimadzu
- 11.1.9 FUJIFILM NDT
- 11.1.10 Magnaflux
- 11.2 Regional Players
- 11.2.1 Institut Dr. Foerster
- 11.2.2 Karl Deutsch
- 11.2.3 ROHMANN
- 11.2.4 DURR NDT
- 11.2.5 Bosello High Technology
- 11.2.6 Imasonic
- 11.2.7 Sonotron
- 11.2.8 Phoenix Inspection
- 11.2.9 Shenzhen Siui Instrument
- 11.2.10 Magnetic Analysis