|
시장보고서
상품코드
2083317
수산양식 모니터링 및 자동화 시스템 시장 비즈니스 기회, 성장요인, 업계 동향 분석 및 예측(2026-2035년)Aquaculture Monitoring and Automation Systems Market Opportunity, Growth Drivers, Industry Trend Analysis, and Forecast 2026 - 2035 |
||||||

세계의 양식 모니터링 및 자동화 시스템 시장은 2025년에 16억 4,000만 달러로 평가되었고, CAGR 9.4%로 성장하여 2035년까지 40억 3,000만 달러에 달할 것으로 추정되고 있습니다.
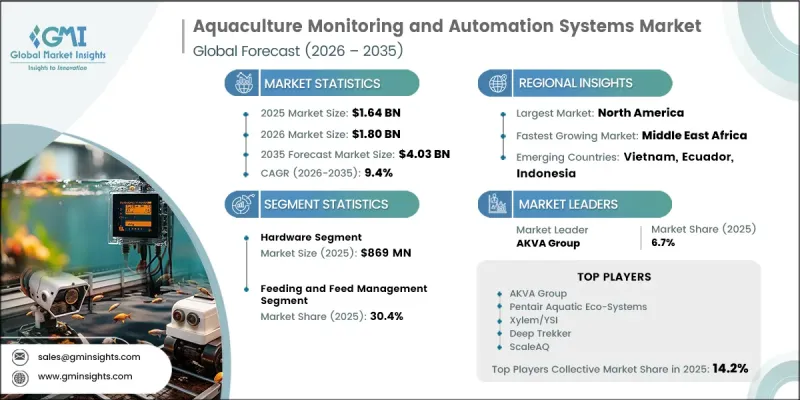
시장 성장을 견인하고 있는 요인은 전 세계 수산물 수급 격차의 확대, 양식 사업에서의 인력 확보 압박 심화, 그리고 센서 기술 및 엣지 컴퓨팅 부품 비용의 지속적인 하락입니다. 이러한 요인들로 인해, 고도로 디지털화된 양식 사업으로의 전환이 가속화되고 있습니다. 현재, AI를 활용한 생물량 추적, 음향을 통한 어류 행동 분석, 구독형 양식장 관리 소프트웨어 등이 시범 운영 단계에서 새우, 틸라피아, 연어 및 RAS(폐쇄형 순환 양식 시스템) 생산 시스템에서의 대규모 상용화로 전환되는 등, 거대한 기술적 변혁이 진행되고 있습니다. 전 세계 천연 어패류의 어획량은 10년 이상 동안 연간 9,000만-9,500만 톤으로 비교적 안정적으로 유지되어 왔으며, 이로 인해 공급의 추가 확대가 제한되면서 수산물의 성장에 있어 양식에 대한 의존도가 높아지고 있습니다. 이러한 구조적 제약으로 인해, 생산성 향상, 자원 활용 최적화, 그리고 전 세계적 규모로 확장 가능한 양식 생산을 뒷받침하기 위한 첨단 모니터링 및 자동화 시스템의 필요성이 더욱 커지고 있습니다.
| 시장 범위 | |
|---|---|
| 개시 연도 | 2025년 |
| 예측 기간 | 2026-2035년 |
| 초기 시장 규모 | 16억 4,000만 달러 |
| 예측액 | 40억 3,000만 달러 |
| CAGR | 9.4% |
하드웨어 부문은 2025년에 8억 6,900만 달러의 매출을 기록하며 시장 점유율의 53%를 차지했습니다. 이러한 압도적인 시장 점유율은 생산 방식이나 양식 종을 불문하고, 모든 상업 양식 사업에서 수질 센서와 모니터링 장비가 필수적인 인프라로 널리 도입되고 있음을 반영하고 있습니다.
사료 공급 및 관리 시스템 부문은 2025년에 4억 9,200만 달러 시장 규모를 기록하며 30.4%의 점유율을 차지해, 계속해서 주요 시스템 유형 카테고리로서의 위상을 유지했습니다. 이러한 확고한 입지는 사료 효율이 양식 생산의 사업 수익성에 직접적인 영향을 미치기 때문입니다. 상업적 양식 사업 전반에 걸쳐 사료 전환율 향상, 폐기물 감축 및 전반적인 생산 효율 제고를 위해 첨단 자동 급이 기술과 AI를 활용한 최적화 시스템이 점점 더 널리 활용되고 있습니다.
북미 수산 양식 모니터링 및 자동화 시스템 시장은 2025년에 19%의 점유율(3억 1,200만 달러 상당)을 차지했으며, 미국이 주요 성장 동력으로 작용하는 반면, 캐나다는 보다 확고하고 안정적인 시장 기반을 형성하고 있습니다. 이 지역의 성장은 육상형 RAS(순환식 양식 시스템) 시설의 확대와 수산 양식 개발 이니셔티브에 대한 제도적 지원 강화에 힘입어 이루어지고 있습니다. 현대적인 수산 양식 인프라에 대한 투자와 지속 가능한 수산물 생산에 대한 규제 측면의 지원이 계속해서 해당 지역 시장 확대를 뒷받침하고 있습니다.
자주 묻는 질문
목차
제1장 조사 방법과 범위
제2장 주요 요약
제3장 업계 인사이트
제4장 경쟁 구도
제5장 시장 추산 및 예측 : 제공별, 2022년-2035년
제6장 시장 추산 및 예측 : 시스템 유형별, 2022년-2035년
제7장 시장 추산 및 예측 : 농장 유형별, 2022년-2035년
제8장 시장 추산 및 예측 : 유형별, 2022년-2035년
제9장 시장 추산 및 예측 : 최종사용자별, 2022년-2035년
제10장 시장 추산 및 예측 : 지역별, 2022년-2035년
제11장 기업 개요
LSH 26.07.14The Global Aquaculture Monitoring and Automation Systems Market was valued at USD 1.64 billion in 2025 and is estimated to grow at a CAGR of 9.4% to reach USD 4.03 billion by 2035.
Market growth is driven by a widening global seafood supply-demand gap, increasing pressure on labor availability in aquaculture operations, and continuous reductions in the cost of sensor technologies and edge computing components. These factors are accelerating the shift toward highly digitized aquaculture operations. A major technological transformation is underway, where AI-powered biomass tracking, acoustic fish behavior analysis, and subscription-based farm management software are moving from pilot programs into large-scale commercial deployment across shrimp, tilapia, salmon, and RAS production systems. Global capture fisheries output has remained relatively stable at 90 to 95 million tonnes annually for more than a decade, limiting further supply expansion and increasing reliance on aquaculture as the primary source of seafood growth. This structural constraint is reinforcing the need for advanced monitoring and automation systems to improve productivity, optimize resource use, and support scalable aquaculture production worldwide.
| Market Scope | |
|---|---|
| Start Year | 2025 |
| Forecast Year | 2026-2035 |
| Start Value | $1.64 Billion |
| Forecast Value | $4.03 Billion |
| CAGR | 9.4% |
The hardware segment generated USD 869 million in 2025, accounting for 53% share. This dominance reflects the widespread deployment of water quality sensors and monitoring instruments as essential infrastructure across all commercial aquaculture operations, regardless of production method or species type.
The feeding and feed management systems segment was valued at USD 492 million in 2025, representing 30.4% share, and remained the leading system-type category. Its strong position is driven by the direct impact of feed efficiency on operational profitability in aquaculture production. Advanced automated feeding technologies and AI-enabled optimization systems are increasingly being used to improve feed conversion ratios, reduce waste, and enhance overall production efficiency across commercial fish farming operations.
North America Aquaculture Monitoring and Automation Systems Market accounted for 19% share in 2025, equivalent to USD 312 million, with the United States serving as the primary growth driver and Canada representing a more established and steady market base. Growth in the region is supported by the expansion of land-based RAS facilities and increasing institutional support for aquaculture development initiatives. Investments in modern aquaculture infrastructure and regulatory support for sustainable seafood production continue to strengthen regional market expansion.
Major companies operating in the global aquaculture monitoring and automation systems market include AKVA Group, Pentair Aquatic Eco-Systems, Xylem/YSI, ScaleAQ, Innovasea Systems, Deep Trekker, Aquabyte, CageEye AS, In-Situ Inc., Manolin, and ReelData. Companies operating in the aquaculture monitoring and automation systems market are strengthening their market position by investing in AI-driven analytics, IoT-enabled sensor technologies, and integrated farm management platforms. Market players are focusing on developing real-time monitoring solutions that improve water quality control, optimize feeding efficiency, and enhance fish health management. Strategic collaborations with aquaculture farms, research institutions, and technology providers are supporting faster commercialization and wider adoption of advanced systems. Businesses are also expanding cloud-based service offerings, subscription models, and remote monitoring capabilities to improve scalability and recurring revenue streams.
Table of Contents
Chapter 1 Methodology & Scope
- 1.1 Research approach
- 1.2 Quality Commitments
- 1.2.1 GMI AI policy & data integrity commitment
- 1.2.1.1 Source consistency protocol
- 1.2.1 GMI AI policy & data integrity commitment
- 1.3 Research Trail & Confidence Scoring
- 1.3.1 Research Trail Components
- 1.3.2 Scoring Components
- 1.4 Data Collection
- 1.4.1 Partial list of primary sources
- 1.5 Data mining sources
- 1.5.1 Paid sources
- 1.5.1.1 Sources, by region
- 1.5.1 Paid sources
- 1.6 Base estimates and calculations
- 1.6.1 Base year calculation for any one approach
- 1.7 Forecast model
- 1.7.1 Quantified market impact analysis
- 1.7.1.1 Mathematical impact of growth parameters on forecast
- 1.7.1 Quantified market impact analysis
- 1.8 Research transparency addendum
- 1.8.1 Source attribution framework
- 1.8.2 Quality assurance metrics
- 1.8.2.1 Our commitment to trust
Chapter 2 Executive Summary
- 2.1 Industry 360° synopsis, 2022 - 2035
- 2.2 Key market trends
- 2.2.1 By Region
- 2.2.2 By Offering
- 2.2.3 By System Type
- 2.2.4 By Farm Type
- 2.2.5 By Species
- 2.2.6 By End-user
Chapter 3 Industry Insights
- 3.1 Industry ecosystem analysis
- 3.2 Supply chain analysis
- 3.2.1 Component Sourcing & Supplier Landscape
- 3.2.2 Distribution Channels & System Integrators
- 3.2.3 Supply Chain Vulnerabilities & Risk Mitigation
- 3.3 Industry impact forces
- 3.3.1 Market drivers
- 3.3.1.1 Rising Global Seafood Demand & Widening Supply-Demand Gap
- 3.3.1.2 Labor Scarcity & Rising Operational Costs Accelerating Automation Adoption
- 3.3.1.3 Increasing Regulatory Pressure for Environmental Compliance, Traceability & Sustainability Certification
- 3.3.1.4 Rapid Technological Advancements in IoT, AI, & Edge Computing Reducing System Costs
- 3.3.2 Market restraints
- 3.3.2.1 High Upfront Capital Investment for Sensor Infrastructure & Automation Systems
- 3.3.2.2 Sensor Durability & Corrosion Challenges in Harsh Marine & Saline Environments
- 3.3.2.3 Limited Technical Expertise & Skilled Workforce Availability in Developing Aquaculture Regions
- 3.3.3 Market opportunities
- 3.3.3.1 Rapid Global Expansion of Recirculating Aquaculture Systems (RAS) Creating New Demand
- 3.3.3.2 Integration of AI/ML for Predictive Disease Detection & Real-Time Biomass Optimization
- 3.3.3.3 Untapped Automation Potential in Shrimp & Shellfish Farming Across Asia Pacific & Latin America
- 3.3.3.4 Emergence of Aquaculture-as-a-Service & Subscription-Based Monitoring Platform Models
- 3.3.1 Market drivers
- 3.4 Growth potential analysis
- 3.5 Technology & innovation landscape
- 3.5.1 IoT & Multi-Parameter Sensor Technologies
- 3.5.2 AI & Machine Vision in Aquaculture Monitoring
- 3.5.3 Edge Computing & Connectivity (LoRaWAN, 5G, Satellite)
- 3.5.4 Underwater ROV & Autonomous Drone Technologies
- 3.5.5 Digital Twin & Simulation Technologies for Aquaculture
- 3.6 Regulatory framework
- 3.6.1 Global Aquaculture Sustainability Standards (ASC, BAP, GlobalG.A.P.)
- 3.6.2 Food Safety & Traceability Regulations by Region
- 3.6.3 Environmental Compliance, Discharge Monitoring & Effluent Standards
- 3.6.4 Data Privacy & Cybersecurity Regulations Affecting IoT Systems
- 3.7 Major market trends and disruptions
- 3.8 Future market trends
- 3.9 Pricing analysis (driven by primary research)
- 3.9.1 Historical Price Trend Analysis (Driven by Primary Research)
- 3.9.2 Pricing Strategy by Player Type (Premium / Value / Cost-plus) (Driven by Primary Research)
- 3.10 Trade data analysis (driven by primary research)
- 3.10.1 Import/Export Volume & Value Trends - Aquaculture Sensors & Control Equipment (Driven by Primary Research)
- 3.10.2 Key Trade Corridors & Tariff Impact on System Costs (Driven by Primary Research)
- 3.11 Impact of AI & generative AI on the market
- 3.11.1 AI-Driven Disruption of Existing Business Models (Manual Monitoring - Autonomous Systems)
- 3.11.2 GenAI Use Cases & Adoption Roadmap by Segment (Feed Optimization, Disease Prediction, Biomass Estimation)
- 3.11.3 Risks, Limitations & Regulatory Considerations for AI-Driven Aquaculture Systems
- 3.12 Capacity & production landscape (driven by primary research)
- 3.12.1 Installed Capacity by Region & Key Producer (RAS Facilities, Cage Farm Networks, Pond Farm Density) (Driven by Primary Research)
- 3.12.2 Capacity Utilization Rates & Expansion Pipelines (Planned RAS Builds, Smart Farm Conversion Projects) (Driven by Primary Research)
- 3.13 Investment & funding analysis
- 3.13.1 Venture Capital & Private Equity Investments in Aquaculture Tech
- 3.13.2 Government Grants, Subsidies & Innovation Programs (EU, FAO, NOAA)
- 3.13.3 Corporate R&D Spending Trends by Player Tier
- 3.14 Porter’s analysis
- 3.15 PESTEL analysis
Chapter 4 Competitive Landscape, 2025
- 4.1 Introduction
- 4.2 Company market share analysis
- 4.2.1 By Region
- 4.2.1.1 North America
- 4.2.1.2 Europe
- 4.2.1.3 Asia Pacific
- 4.2.1.4 Latin America
- 4.2.1.5 Middle East and Africa
- 4.2.1 By Region
- 4.3 Company matrix analysis
- 4.4 Competitive analysis of major market players
- 4.5 Competitive positioning matrix
- 4.6 Key developments
- 4.6.1 Mergers & acquisitions
- 4.6.2 Partnerships & collaborations
- 4.6.3 New product launches
- 4.6.4 Expansion plans
Chapter 5 Market Estimates and Forecast, By Offering, 2022 - 2035 (USD Billion) (Thousand Units)
- 5.1 Key trends
- 5.2 Hardware
- 5.2.1 Multi-Parameter & Single-Parameter Sensors (DO, pH, Salinity, Temperature, Turbidity, Ammonia)
- 5.2.2 Underwater Cameras & Computer Vision Devices
- 5.2.3 Remotely Operated Vehicles (ROVs) & Autonomous Underwater Vehicles (AUVs)
- 5.2.4 Control Units, PLCs, RTUs & Actuators
- 5.2.5 Automated Feeding Dispensers & Delivery Devices
- 5.3 Software
- 5.3.1 Cloud-Based Farm Management Platforms
- 5.3.2 AI & Predictive Analytics Software
- 5.3.3 Real-Time Monitoring Dashboards & SCADA Systems
- 5.3.4 Mobile Applications & Remote Control Interfaces
- 5.4 Services
- 5.4.1 System Integration & Installation Services
- 5.4.2 Maintenance, Calibration & Support Services
- 5.4.3 Consulting, Training & Managed Farm Services
Chapter 6 Market Estimates and Forecast, By System Type, 2022 - 2035 (USD Billion) (Thousand Units)
- 6.1 Key trends
- 6.2 Water Quality Monitoring Systems
- 6.2.1 Dissolved Oxygen Monitoring Systems
- 6.2.2 pH & Temperature Monitoring Systems
- 6.2.3 Salinity, Turbidity, Ammonia & Multi-Parameter Combined Systems
- 6.3 Feeding & Feed Management Systems
- 6.3.1 Automated Pellet Dispensers & Pneumatic Feeding Systems
- 6.3.2 AI-Driven Feed Optimization & Waste Minimization Systems
- 6.3.3 Appetite Detection & Camera-Based Feeding Control Systems
- 6.4 Fish Behavior & Biomass Monitoring Systems
- 6.4.1 Computer Vision & Image Processing Systems
- 6.4.2 Acoustic, Sonar & Hydrophone-Based Monitoring Systems
- 6.4.3 AI-Powered Disease Detection, Stress Identification & Early Warning Systems
- 6.5 Environmental Control & Automation Systems
- 6.5.1 Aeration & Oxygenation Control Systems
- 6.5.2 Water Circulation, Filtration & Treatment Automation Systems
- 6.5.3 Lighting, Temperature & Climate Automation Systems
- 6.6 Others
- 6.6.1 Harvest Automation & Grading/Sorting Systems
- 6.6.2 Waste Management & Effluent Monitoring Systems
- 6.6.3 Traceability, Compliance Tracking & Digital Logbook Systems
Chapter 7 Market Estimates and Forecast, By Farm Type, 2022 - 2035 (USD Billion) (Thousand Units)
- 7.1 Key trends
- 7.2 Cage Aquaculture
- 7.2.1 Offshore Marine Cage Systems (Open-Sea Net Pens)
- 7.2.2 Inland Lake & Reservoir Cage Systems
- 7.3 Pond Aquaculture
- 7.3.1 Earthen Pond Systems
- 7.3.2 Lined Pond & Biofloc Technology (BFT) Systems
- 7.4 Recirculating Aquaculture Systems (RAS)
- 7.4.1 Freshwater RAS
- 7.4.2 Marine/Saltwater RAS
- 7.5 Others
- 7.5.1 Raceway & Flow-Through Systems
- 7.5.2 Shellfish Long-Lines & Integrated Multi-Trophic Aquaculture (IMTA) Systems
Chapter 8 Market Estimates and Forecast, By Species, 2022 - 2035 (USD Billion) (Thousand Units)
- 8.1 Key trends
- 8.2 Finfish Farming
- 8.2.1 Salmonids (Atlantic Salmon, Trout, Arctic Char)
- 8.2.2 Tilapia & Catfish
- 8.2.3 Sea Bass, Sea Bream & Mediterranean Species
- 8.2.4 Other Finfish (Carp, Tuna, Yellowtail)
- 8.3 Shrimp & Crustacean Farming
- 8.3.1 White Leg Shrimp (Litopenaeus vannamei)
- 8.3.2 Black Tiger Shrimp & Freshwater Prawns
- 8.3.3 Crab & Other Crustaceans
- 8.4 Shellfish & Mollusks Farming
- 8.4.1 Oysters & Mussels
- 8.4.2 Clams, Scallops & Other Bivalves
- 8.5 Seaweed & Aquatic Plants
- 8.5.1 Kelp & Brown Algae
- 8.5.2 Red Algae & Carrageenan-Producing Species
- 8.6 Others (Ornamental Fish, Alligators, Specialty Species)
Chapter 9 Market Estimates and Forecast, By End-user, 2022 - 2035 (USD Billion) (Thousand Units)
- 9.1 Key trends
- 9.2 Commercial Aquaculture Farms
- 9.2.1 Small & Medium-Sized Farms
- 9.2.2 Large-Scale Commercial & Corporate-Owned Operations
- 9.3 Research & Academic Institutions
- 9.4 Others (Government Bodies, Hatcheries & Aquaculture Cooperatives)
Chapter 10 Market Estimates & Forecast, By Region, 2022 - 2035, (USD Billion) (Thousand Units)
- 10.1 Key trends
- 10.2 North America
- 10.2.1 U.S.
- 10.2.2 Canada
- 10.3 Europe
- 10.3.1 Germany
- 10.3.2 U.K.
- 10.3.3 France
- 10.3.4 Italy
- 10.3.5 Spain
- 10.4 Asia Pacific
- 10.4.1 China
- 10.4.2 India
- 10.4.3 Japan
- 10.4.4 South Korea
- 10.4.5 Australia
- 10.5 Latin America
- 10.5.1 Brazil
- 10.5.2 Mexico
- 10.5.3 Argentina
- 10.6 MEA
- 10.6.1 UAE
- 10.6.2 Saudi Arabia
- 10.6.3 South Africa
Chapter 11 Company Profiles
- 11.1 AKVA Group
- 11.2 Innovasea Systems Inc.
- 11.3 ScaleAQ
- 11.4 Deep Trekker Inc.
- 11.5 Aquabyte
- 11.6 Signify Holding N.V.
- 11.7 ReelData AI
- 11.8 XpertSea (Kampi)
- 11.9 CageEye AS
- 11.10 Bluegrove AS
- 11.11 BioSort AS
- 11.12 In-Situ Inc.
- 11.13 SeaRAS AS
- 11.14 Skretting - Nutreco
- 11.15 Cathx Ocean
- 11.16 Tidal (TidalX AI Inc.)
- 11.17 AQ1 Systems Pty Ltd
- 11.18 Manolin Inc.
- 11.19 YSI, a Xylem brand (Xylem Inc.)
- 11.20 Aqualytics AS
- 11.21 Dynamic FishEye (a brand of Dynamic AS)
- 11.22 Pentair Aquatic Eco-Systems (Pentair Inc.)