
|
시장보고서
상품코드
2083334
유압 필터 시장 비즈니스 기회, 성장요인, 업계 동향 분석 및 예측(2026-2035년)Hydraulic Filters Market Opportunity, Growth Drivers, Industry Trend Analysis, and Forecast 2026 - 2035 |
||||||

세계의 유압 필터 시장은 2025년에 24억 달러로 평가되었고, CAGR 5.2%로 성장하여 2035년까지 40억 달러에 달할 것으로 추정되고 있습니다.
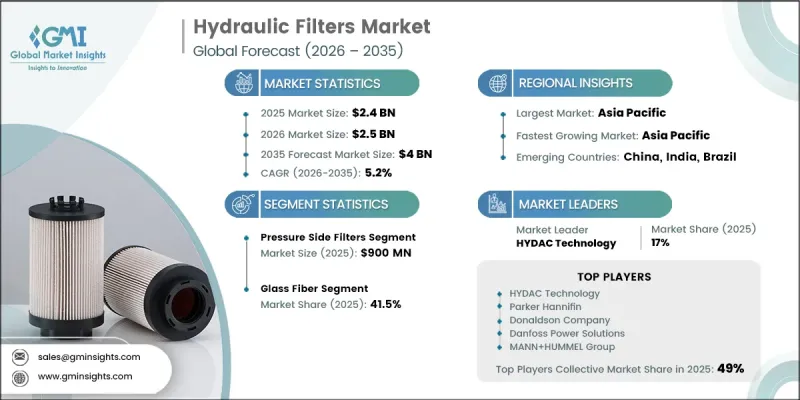
각 업계에서 설비의 신뢰성, 운영 효율성 및 장기적인 자산 보호를 더욱 중요시함에 따라, 유압 필터 시장은 꾸준히 성장하고 있습니다. 유압 여과 시스템은 유체의 청정도를 유지하는 데 있어 매우 중요한 역할을 하며, 다양한 산업 분야에서 부품의 마모를 줄이고, 기계의 수명을 연장하며, 예기치 못한 가동 중지 시간을 최소화하는 데 기여하고 있습니다. 산업 자동화와 중장비 사용이 지속적으로 확대되는 가운데, 기업들은 유지보수 비용을 절감하면서도 끊김 없는 성능을 뒷받침하는 신뢰성 높은 여과 솔루션에 대한 투자를 점점 더 늘리고 있습니다. 이에 대해 각 제조업체들은 내구성 향상, 다양한 기기와의 호환성, 그리고 설치 및 유지보수의 간소화를 실현한 필터 개발에 힘쓰고 있습니다. 또한, 예방 정비 전략에 대한 인식이 높아지면서 시장이 활성화되고 있으며, 시스템 효율을 극대화하고 수리 비용을 최소화하기 위해서는 깨끗한 작동유가 필수적이라는 점이 인식되고 있습니다. 유압 필터는 더 이상 선택 사양이 아닌, 고가 장비를 보호하기 위한 표준 요건이 되었으며, 이로 인해 선진국과 신흥국의 산업 경제권을 막론하고 안정적인 교체 수요가 발생하여 시장의 꾸준한 성장을 뒷받침하고 있습니다.
| 시장 범위 | |
|---|---|
| 개시 연도 | 2025년 |
| 예측 기간 | 2026-2035년 |
| 초기 시장 규모 | 24억 달러 |
| 예측액 | 40억 달러 |
| CAGR | 5.2% |
2025년, 압력 라인 필터 시장 규모는 9억 달러에 달했습니다. 이러한 확고한 시장 입지는 높은 작동 압력 하에서도 유체의 청정도를 유지하면서 중요한 유압 부품을 오염으로부터 보호하는 능력에 기반을 두고 있습니다. 각 업계에서 고액의 수리보다 예방 정비가 점점 더 중요시되는 가운데, 압력 라인 필터는 장비의 신뢰성 높은 성능을 유지하고 가동 중단을 최소화하며 유지보수 비용을 절감하는 데 도움이 되기 때문에 계속해서 지지를 얻고 있습니다. 가혹한 작동 조건에서도 지속적인 보호 기능을 제공하는 이 제품의 능력은 산업용 분야 전반에 걸쳐 이 제품의 광범위한 채택을 더욱 촉진하고 있습니다.
2025년, 유리섬유 부문은 41.5%의 점유율을 차지하며 여과 매체 중 가장 높은 점유율을 기록했습니다. 유리섬유는 여과 효율, 내구성, 그리고 비용 효율성을 효과적으로 겸비하고 있어 여전히 선호되는 소재입니다. 극히 미세한 오염 물질을 포집하면서도 유압 유체의 원활한 흐름을 유지하는 이 능력은 불필요한 압력 손실을 일으키지 않으면서 시스템 전체의 성능 향상에 기여합니다. 이러한 신뢰성과 운영 효율성의 균형 덕분에 설비 소유자는 기계 가동 중단 시간을 줄이고, 생산성을 높이며, 장기적인 유지보수 비용을 절감할 수 있게 되어, 해당 부문 시장에서 지속적인 리더십을 유지하고 있습니다.
미국의 유압 필터 시장은 89.9%의 점유율을 차지했으며, 2025년에는 5억 8,330만 달러 시장 규모를 기록했습니다. 지역 시장의 성장은 확립된 산업 부문과 제조, 건설, 농업 및 기타 중공업 분야에서 첨단 유압 기계가 광범위하게 활용되고 있는 데 힘입고 있습니다. 북미 전역의 기업들은 설비의 수명, 작업장의 안전성 및 운영 효율성을 지속적으로 최우선으로 삼고 있으며, 이에 따라 고성능 여과 시스템에 대한 지속적인 투자를 촉진하고 있습니다. 예방 유지보수 활동은 여전히 산업 운영에 깊이 뿌리내리고 있으며, 유압 필터는 귀중한 설비를 보호하고 생산성을 끊임없이 유지하기 위한 필수적인 구성 요소로 자리 잡고 있습니다.
유압 필터 시장에서 사업을 전개하는 각 기업은 오염 물질 제거 효율, 내구성 및 최신 유압 시스템과의 호환성을 향상시키는 첨단 여과 기술을 제품 포트폴리오에 도입함으로써 시장 내 입지를 강화하고 있습니다. 각 제조업체는 연구 개발에 투자하여 수명이 더 긴 필터 매체, 고성능 소재, 그리고 가혹한 산업 환경에 맞추어 설계된 제품의 도입을 추진하고 있습니다. OEM(원청 브랜드 제조업체)과의 전략적 제휴, 세계 유통 네트워크의 확대, 사후 서비스 체계의 강화는 여전히 중요한 우선 과제로 남아 있습니다. 또한, 많은 기업들은 특정 산업용도에 맞춘 맞춤형 여과 솔루션에 주력하는 한편, 비용 경쟁력을 유지하기 위해 제조 효율성 향상에도 힘쓰고 있습니다. 또한, 기업은 고객 지원, 예방 정비 프로그램, 기술 컨설팅 서비스의 확충에 지속적으로 힘쓰며, 장기적인 관계를 구축하고 교체용 부품 매출을 확대하는 한편, 성숙 시장과 신흥 지역 양쪽 모두에서 경쟁력을 강화하고 있습니다.
자주 묻는 질문
목차
제1장 조사 방법
제2장 주요 요약
제3장 업계 인사이트
제4장 경쟁 구도
제5장 시장 추산 및 예측 : 필터 유형별, 2022년-2035년
제6장 시장 추산 및 예측 : 필터 매체별, 2022년-2035년
제7장 시장 추산 및 예측 : 용도별, 2022년-2035년
제8장 시장 추산 및 예측 : 유통 채널별, 2022년-2035년
제9장 시장 추산 및 예측 : 지역별, 2022년-2035년
제10장 기업 개요
LSH 26.07.14The Global Hydraulic Filters Market was valued at USD 2.4 billion in 2025 and is estimated to grow at a CAGR of 5.2% to reach USD 4 billion by 2035.
The hydraulic filters market continues to expand steadily as industries place greater emphasis on equipment reliability, operational efficiency, and long-term asset protection. Hydraulic filtration systems play a critical role in maintaining fluid cleanliness, helping reduce component wear, extend machinery lifespan, and minimize unexpected downtime across a broad range of industrial applications. As industrial automation and heavy equipment usage continue to rise, organizations are increasingly investing in dependable filtration solutions that support uninterrupted performance while lowering maintenance costs. Manufacturers are responding by developing filters with enhanced durability, broader equipment compatibility, and simplified installation and servicing features. The market is also benefiting from growing awareness of preventive maintenance strategies, where clean hydraulic fluid is recognized as essential for maximizing system efficiency and minimizing repair expenses. Rather than being viewed as optional components, hydraulic filters have become a standard requirement for protecting high-value equipment, creating consistent replacement demand and supporting stable market growth across both developed and emerging industrial economies.
| Market Scope | |
|---|---|
| Start Year | 2025 |
| Forecast Year | 2026-2035 |
| Start Value | $2.4 Billion |
| Forecast Value | $4 Billion |
| CAGR | 5.2% |
The pressure side filters generated USD 900 million in 2025. Their strong market position is supported by their ability to maintain fluid cleanliness under high operating pressures while protecting critical hydraulic components from contamination. As industries increasingly prioritize preventive maintenance over costly repairs, pressure side filters continue to gain preference because they help sustain reliable equipment performance, minimize operational interruptions, and reduce maintenance expenses. Their capability to provide continuous protection during demanding operating conditions further reinforces their widespread adoption across industrial applications.
The glass fiber segment accounted for 41.5% share in 2025, representing the largest share among filtration media. Glass fiber remains the preferred material because it delivers an effective combination of filtration efficiency, durability, and cost-effectiveness. Its ability to capture extremely fine contaminants while maintaining smooth hydraulic fluid flow helps improve overall system performance without creating unnecessary pressure loss. This balance of reliability and operational efficiency enables equipment owners to reduce machine downtime, improve productivity, and lower long-term maintenance costs, supporting the segment's continued market leadership.
U.S. Hydraulic Filters Market held an 89.9% share, generating USD 583.3 million in 2025. Regional market growth is supported by a well-established industrial sector and extensive utilization of advanced hydraulic machinery across manufacturing, construction, agriculture, and other heavy industries. Businesses throughout North America continue to prioritize equipment longevity, workplace safety, and operational efficiency, driving consistent investment in high-performance filtration systems. Preventive maintenance practices remain deeply integrated into industrial operations, making hydraulic filters an essential component for protecting valuable equipment and maintaining uninterrupted productivity.
Companies operating in the hydraulic filters market are strengthening their market position by expanding product portfolios with advanced filtration technologies that improve contaminant removal efficiency, durability, and compatibility with modern hydraulic systems. Manufacturers are investing in research and development to introduce longer-lasting filter media, high-performance materials, and products designed for demanding industrial environments. Strategic partnerships with original equipment manufacturers (OEMs), expansion of global distribution networks, and strengthening aftermarket service capabilities remain key priorities. Many companies are also focusing on customized filtration solutions for specific industrial applications while improving manufacturing efficiency to remain cost-competitive. In addition, businesses continue to enhance customer support, preventive maintenance programs, and technical consulting services to build long-term relationships, increase replacement sales, and strengthen their competitive presence across both mature and emerging regional markets.
Table of Contents
Chapter 1 Methodology
- 1.1 Research approach
- 1.2 Quality Commitments
- 1.2.1 GMI AI policy & data integrity commitment
- 1.2.1.1 Source consistency protocol
- 1.2.1 GMI AI policy & data integrity commitment
- 1.3 Research Trail & Confidence Scoring
- 1.3.1 Research Trail Components
- 1.3.2 Scoring Components
- 1.4 Data Collection
- 1.4.1 Partial list of primary sources
- 1.5 Data mining sources
- 1.5.1 Paid sources
- 1.5.1.1 Sources, by region
- 1.5.1 Paid sources
- 1.6 Base estimates and calculations
- 1.6.1 Base year calculation for any one approach
- 1.7 Forecast model
- 1.7.1 Quantified market impact analysis
- 1.7.1.1 Mathematical impact of growth parameters on forecast
- 1.7.1 Quantified market impact analysis
- 1.8 Research transparency addendum
- 1.8.1 Source attribution framework
- 1.8.2 Quality assurance metrics
- 1.8.3 Our commitment to trust
Chapter 2 Executive Summary
- 2.1 Industry snapshot
- 2.2 Business trends
- 2.3 Filter type trends
- 2.4 Filter medium trends
- 2.5 Application trends
- 2.6 Distribution channel trends
- 2.7 Regional trends
Chapter 3 Industry Insights
- 3.1 Industry ecosystem and value chain analysis
- 3.1.1 Industry ecosystem/value chain analysis
- 3.1.2 Raw material suppliers
- 3.1.3 Component manufacturers
- 3.1.4 OEM integrators & system assemblers
- 3.1.5 Distributors & MRO channel
- 3.1.6 End-use industries
- 3.2 Industry impact forces
- 3.2.1 Market Driver
- 3.2.2 Market challenges/pitfalls
- 3.2.3 Market opportunities
- 3.3 Growth potential analysis
- 3.4 Industry ecosystem analysis
- 3.5 Regulatory framework
- 3.5.1 U.S. (EPA, OSHA, ISO 16889 standards)
- 3.5.2 Europe (EU machinery directive, CE marking, ATEX)
- 3.5.3 Asia Pacific (China GB standards, Japan JIS)
- 3.5.4 Cross-border trade & tariff regulations
- 3.6 Pricing analysis (driven by primary research)
- 3.6.1 Historical price trend analysis (2018-2024) (driven by primary research)
- 3.6.2 Pricing strategy by player type (premium/value/cost-plus) (driven by primary research)
- 3.7 Technology and innovation landscape
- 3.7.1 Emerging filter media technologies
- 3.7.2 Smart & condition-monitoring enabled filters
- 3.7.3 High-pressure & high-efficiency filtration innovations
- 3.8 Porter’s Analysis
- 3.9 PESTEL Analysis
- 3.10 Trade data analysis (driven by primary research)
- 3.10.1 Import/export volume & value trends (HS code 8421.39)
- 3.10.2 Key trade corridors & tariff impact
- 3.11 Impact of AI and generative AI on the market
- 3.11.1 AI-driven disruption of existing business models (predictive maintenance, fluid condition monitoring)
- 3.11.2 GenAI use cases & adoption roadmap by segment (smart filter design, digital twin integration)
- 3.11.3 Risks, limitations & regulatory considerations
- 3.12 Capacity and production landscape (driven by primary research)
- 3.12.1 Installed capacity by region & key producer (driven by primary research)
- 3.12.2 Capacity utilization rates & expansion pipelines (driven by primary research)
Chapter 4 Competitive Landscape, 2025
- 4.1 Introduction
- 4.2 Company market share analysis
- 4.2.1 North America
- 4.2.2 Europe
- 4.2.3 APAC
- 4.2.4 LATAM
- 4.2.5 MEA
- 4.3 Company matrix analysis
- 4.4 Competitive analysis of major market players
- 4.5 Competitive positioning matrix
- 4.6 Key developments
- 4.6.1 Mergers & acquisitions
- 4.6.2 Partnerships & collaborations
- 4.6.3 New product launches
- 4.6.4 Expansion plans
Chapter 5 Market Estimates and Forecast, By Filter Type, 2022 - 2035 ($ Billion) (Thousand Units)
- 5.1 Key trends
- 5.2 Pressure side filters
- 5.2.1 High-pressure filters (>200 bar)
- 5.2.2 Medium-pressure filters (70-200 bar)
- 5.2.3 Low-pressure filters (<70 bar)
- 5.3 Return side filters
- 5.3.1 Tank-top mounted return filters
- 5.3.2 In-line return filters
- 5.4 Suction side filters (strainers)
- 5.4.1 Fixed suction strainers
- 5.4.2 Cleanable suction strainers
- 5.5 Off-line filters (kidney loop)
- 5.5.1 Portable off-line filtration units
- 5.5.2 Permanent bypass loop filters
- 5.6 In-tank breather filters
- 5.6.1 Standard breather filters
- 5.6.2 Desiccant breather filters
Chapter 6 Market Estimates and Forecast, By Filter Medium, 2022 - 2035 ($ Billion) (Thousand Units)
- 6.1 Key trends
- 6.2 Glass fiber
- 6.2.1 Borosilicate glass fiber
- 6.2.2 Micro glass fiber (high efficiency)
- 6.3 Cellulose
- 6.3.1 Standard cellulose
- 6.3.2 High-alpha cellulose (refined)
- 6.4 Blended & composite media
- 6.4.1 Cellulose-synthetic blend
- 6.4.2 Multi-layer composite media
- 6.5 Stainless steel mesh
- 6.5.1 Woven wire mesh
- 6.5.2 Sintered stainless steel
- 6.6 Synthetic fiber
- 6.6.1 Polyester
- 6.6.2 Polypropylene
- 6.7 Others
Chapter 7 Market Estimates and Forecast, By Application, 2022 - 2035 ($ Billion) (Thousand Units)
- 7.1 Key trends
- 7.2 Construction equipment
- 7.2.1 Excavators & earthmoving equipment
- 7.2.2 Cranes & lifting equipment
- 7.3 General manufacturing & factory automation
- 7.3.1 Machine tools & CNC equipment
- 7.3.2 Hydraulic presses & injection molding
- 7.3.3 Metal forming & stamping equipment
- 7.4 Automotive
- 7.4.1 Passenger vehicles
- 7.4.2 Commercial vehicles & heavy trucks
- 7.5 Aerospace & defense (incl. All military: air, ground & naval)
- 7.5.1 Civil & commercial aviation
- 7.5.2 Military & defense systems
- 7.6 Marine
- 7.6.1 Commercial shipping & cargo vessels
- 7.6.2 Recreational & specialty marine vessels
- 7.7 Mining
- 7.7.1 Surface mining equipment
- 7.7.2 Underground mining machinery
- 7.8 Oil & gas / petrochemical (incl. All offshore operations)
- 7.8.1 Upstream drilling & extraction (onshore & offshore)
- 7.8.2 Refinery & downstream process equipment
- 7.9 Agriculture
- 7.9.1 Tractors & harvesters
- 7.9.2 Irrigation & specialty farm equipment
- 7.10 Others
Chapter 8 Market Estimates and Forecast, By Distribution Channel, 2022 - 2035 ($ Billion) (Thousand Units)
- 8.1 Key trends
- 8.2 Direct sales
- 8.3 Indirect sales
Chapter 9 Market Estimates and Forecast, By Region, 2022 - 2035 ($ Billion) (Thousand Units)
- 9.1 Key trends
- 9.2 North America
- 9.2.1 US
- 9.2.2 Canada
- 9.3 Europe
- 9.3.1 Germany
- 9.3.2 UK
- 9.3.3 France
- 9.3.4 Italy
- 9.3.5 Spain
- 9.3.6 Netherlands
- 9.4 Asia Pacific
- 9.4.1 China
- 9.4.2 India
- 9.4.3 Japan
- 9.4.4 Australia
- 9.4.5 South Korea
- 9.5 Latin America
- 9.5.1 Brazil
- 9.5.2 Mexico
- 9.6 Middle East and Africa
- 9.6.1 South Africa
- 9.6.2 Saudi Arabia
- 9.6.3 UAE
Chapter 10 Company Profiles
- 10.1 Global Players
- 10.1.1 Parker Hannifin
- 10.1.2 Donaldson Company
- 10.1.3 Pall Corporation
- 10.1.4 HYDAC Technology
- 10.1.5 Mahle GmbH
- 10.1.6 MANN+HUMMEL Group
- 10.1.7 Danfoss Power Solutions
- 10.2 Regional Players
- 10.2.1 MP Filtri S.p.A.
- 10.2.2 UFI Filters Hydraulics
- 10.2.3 YAMASHIN-FILTER Corp.
- 10.2.4 Hengst SE
- 10.2.5 STAUFF
- 10.2.6 FILTREC S.p.A.
- 10.2.7 China LEEMIN Hydraulic Co., Ltd.
- 10.3 Niche & Specialist Players
- 10.3.1 ARGO-HYTOS
- 10.3.2 Schroeder Industries
- 10.3.3 Boll & Kirch Filterbau
- 10.3.4 Lenz Inc.
- 10.3.5 Taisei Kogyo Co., Ltd.
- 10.3.6 Triple R Europe N.V.