|
시장보고서
상품코드
2101554
바이오가스 엔진 시장 기회, 성장요인, 업계 동향 분석 및 예측(2026-2035년)Biogas Engines Market Opportunity, Growth Drivers, Industry Trend Analysis, and Forecast 2026 - 2035 |
||||||

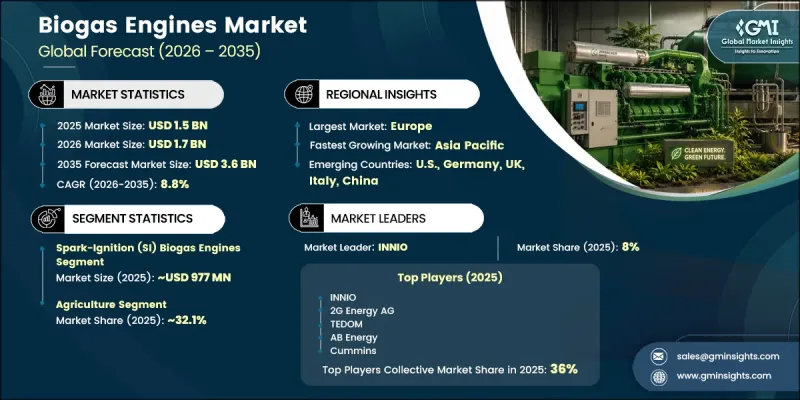
세계의 바이오가스 엔진 시장은 2025년에 15억 달러 규모에 달하며, CAGR 8.8%로 성장하며, 2035년까지 36억 달러에 달할 것으로 추정되고 있습니다.
화석 연료에 의존하는 분산형 발전을 보다 깨끗하고 원료를 연료로 사용하는 에너지 시스템으로 대체하려는 움직임이 점점 더 중요해짐에 따라 선진국과 신흥 국가 모두에서 바이오가스를 연료로 하는 열병합 발전(CHP) 솔루션의 역할이 강화되고 있습니다. 탈탄소화 목표 상향 조정, 유기 폐기물 처리 인프라에 대한 투자 확대, 그리고 엔진 기술의 지속적인 개선이 시장 성장에 유리한 여건을 조성하고 있습니다. 바이오메탄과의 호환성, 디지털 모니터링 기능, 그리고 린번(Lean Burn) 연소 시스템의 발전으로 운영 효율을 높이는 동시에 프로젝트 전개가 가속화되고 있습니다. 이러한 기술적 진전은 계속해서 자본 투자를 유치하며 바이오가스 엔진 시스템의 보급을 지원하고 있습니다. 재생 가능 에너지 발전의 우선순위가 지속적으로 변화하는 가운데, 다양한 운영 환경에서 신뢰할 수 있는 성능을 발휘하는 효율적이고 저배출 발전 기술에 대한 수요 증가가 시장에 긍정적인 영향을 미치고 있습니다.
| 시장 범위 | |
|---|---|
| 시작연도 | 2025년 |
| 예측 기간 | 2026-2035년 |
| 초기 시장 규모 | 15억 달러 |
| 예측액 | 36억 달러 |
| CAGR | 8.8% |
기존 농업용 바이오가스에서 고품질 바이오메탄으로의 전환은 바이오가스 엔진 시장 전반의 엔진 개발에 큰 영향을 미치고 있습니다. 메탄 농도 95% 이상으로 천연가스 품질까지 정제된 바이오메탄은 연소 안정성을 높일 뿐만 아니라 전력계통과의 통합 기회도 촉진합니다. 동시에, 이러한 연료 특성에 대응하기 위해서는 더 높은 압축비로 효율적으로 가동할 수 있는 첨단 엔진 플랫폼이 필요하며, 질소산화물 및 메탄 누출에 관한 배출 규제의 강화에도 대응해야 합니다. 규제 요건이 점점 더 엄격해지는 가운데, 각 제조사는 끊임없이 변화하는 고객의 요구와 규정 준수 요건을 충족하기 위해 연소 효율 향상, 연료 유연성, 그리고 배출 성능 개선을 최우선 과제로 삼고 있습니다.
스파크 점화(SI) 방식 바이오가스 엔진 부문은 2025년에 65.1%의 시장 점유율을 차지하며 9억 7,700만 달러의 매출을 기록했습니다. SI 엔진은 전기를 이용한 점화로 연소를 시작하는 방식을 채택하고 있으며, 메탄을 풍부하게 함유한 연료에서 성능을 극대화하도록 특별히 설계되었습니다. 안정적인 연료 조건에서 효율적이고 신뢰성 높은 운전을 실현하는 능력 덕분에, SI 엔진은 바이오메탄을 연료로 사용하는 열병합 발전(CHP) 설비나 안정적인 원료 공급원을 활용하는 바이오가스 시설에서 선호되는 솔루션이 되고 있습니다.
농업 부문은 2025년에 4억 8,200만 달러의 매출을 기록하며 시장 점유율 32.1%를 차지하며, 2035년까지 연평균 성장률(CAGR) 8.6%로 성장할 것으로 전망됩니다. 농업 부문은 바이오가스 생산에 적합한 유기 원료를 지속적으로 풍부하게 공급하고 있으며, 엔진 도입을 위한 장기적인 기회를 창출하고 있습니다. 풍부한 원료 확보와 재생 가능 에너지 인프라에 대한 지속적인 투자가 농업 부문 전체에서 바이오가스 엔진 시스템에 대한 지속적인 수요를 지원하고 있으며, 이로 인해 해당 부문은 시장 최대 최종 사용 산업 중 하나로의 입지를 공고히 하고 있습니다.
북미의 바이오가스 엔진 시장은 2025년에 19.6%의 점유율을 차지했습니다. 이 지역의 시장은 과거 누적 약 398억 달러에 달하는 막대한 자본 투자를 바탕으로 구축된 확고한 바이오가스 생산 네트워크의 혜택을 지속적으로 누리고 있습니다. 바이오가스 시설의 방대한 도입 실적으로 인해 엔진 유지보수, 수명 주기 서비스, 설비 현대화 및 교체용 부품 조달에 대한 안정적인 수요가 창출되고 있습니다. 이러한 지속적인 인프라 확장은 해당 지역 전역에서 사업을 운영하는 엔진 제조사 및 서비스 제공업체에게 장기적인 수익 기회를 지속적으로 강화하고 있습니다.
전 세계 바이오가스 엔진 시장에서 사업을 운영하고 있는 기업으로는 INNIO, 2G Energy AG, TEDOM, AB Energy, Cummins Inc., MAN Energy Solutions, Caterpillar Inc., Kohler Power / Clarke Energy, Shandong Lvhuan Power Equipment, Ettes Power (Wuxi Teneng Power & Machinery) 등이 있습니다. 바이오가스 엔진 시장의 각 기업은 애프터마켓 서비스 확충, 디지털 모니터링 플랫폼에 대한 투자, 그리고 예측 유지보수 솔루션 강화를 통해 장비의 신뢰성과 고객 유지율을 향상시켜 경쟁력을 높이고 있습니다. 또한 각 제조사는 끊임없이 변화하는 환경 규제에 대응하기 위해 연료 유연성이 높고, 연소 효율이 향상되며, 배기가스가 적은 엔진 플랫폼을 우선적으로 채택하고 있습니다. 다양한 가동 조건 및 특수 용도에 맞춘 제품 맞춤화는 경쟁 입찰 과정에서 공급업체 간의 차별화 요인으로 계속해서 중요하게 여겨지고 있습니다. 더 나아가 각 기업은 지역별 서비스 네트워크를 확대하고 수명주기 지원을 강화하는 한편, 전략적인 합병 및 인수를 추진함으로써 이미 도입된 설비의 기반과 기술적 전문 지식을 확대하고 있습니다.
자주 묻는 질문
목차
제1장 조사 방법과 범위
제2장 개요
제3장 업계 인사이트
제4장 경쟁 구도
제5장 시장 규모·예측 : 제품별, 2022-2035년
제6장 시장 규모·예측 : 전력별, 2022-2035년
제7장 시장 규모·예측 : 최종 사용별, 2022-2035년
제8장 시장 규모·예측 : 냉각 시스템별, 2022-2035년
제9장 시장 규모·예측 : 설치 형태별, 2022-2035년
제10장 시장 규모·예측 : 지역별, 2022-2035년
제11장 기업 개요
KSA 26.07.31The Global Biogas Engines Market was valued at USD 1.5 billion in 2025 and is estimated to grow at a CAGR of 8.8% to reach USD 3.6 billion by 2035.
The growing emphasis on replacing fossil fuel-based distributed power generation with cleaner, feedstock-driven energy systems is strengthening the role of biogas-powered combined heat and power (CHP) solutions in both developed and emerging economies. Rising decarbonization targets, expanding investments in organic waste processing infrastructure, and continuous improvements in engine technologies are creating favorable conditions for market growth. Advancements in biomethane compatibility, digital monitoring capabilities, and lean-burn combustion systems are encouraging faster project deployment while improving operational efficiency. These technological developments continue to attract capital investments and support wider adoption of biogas engine systems. As renewable energy priorities continue to evolve, the market is benefiting from growing demand for efficient, low-emission power generation technologies that deliver reliable performance across a wide range of operating environments.
| Market Scope | |
|---|---|
| Start Year | 2025 |
| Forecast Year | 2026-2035 |
| Start Value | $1.5 Billion |
| Forecast Value | $3.6 Billion |
| CAGR | 8.8% |
The transition from conventional agricultural biogas toward upgraded biomethane has significantly influenced engine development across the biogas engines market. Biomethane refined to natural gas quality with methane concentrations of 95% or higher delivers greater combustion consistency while supporting grid integration opportunities. At the same time, these fuel characteristics require advanced engine platforms capable of operating efficiently at higher compression ratios while complying with increasingly stringent emission regulations governing nitrogen oxides and methane slip. As regulatory expectations continue to tighten, manufacturers are prioritizing enhanced combustion efficiency, fuel flexibility, and improved emissions performance to satisfy evolving customer and compliance requirements.
The spark-ignition (SI) biogas engines segment held 65.1% share, generating USD 977 million in 2025. SI engines rely on electrically generated ignition to initiate combustion and are specifically designed to maximize performance with methane-rich fuels. Their ability to deliver efficient and reliable operation under stable fuel conditions makes them the preferred solution for biomethane-powered CHP installations as well as biogas facilities utilizing consistent feedstock sources.
The agriculture segment generated USD 482 million, accounting for 32.1% share in 2025, and is forecast to grow at a CAGR of 8.6% through 2035. Agricultural operations continue to provide an abundant supply of organic feedstocks suitable for biogas production, creating long-term opportunities for engine deployment. Strong feedstock availability and ongoing investment in renewable energy infrastructure are supporting sustained demand for biogas engine systems throughout the agricultural sector while reinforcing its position as one of the market's largest end-use industries.
North America Biogas Engines Market accounted for 19.6% share in 2025. The regional market continues to benefit from a well-established biogas production network supported by substantial historical capital investments totaling approximately USD 39.8 billion. A significant installed base of biogas facilities has created consistent demand for engine maintenance, lifecycle services, equipment modernization, and replacement procurement. This growing installed infrastructure continues to strengthen long-term revenue opportunities for engine manufacturers and service providers operating throughout the region.
Companies operating in the global biogas engines market include INNIO, 2G Energy AG, TEDOM, AB Energy, Cummins Inc., MAN Energy Solutions, Caterpillar Inc., Kohler Power / Clarke Energy, Shandong Lvhuan Power Equipment, and Ettes Power (Wuxi Teneng Power & Machinery). Companies in the biogas engines market are strengthening their competitive positions by expanding aftermarket service capabilities, investing in digital monitoring platforms, and enhancing predictive maintenance solutions to improve equipment reliability and customer retention. Manufacturers are also prioritizing engine platforms with greater fuel flexibility, improved combustion efficiency, and lower emissions to comply with evolving environmental regulations. Product customization for diverse operating conditions and specialized applications continues to differentiate suppliers during competitive bidding processes. In addition, companies are expanding regional service networks, increasing lifecycle support offerings, and pursuing strategic mergers and acquisitions to broaden their installed equipment base and technical expertise.
Table of Contents
Chapter 1 Methodology & Scope
- 1.1 Research approach
- 1.2 Quality commitments
- 1.2.1 GMI AI policy & data integrity commitment
- 1.2.1.1 Source consistency protocol
- 1.2.1 GMI AI policy & data integrity commitment
- 1.3 Research trail & confidence scoring
- 1.3.1 Research trail components
- 1.3.2 Scoring components
- 1.4 Data collection
- 1.4.1 Partial list of primary sources
- 1.5 Data mining sources
- 1.5.1 Paid sources
- 1.5.1.1 Sources, by region
- 1.5.1 Paid sources
- 1.6 Base estimates and calculations
- 1.6.1 Base year calculation for any one approach
- 1.7 Market estimates & forecasts parameters
- 1.8 Forecast model
- 1.8.1 Quantified market impact analysis
- 1.8.1.1 Mathematical impact of growth parameters on forecast
- 1.8.1 Quantified market impact analysis
- 1.9 Research transparency addendum
- 1.9.1 Source attribution framework
- 1.9.2 Quality assurance metrics
- 1.9.3 Our commitment to trust
- 1.10 Market definitions
Chapter 2 Executive Summary
- 2.1 Industry synopsis, 2022 - 2035
- 2.1.1 Business trends
- 2.1.2 Product trends
- 2.1.3 Power trends
- 2.1.4 End use trends
- 2.1.5 Cooling system trends
- 2.1.6 Installation trends
- 2.1.7 Regional trends
Chapter 3 Industry Insights
- 3.1 Industry ecosystem analysis
- 3.1.1 Raw material availability & sourcing analysis
- 3.1.2 Manufacturing capacity assessment
- 3.1.3 Supply chain resilience & risk factors
- 3.1.4 Distribution network analysis
- 3.2 Industry impact forces
- 3.2.1 Growth drivers
- 3.2.2 Industry pitfalls & challenges
- 3.3 Regulatory landscape
- 3.4 Growth potential analysis
- 3.5 Porter's analysis
- 3.5.1 Bargaining power of suppliers
- 3.5.2 Bargaining power of buyers
- 3.5.3 Threat of new entrants
- 3.5.4 Threat of substitutes
- 3.6 PESTEL analysis
- 3.6.1 Political factors
- 3.6.2 Economic factors
- 3.6.3 Social factors
- 3.6.4 Technological factors
- 3.6.5 Legal factors
- 3.6.6 Environmental factors
- 3.7 Cost structure analysis of biogas engines
- 3.8 Emerging opportunities & trends
- 3.9 Digitalization & IoT integration
- 3.10 Growth in untapped markets & applications
- 3.11 Investment analysis & future prospects
- 3.12 Price trend analysis (USD/MW) (Driven by Primary Research)
- 3.12.1 By region (Driven by Primary Research)
- 3.12.2 By power (Driven by Primary Research)
- 3.13 Trade data analysis (Driven by Primary Research)
- 3.13.1 Import/export value trends (Driven by Primary Research)
- 3.13.2 Key trade corridors & tariff impact (Driven by Primary Research)
- 3.14 Impact of AI & Generative AI on the market (Driven by Primary Research)
- 3.14.1 AI-Driven production optimization (Driven by Primary Research)
- 3.14.2 Predictive maintenance & fault detection (Driven by Primary Research)
Chapter 4 Competitive Landscape, 2026
- 4.1 Introduction
- 4.2 Company market share analysis, by region, 2025
- 4.2.1 North America
- 4.2.2 Europe
- 4.2.3 Asia Pacific
- 4.2.4 Middle East & Africa
- 4.2.5 Latin America
- 4.3 Competitive analysis of major market players
- 4.4 Competitive positioning matrix
- 4.5 Key developments
- 4.5.1 Mergers & acquisitions
- 4.5.2 Partnerships & collaborations
- 4.5.3 New product launches
- 4.5.4 Expansion plans & funding
- 4.6 Company tier benchmarking
- 4.6.1 Tier classification criteria & qualifying thresholds
- 4.6.2 Tier positioning matrix by revenue, geography & innovation
Chapter 5 Market Size and Forecast, By Product, 2022 - 2035 (USD Million & MW)
- 5.1 Key trends
- 5.2 Spark-ignition (SI) biogas engines
- 5.3 Dual-fuel biogas engines
Chapter 6 Market Size and Forecast, By Power, 2022 - 2035 (USD Million & MW)
- 6.1 Key trends
- 6.2 ≤ 100 kW
- 6.3 > 100 kW - 500 kW
- 6.4 > 500 kW - 1 MW
- 6.5 > 1 MW
Chapter 7 Market Size and Forecast, By End Use, 2022 - 2035 (USD Million & MW)
- 7.1 Key trends
- 7.2 Agriculture
- 7.3 Wastewater treatment
- 7.4 Landfills
- 7.5 Industrial
- 7.6 Municipal waste
- 7.7 Others
Chapter 8 Market Size and Forecast, By Cooling System, 2022 - 2035 (USD Million & MW)
- 8.1 Key trends
- 8.2 Air-cooled
- 8.3 Water-cooled
Chapter 9 Market Size and Forecast, By Installation, 2022 - 2035 (USD Million & MW)
- 9.1 Key trends
- 9.2 New
- 9.3 Replacement
Chapter 10 Market Size and Forecast, By Region, 2022 - 2035 (USD Million & MW)
- 10.1 Key trends
- 10.2 North America
- 10.2.1 U.S.
- 10.2.2 Canada
- 10.3 Europe
- 10.3.1 Germany
- 10.3.2 UK
- 10.3.3 Austria
- 10.3.4 Italy
- 10.3.5 France
- 10.3.6 Sweden
- 10.3.7 Finland
- 10.3.8 Spain
- 10.3.9 Netherlands
- 10.3.10 Poland
- 10.3.11 Czech Republic
- 10.4 Asia Pacific
- 10.4.1 China
- 10.4.2 India
- 10.4.3 Japan
- 10.4.4 South Korea
- 10.4.5 Australia
- 10.4.6 Malaysia
- 10.4.7 Thailand
- 10.4.8 Philippines
- 10.5 Middle East & Africa
- 10.5.1 Saudi Arabia
- 10.5.2 South Africa
- 10.5.3 UAE
- 10.5.4 Kenya
- 10.6 Latin America
- 10.6.1 Brazil
- 10.6.2 Mexico
- 10.6.3 Argentina
Chapter 11 Company Profiles
- 11.1 2G Energy AG
- 11.2 AB Energy
- 11.3 Bergen Engines
- 11.4 Capstone Green Energy
- 11.5 Caterpillar
- 11.6 Clarke Energy
- 11.7 Cummins
- 11.8 Deutz AG
- 11.9 Doosan Enerbility
- 11.10 Everllence
- 11.11 Guascor Energy
- 11.12 INNIO
- 11.13 JFE Engineering
- 11.14 Kawasaki Heavy Industries
- 11.15 Liebherr
- 11.16 Mitsubishi Heavy Industries
- 11.17 Perkins Engines
- 11.18 Rolls Royce
- 11.19 TEDOM
- 11.20 Wartsila
- 11.21 Weichai Power
- 11.22 YANMAR HOLDINGS CO.