

|
시장보고서
상품코드
2101627
가식성 및 불가시성 식품 마커 시장 기회, 성장 촉진요인, 업계 동향 분석 및 예측(2026-2035년)Edible and Invisible Food Markers (Taggants) Market Opportunity, Growth Drivers, Industry Trend Analysis, and Forecast 2026 - 2035 |
||||||

세계의 가식성 및 불가시성 식품 마커 시장은 2025년에 2억 6,800만 달러 규모에 달하고, CAGR 16.1%로 성장하여 2035년까지 11억 7,000만 달러에 달할 것으로 예측됩니다.
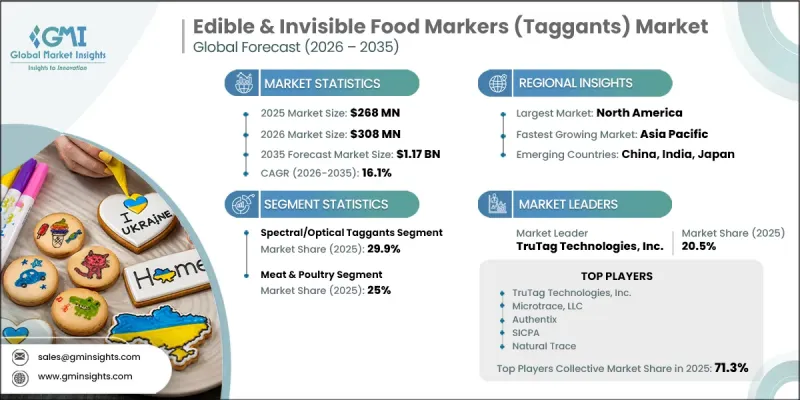
정부, 규제 당국, 식품 제조업체가 제품의 진위 확인, 추적성 및 공급망 투명성을 더욱 중시함에 따라 가식성 및 불가시성 식품 마커(태간트) 시장은 성장세를 보이고 있습니다. 식품 위조 방지, 소비자 신뢰 강화, 그리고 진화하는 추적성 요건 준수를 위한 노력의 강화로 인해 식품 업계 전반에 걸쳐 첨단 태깅 기술에 대한 지속적인 수요가 계속해서 발생하고 있습니다. 동시에, 분자 인증 기술과 관련된 비용이 감소함에 따라, 이전에는 비용상의 제약으로 인해 도입이 어려웠던 더 광범위한 식품 제품에서도 가식성 및 불가시성 식품 마커의 상업적 실용화가 가능해지고 있습니다. 미국 내 32만 3,000곳 이상의 식품 시설을 대상으로 하는 규제 조치는, 식품 생산 및 유통의 전 과정에서 디지털로 검증 가능한 기록을 생성할 수 있는 진위 확인 시스템의 도입을 촉진하는 체계적인 규정 준수 요건을 마련함으로써, 이러한 기술의 채택을 더욱 뒷받침하고 있습니다. 또한, 재료 공학의 지속적인 발전으로 식용 마커 플랫폼의 내구성, 인코딩 능력 및 가공 안정성이 향상되어 가혹한 제조 조건에서도 성능을 유지할 수 있게 됨에 따라, 가식성 및 불가시성 식품 마커(태간트) 시장 전반에 걸쳐 보다 광범위한 상업적 채택이 촉진되고 있습니다.
| 시장 범위 | |
|---|---|
| 시작 연도 | 2025년 |
| 예측 기간 | 2026-2035년 |
| 초기 시장 규모 | 2억 6,800만 달러 |
| 예측액 | 11억 7,000만 달러 |
| CAGR | 16.1% |
향신료, 오일, 조미료 부문은 17.9%의 점유율을 차지하며, 2025년에는 4,800만 달러에 달했습니다. 이 카테고리의 수요는 계속해서 견조한 추세를 보일 것입니다. 이는 전 세계 공급망 전반에 걸쳐 고급 식품이 여전히 위조 및 진위 여부에 대한 우려라는 높은 위험에 직면해 있기 때문입니다. 식품 제조업체와 규제 당국이 제품 검증 체계를 강화하고 브랜드 신뢰성을 보호하기 위한 노력을 가속화하는 가운데, 제품의 원산지 확인, 추적성 강화 및 식품 안전 기준 준수를 지원하는 ‘보이지 않는 마킹 기술’의 가치는 점점 더 높아지고 있습니다. 이러한 요인들로 인해 향신료, 오일, 조미료 부문 전반에 걸쳐 진위 확인 솔루션의 도입이 지속적으로 촉진되고 있습니다.
북미의 가식성 및 불가시성 식품 마커 시장은 2025년에 9,400만 달러 규모를 기록하고, 2035년까지 3억 5,200만 달러에 달할 것으로 예측됩니다. 종합적인 식품 추적성 규제와 인증 기술에 대한 투자 확대에 힘입어, 미국이 계속해서 지역 수요의 대부분을 차지하고 있습니다. 32만 3,000개 이상의 식품 사업자에게 영향을 미치는 규제 체계에 따라 추적성 시스템 도입을 위한 체계적인 일정이 수립되었으며, 식품 기업들은 끊임없이 변화하는 규정 준수 요건을 충족하고 공급망의 투명성을 강화하기 위해 첨단 태깅 및 검증 솔루션에 대한 투자를 가속화하도록 촉구받고 있습니다.
세계 가식성 및 불가시성 식품 마커(태간트) 시장에서 사업을 전개하는 주요 기업으로는 Authentix, SafeTraces, TruTag Technologies, SICPA, Microtrace LLC, Olnica, YPB Group, Natural Trace 등이 있습니다. 가식성 및 불가시성 식품 마커(태간트) 시장에 진출한 각 기업은 마커 성능 향상, 인코딩 기능 확충, 다양한 식품 용도에서의 제품 호환성 강화를 위한 연구 개발에 투자함으로써 경쟁력을 높이고 있습니다. 많은 제조업체는 진화하는 규제 및 업계 요건을 충족하는, 안전성이 높고 확장성이 뛰어나며 비용 효율성이 우수한 인증 솔루션을 제공하기 위해 기술 혁신을 최우선으로 하고 있습니다. 식품 생산자, 가공업체 및 공급망 이해관계자와의 전략적 제휴는 기업이 시장 내 영향력을 확대하는 동시에 상용화를 가속화하는 데 기여하고 있습니다. 또한 각 기업은 생산능력 확대, 디지털 추적성 플랫폼 개선, 그리고 첨단 검증 기술의 통합을 추진하며 종합적인 인증 솔루션을 제공하기 위해 노력하고 있습니다.
자주 묻는 질문
목차
제1장 조사 방법과 범위
제2장 주요 요약
제3장 업계 인사이트
제4장 경쟁 구도
제5장 시장 추정 및 예측 : 기술 유형별, 2022-2035년
제6장 시장 추정 및 예측 : 전개 방식별, 2022-2035년
제7장 시장 추정 및 예측 : 용도별, 2022-2035년
제8장 시장 추정 및 예측 : 최종사용자별, 2022-2035년
제9장 시장 추정 및 예측 : 지역별, 2022-2035년
제10장 기업 개요
KSM 26.08.05The Global Edible & Invisible Food Markers (Taggants) Market was valued at USD 268 million in 2025 and is estimated to grow at a CAGR of 16.1% to reach USD 1.17 billion by 2035.
The edible & invisible food markers (taggants) market is experiencing momentum as governments, regulatory agencies, and food manufacturers place greater emphasis on product authentication, traceability, and supply chain transparency. Increasing efforts to combat food fraud, strengthen consumer confidence, and comply with evolving traceability requirements continue to create sustained demand for advanced tagging technologies across the food industry. At the same time, declining costs associated with molecular authentication technologies are making edible and invisible food markers commercially practical for a much broader range of food products that were previously considered too cost-sensitive for implementation. Regulatory initiatives covering more than 323,000 food establishments across the United States are further supporting adoption by creating structured compliance requirements that encourage the deployment of authentication systems capable of generating digitally verifiable records throughout food production and distribution. Continuous advancements in material engineering have also enhanced the durability, encoding capability, and processing stability of edible marker platforms, enabling them to maintain performance under demanding manufacturing conditions while supporting wider commercial adoption across the edible & invisible food markers (taggants) market.
| Market Scope | |
|---|---|
| Start Year | 2025 |
| Forecast Year | 2026-2035 |
| Start Value | $268 Million |
| Forecast Value | $1.17 Billion |
| CAGR | 16.1% |
The spices, oils & condiments segment accounted for 17.9% share, representing USD 48 million in 2025. Demand within this category remains strong because premium food products continue to face elevated risks of adulteration and authenticity concerns across global supply chains. As food manufacturers and regulatory bodies intensify efforts to improve product verification and safeguard brand integrity, invisible tagging technologies are becoming increasingly valuable for confirming product origin, strengthening traceability, and supporting compliance with food safety standards. These factors continue to drive greater adoption of authentication solutions throughout the spices, oils, and condiments segment.
North America Edible & Invisible Food Markers (Taggants) Market generated USD 94 million in 2025 and is projected to reach USD 352 million by 2035. The United States continues to account for most regional demand, supported by comprehensive food traceability regulations and increasing investments in authentication technologies. Regulatory frameworks impacting more than 323,000 food establishments have established structured implementation timelines for traceability systems, encouraging food businesses to accelerate investments in advanced tagging and verification solutions to meet evolving compliance requirements and strengthen supply chain transparency.
The major companies operating in the global edible & invisible food markers (taggants) market include Authentix, SafeTraces, TruTag Technologies, SICPA, Microtrace LLC, Olnica, YPB Group, and Natural Trace. Companies participating in the edible & invisible food markers (taggants) market are strengthening their competitive position by investing in research and development to improve marker performance, expand encoding capabilities, and enhance product compatibility across diverse food applications. Many manufacturers are prioritizing technology innovation to deliver highly secure, scalable, and cost-efficient authentication solutions that satisfy evolving regulatory and industry requirements. Strategic collaborations with food producers, processors, and supply chain stakeholders are helping companies broaden market reach while accelerating commercial adoption. Businesses are also expanding production capabilities, improving digital traceability platforms, and integrating advanced verification technologies to deliver comprehensive authentication solutions.
Table of Contents
Chapter 1 Methodology & Scope
- 1.1 Research approach
- 1.2 Quality Commitments
- 1.2.1 GMI AI policy & data integrity commitment
- 1.2.1.1 Source consistency protocol
- 1.2.1 GMI AI policy & data integrity commitment
- 1.3 Research Trail & Confidence Scoring
- 1.3.1 Research Trail Components
- 1.3.2 Scoring Components
- 1.4 Data Collection
- 1.4.1 Partial list of primary sources
- 1.5 Data mining sources
- 1.5.1 Paid sources
- 1.5.1.1 Sources, by region
- 1.5.1 Paid sources
- 1.6 Base estimates and calculations
- 1.6.1 Base year calculation for any one approach
- 1.7 Forecast model
- 1.7.1 Quantified market impact analysis
- 1.7.1.1 Mathematical impact of growth parameters on forecast
- 1.7.1 Quantified market impact analysis
- 1.8 Research transparency addendum
- 1.8.1 Source attribution framework
- 1.8.2 Quality assurance metrics
- 1.8.3 Our commitment to trust
Chapter 2 Executive Summary
- 2.1 Industry 360° synopsis
- 2.2 Key market trends
- 2.2.1 Regional
- 2.2.2 Technology Type
- 2.2.3 Deployment Mode
- 2.2.4 Application
- 2.2.5 End-User
- 2.3 TAM Analysis, 2026-2035
- 2.4 CXO perspectives: Strategic imperatives
Chapter 3 Industry Insights
- 3.1 Industry ecosystem analysis
- 3.1.1 Supplier landscape
- 3.1.2 Profit margin
- 3.1.3 Value addition at each stage
- 3.1.4 Factor affecting the value chain
- 3.1.5 Disruptions
- 3.2 Industry impact forces
- 3.2.1 Growth drivers
- 3.2.2 Industry pitfalls and challenges
- 3.2.3 Market opportunities
- 3.3 Growth potential analysis
- 3.4 Regulatory landscape
- 3.4.1 North America
- 3.4.2 Europe
- 3.4.3 Asia Pacific
- 3.4.4 Latin America
- 3.4.5 Middle East & Africa
- 3.5 Porter's analysis
- 3.6 PESTEL analysis
- 3.7 Price trends
- 3.7.1 By region
- 3.7.2 By product type
- 3.8 Future market trends
- 3.9 Technology and Innovation landscape
- 3.9.1 Current technological trends
- 3.9.2 Emerging technologies
- 3.10 Patent Landscape
- 3.11 Trade statistics (HS code)
- 3.11.1 Major importing countries
- 3.11.2 Major exporting countries
- 3.12 Sustainability and environmental aspects
- 3.12.1 Sustainable practices
- 3.12.2 Waste reduction strategies
- 3.12.3 Energy efficiency in production
- 3.12.4 Eco-friendly initiatives
- 3.13 Carbon footprint consideration
Chapter 4 Competitive Landscape, 2025
- 4.1 Introduction
- 4.2 Company market share analysis
- 4.2.1 By region
- 4.2.1.1 North America
- 4.2.1.2 Europe
- 4.2.1.3 Asia Pacific
- 4.2.1.4 LATAM
- 4.2.1.5 MEA
- 4.2.1 By region
- 4.3 Company matrix analysis
- 4.4 Competitive analysis of major market players
- 4.5 Competitive positioning matrix
- 4.6 Key developments
- 4.6.1 Mergers & acquisitions
- 4.6.2 Partnerships & collaborations
- 4.6.3 New Product Launches
- 4.6.4 Expansion Plans
Chapter 5 Market Estimates and Forecast, By Technology Type, 2022-2035 (USD Million)
- 5.1 Key trends
- 5.2 DNA-Based Taggants
- 5.2.1 Synthetic DNA Taggants
- 5.2.2 DNA Barcodes & Oligo Labels
- 5.2.3 DNA-Enabled Labels & Inks
- 5.3 Spectral/Optical Taggants
- 5.3.1 Photoluminescent Markers
- 5.3.2 Spectral Signature Inks
- 5.3.3 Light-Responsive Materials
- 5.4 Microtag/Physical Taggants
- 5.4.1 Nanoporous Silica-Based Barcodes
- 5.4.2 Ceramic Microparticles
- 5.4.3 3D Structured Particles
- 5.5 Chemical Taggants
- 5.5.1 Molecular Markers
- 5.5.2 Isotopic Signatures
- 5.5.3 Rare Earth Elements
- 5.6 Others
- 5.6.1 Multi-Proof Integration Systems
- 5.6.2 Emerging Hybrid Technologies
Chapter 6 Market Estimates and Forecast, By Deployment Mode, 2022-2035 (USD Million)
- 6.1 Key trends
- 6.2 Ingredient-Level Tagging
- 6.2.1 Edible Markers Mixed into Product
- 6.2.2 Food-Grade DNA Integration
- 6.3 Surface-Applied Taggants
- 6.3.1 Direct Surface Application
- 6.3.2 Spray & Coating Technologies
- 6.4 Packaging-Embedded Markers
- 6.4.1 DNA Inks & Labels
- 6.4.2 Packaging Material Integration
- 6.4.3 Tamper-Evident Solutions
Chapter 7 Market Estimates and Forecast, By Application, 2022-2035 (USD Million)
- 7.1 Key trends
- 7.2 Meat & Poultry
- 7.2.1 Beef
- 7.2.2 Pork
- 7.2.3 Chicken & Turkey
- 7.3 Seafood & Fish
- 7.4 Spices, Oils & Condiments
- 7.4.1 Premium Spices (Saffron, Turmeric, Pepper)
- 7.4.2 Olive Oil & Specialty Oils
- 7.4.3 Condiments & Sauces
- 7.5 Dairy & Eggs
- 7.5.1 Milk & Cheese
- 7.5.2 Eggs & Egg Products
- 7.6 Fruits & Vegetables
- 7.6.1 Organic Produce
- 7.6.2 Premium Fresh Fruits
- 7.7 Processed Foods & Beverages
- 7.7.1 Alcoholic Beverages (Wine, Spirits)
- 7.7.2 Packaged Foods
- 7.7.3 Premium Coffee & Tea
- 7.8 Others
- 7.8.1 Specialty Ingredients
- 7.8.2 Functional Foods & Nutraceuticals
Chapter 8 Market Estimates and Forecast, By End-User, 2022-2035 (USD Million)
- 8.1 Key trends
- 8.2 Food Producers & Farms
- 8.2.1 Primary Agricultural Producers
- 8.2.2 Livestock & Poultry Farms
- 8.3 Food Processors & Manufacturers
- 8.3.1 Large-Scale Processors
- 8.3.2 Specialty & Artisan Producers
- 8.4 Retailers & Brand Owners
- 8.4.1 Premium & Luxury Brands
- 8.4.2 Private Label & Retail Chains
- 8.5 Regulatory Bodies & Certifiers
- 8.5.1 Government Food Safety Agencies
- 8.5.2 Third-Party Certification Bodies
- 8.5.3 Export Compliance Authorities
- 8.6 Third-Party Testing & Verification Services
- 8.6.1 Independent Testing Laboratories
- 8.6.2 Authentication Service Providers
- 8.6.3 TaaS (Testing-as-a-Service) Platforms
Chapter 9 Market Estimates and Forecast, By Region, 2022-2035 (USD Million)
- 9.1 Key trends
- 9.2 North America
- 9.2.1 U.S.
- 9.2.2 Canada
- 9.3 Europe
- 9.3.1 Germany
- 9.3.2 UK
- 9.3.3 France
- 9.3.4 Spain
- 9.3.5 Italy
- 9.3.6 Rest of Europe
- 9.4 Asia Pacific
- 9.4.1 China
- 9.4.2 India
- 9.4.3 Japan
- 9.4.4 Australia
- 9.4.5 South Korea
- 9.4.6 Rest of Asia Pacific
- 9.5 Latin America
- 9.5.1 Brazil
- 9.5.2 Mexico
- 9.5.3 Argentina
- 9.5.4 Rest of Latin America
- 9.6 Middle East and Africa
- 9.6.1 Saudi Arabia
- 9.6.2 South Africa
- 9.6.3 UAE
- 9.6.4 Rest of Middle East and Africa
Chapter 10 Company Profiles
- 10.1 TruTag Technologies, Inc.
- 10.2 Microtrace, LLC
- 10.3 Authentix
- 10.4 SICPA
- 10.5 Natural Trace
- 10.6 Olnica
- 10.7 YPB Group (Codeifai Limited)
- 10.8 SafeTraces


