

|
시장보고서
상품코드
2101647
안정화 요소 시장 기회, 성장요인, 업계 동향 분석 및 예측(2026-2035년)Stabilized Urea Market Opportunity, Growth Drivers, Industry Trend Analysis, and Forecast 2026 - 2035 |
||||||

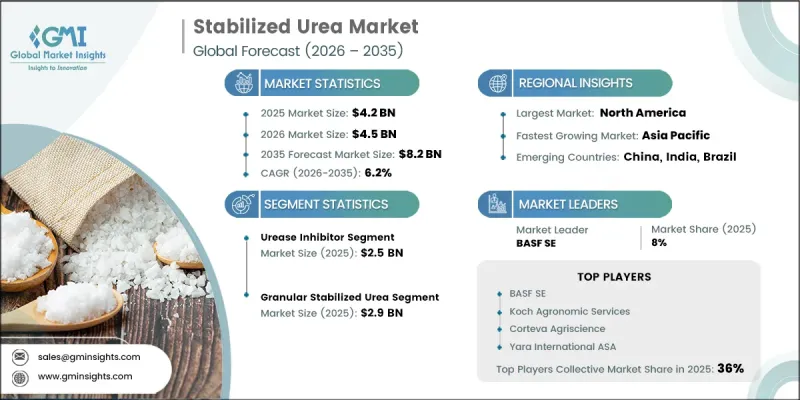
세계의 안정화 요소 시장은 2025년에 42억 달러 규모에 달하며, CAGR 6.2%로 성장하며, 2035년까지 82억 달러에 달할 것으로 예측됩니다.
질소 이용 효율을 향상시키고 환경 목표 달성을 지원하는 고효율 비료에 대한 수요가 점점 높아지는 가운데, 안정화 요소 업계는 기존 요소 시장을 능가하는 성장을 이어가고 있습니다. 기존 시장에는 이미 충분한 상품 공급이 이루어지고 있으며, 기존 요소 부문의 성장은 비교적 완만하지만, 업계 관계자들은 안정화 기술의 보급을 계속해서 우선시하고 있습니다. 질소 이용 효율이 높은 비료 제품의 사용을 장려하는 규제 동향은 구매 결정을 재편하고, 여러 농업 시장에서 제품에 대한 수용을 가속화하고 있습니다. 이러한 정책의 변화는 농업적 성능에 더해 규제 준수를 더욱 중시하는 방향으로 경쟁 구도를 바꾸고 있습니다. 그 결과, 각 제조사는 등록 완료되고 규제를 준수하는 제품 포트폴리오에 주력하는 한편, 성숙한 농업 지역과 개발도상 농업 지역 모두에서 상업화 기회를 확대하고 있습니다. 또한 시장에 진출한 기업은 단일 비료 제품 내에 여러 가지 억제 기술을 결합한 첨단 배합 기술에 대한 투자도 추진하고 있습니다. 이를 통해 질소 보유력 향상, 작업 효율 증대, 그리고 다양한 작물 생산 시스템 전반에 걸친 폭넓은 성능상 이점이 제공됩니다. 규제가 이미 시행되고 있는 지역에서는 그 영향이 즉각적으로 나타나고 있지만, 현재 유사한 정책을 검토 중인 시장에서도 중기적인 성장 기회가 예상됩니다.
| 시장 범위 | |
|---|---|
| 시작연도 | 2025년 |
| 예측 기간 | 2026-2035년 |
| 초기 시장 규모 | 42억 달러 |
| 예측액 | 82억 달러 |
| CAGR | 6.2% |
요소 분해 효소 억제제 부문은 2025년에 25억 달러를 차지하며, 2026-2035년 연평균 성장률(CAGR) 5%로 성장할 것으로 전망됩니다. 요소 분해 효소 억제제는 전 세계 농업 시장에서 여전히 가장 널리 채택되고 있는 안정화 기술이기 때문에 이 부문은 안정화 요소 수요에서 계속해서 가장 큰 점유율을 차지하고 있습니다. 업계의 성장은 이러한 제품들이 시중에서 널리 판매되고 있으며, 시비 후 영양분 손실을 최소화하면서 질소 이용 효율을 높이는 데 확고한 역할을 하고 있음을 반영합니다. 지난 10년 동안 채택률은 꾸준히 증가하며 왔으나, 이 부문은 선진국의 농업 시장에서 점차 성숙 단계에 접어들고 있습니다. 예상 성장률은 북미 및 서유럽에서 이 시장의 성숙도를 반영하는 한편, 추가적인 규제 조치와 지속가능성 노력이 안정화 질소 비료의 추가적인 사용을 촉진하고 있으며, 지속적인 성장 기회가 있음을 보여줍니다.
과립형 안정화 요소 부문은 2025년에 29억 달러의 시장 규모를 기록하며 65.9%의 점유율을 차지했고, 대규모 농업 경영에서 질소 시비의 주요 제품 형태로서의 위상을 유지했습니다. 과립형 안정화 요소는 기존 비료 취급 설비와의 호환성이 뛰어나고, 보관 및 운송이 용이하며, 효율적인 밭 시비를 가능하게 하므로 여전히 선호되는 선택지로 남아 있습니다. 표면 처리된 입상 제제는 상업 생산에서 여전히 주류를 이루고 있으며, 제조업체는 기존 입상 비료의 운영상 이점을 유지하면서 안정화 기술을 접목할 수 있게 되었습니다. 제품 개발에 대한 지속적인 투자를 통해 예측 기간 중 제제의 성능이 더욱 향상되고 수요가 확대될 것으로 예상됩니다.
북미의 안정화 요소 시장은 2025년에 31%의 점유율을 차지하며 14억 달러에 달했습니다. 지역 시장의 확대는 견고한 농업 생산, 비료 소비량 증가, 그리고 영양 관리를 개선하기 위한 고효율 질소 제품의 채택 확대에 힘입고 있습니다. 비료 최적화에 대한 의식의 향상, 지속가능한 농업 관행에 대한 중시, 그리고 현대적인 농업 기술에 대한 지속적인 투자가 양 지역 모두에서 장기적인 시장 발전을 지원하고 있습니다. 농업 관행의 진화, 규제 체계의 개선, 그리고 작물 생산성 향상에 대한 수요 증가가 맞물리면서, 예측 기간 중 안정화 요소의 성장 전망은 계속해서 강세를 보일 것으로 예상됩니다.
자주 묻는 질문
목차
제1장 조사 방법과 범위
제2장 개요
제3장 업계 인사이트
제4장 경쟁 구도
제5장 시장 추산·예측 : 안정화 기술별, 2022-2035년
제6장 시장 추산·예측 : 물리적 형상별, 2022-2035년
제7장 시장 추산·예측 : 용도별, 2022-2035년
제8장 시장 추산·예측 : 폼별, 2022-2035년
제9장 시장 추산·예측 : 지역별, 2022-2035년
제10장 기업 개요
KSA 26.07.31The Global Stabilized Urea Market was valued at USD 4.2 billion in 2025 and is estimated to grow at a CAGR of 6.2% to reach USD 8.2 billion by 2035.
The stabilized urea industry continues to outperform the conventional urea market as demand increasingly shifts toward enhanced-efficiency fertilizers that improve nitrogen utilization and support environmental objectives. Growth in the traditional urea sector remains comparatively moderate because established markets already have sufficient commodity supply, while industry participants continue to prioritize the wider adoption of stabilization technologies. Regulatory developments encouraging the use of nitrogen-efficient fertilizer products are reshaping purchasing decisions and accelerating product acceptance across several agricultural markets. These evolving policies are also changing the competitive landscape by placing greater emphasis on regulatory compliance alongside agronomic performance. As a result, manufacturers are focusing on registered and compliant product portfolios while expanding commercialization opportunities in both mature and developing agricultural regions. Market participants are also directing investments toward advanced formulations that combine multiple inhibitor technologies within a single fertilizer product to improve nitrogen retention, increase operational efficiency, and deliver broader performance benefits across diverse crop production systems. The impact remains immediate in regions where regulations are already implemented, while markets currently evaluating similar policies are expected to experience medium-term growth opportunities.
| Market Scope | |
|---|---|
| Start Year | 2025 |
| Forecast Year | 2026-2035 |
| Start Value | $4.2 Billion |
| Forecast Value | $8.2 Billion |
| CAGR | 6.2% |
The urease inhibitor segment accounted for USD 2.5 billion in 2025 and is projected to grow at a CAGR of 5% from 2026 to 2035. This segment continues to represent the largest share of stabilized urea demand because urease inhibitors remain the most widely adopted stabilization technology across global agricultural markets. Industry expansion reflects the broad commercial availability of these products and their established role in improving nitrogen use efficiency while minimizing nutrient losses after fertilizer application. Although adoption has steadily increased over the past decade, the segment is entering a more mature phase in developed agricultural markets. The expected growth rate reflects this level of market maturity across North America and Western Europe while also indicating continued expansion opportunities as additional regulatory measures and sustainability initiatives encourage greater use of stabilized nitrogen fertilizers.
The granular stabilized urea segment was valued at USD 2.9 billion in 2025 and represented 65.9% share, maintaining its position as the leading product format for nitrogen application across large-scale agricultural operations. Granular stabilized urea remains the preferred choice because it is compatible with existing fertilizer handling equipment, offers convenient storage and transportation, and supports efficient field application. Surface-treated granular formulations continue to dominate commercial production, enabling manufacturers to integrate stabilization technologies while preserving the operational advantages of conventional granular fertilizers. Ongoing investments in product development are expected to further improve formulation performance and strengthen demand throughout the forecast period.
North America Stabilized Urea Market accounted for 31% share in 2025, reaching USD 1.40 billion. Regional market expansion is supported by strong agricultural production, increasing fertilizer consumption, and the growing adoption of enhanced-efficiency nitrogen products designed to improve nutrient management. Rising awareness regarding fertilizer optimization, greater emphasis on sustainable farming practices, and continued investments in modern agricultural technologies are supporting long-term market development across both regions. The combination of evolving farming practices, improving regulatory frameworks, and increasing demand for higher crop productivity continues to strengthen growth prospects for stabilized urea throughout the forecast period.
Major companies operating in the global stabilized urea market include BASF SE, Koch Agronomic Services, Corteva Agriscience, Yara International ASA, SKW Stickstoffwerke Piesteritz GmbH, ICL Group, Tessenderlo Group, AgXplore International, LLC, Loveland Products, Inc., J.R. Simplot Company, and Helena Agri-Enterprises, LLC. Leading companies in the stabilized urea market focus on expanding their competitive position through continuous product innovation, strategic partnerships, portfolio diversification, and investments in advanced fertilizer technologies. Manufacturers prioritize developing enhanced-efficiency fertilizer solutions that improve nutrient utilization while meeting evolving environmental and regulatory requirements. Companies are also strengthening their market presence by expanding production capabilities, improving distribution networks, and increasing penetration across high-growth agricultural regions. Investments in research and development remain a key strategy for introducing advanced stabilization technologies and improving product performance.
Table of Contents
Chapter 1 Methodology & Scope
- 1.1 Market scope and definition
- 1.2 Research design
- 1.2.1 Research approach
- 1.2.2 Data collection methods
- 1.3 Data mining sources
- 1.3.1 Global
- 1.3.2 Regional/Country
- 1.4 Base estimates and calculations
- 1.4.1 Base year calculation
- 1.4.2 Key trends for market estimation
- 1.5 Primary research and validation
- 1.5.1 Primary sources
- 1.6 Forecast model
- 1.7 Research assumptions and limitations
Chapter 2 Executive Summary
- 2.1 Industry 360° synopsis
- 2.2 Key market trends
- 2.2.1 Regional
- 2.2.2 Stabilization Technology
- 2.2.3 Physical Form
- 2.2.4 Crop Type
- 2.2.5 Application
- 2.3 TAM Analysis, 2026-2035
- 2.4 CXO perspectives: Strategic imperatives
- 2.4.1 Executive decision points
Chapter 3 Industry Insights
- 3.1 Industry ecosystem analysis
- 3.1.1 Supplier landscape
- 3.1.2 Profit margin
- 3.1.3 Value addition at each stage
- 3.1.4 Factor affecting the value chain
- 3.1.5 Disruptions
- 3.2 Industry impact forces
- 3.2.1 Growth drivers
- 3.2.2 Industry pitfalls and challenges
- 3.2.3 Market opportunities
- 3.3 Growth potential analysis
- 3.4 Regulatory landscape
- 3.4.1 North America
- 3.4.2 Europe
- 3.4.3 Asia Pacific
- 3.4.4 Latin America
- 3.4.5 Middle East & Africa
- 3.5 Porter's analysis
- 3.6 PESTEL analysis
- 3.7 Price trends
- 3.7.1 By region
- 3.7.2 By Stabilization Technology
- 3.8 Future market trends
- 3.9 Technology and Innovation landscape
- 3.9.1 Current technological trends
- 3.9.2 Emerging technologies
- 3.10 Patent Landscape
- 3.11 Trade statistics (HS code)
- 3.11.1 Major importing countries
- 3.11.2 Major exporting countries
- 3.12 Sustainability and environmental aspects
- 3.12.1 Sustainable practices
- 3.12.2 Waste reduction strategies
- 3.12.3 Energy efficiency in production
- 3.12.4 Eco-friendly initiatives
- 3.13 Carbon footprint consideration
Chapter 4 Competitive Landscape, 2025
- 4.1 Introduction
- 4.2 Company market share analysis
- 4.2.1 By region
- 4.2.1.1 North America
- 4.2.1.2 Europe
- 4.2.1.3 Asia Pacific
- 4.2.1.4 LATAM
- 4.2.1.5 MEA
- 4.2.1 By region
- 4.3 Company matrix analysis
- 4.4 Competitive analysis of major market players
- 4.5 Competitive positioning matrix
- 4.6 Key developments
- 4.6.1 Mergers & acquisitions
- 4.6.2 Partnerships & collaborations
- 4.6.3 New Product Launches
- 4.6.4 Expansion Plans
Chapter 5 Market Estimates and Forecast, By Stabilization Technology, 2022-2035 (USD Billion)
- 5.1 Key trends
- 5.2 Urease Inhibitor
- 5.3 Nitrification Inhibitor
- 5.4 Dual Inhibitor
- 5.5 Others
Chapter 6 Market Estimates and Forecast, By Physical Form, 2022-2035 (USD Billion)
- 6.1 Key trends
- 6.2 Granular Stabilization Urea
- 6.3 Prilled Stabilization Urea
- 6.4 Liquid/Solution Stabilization Urea
- 6.5 Others
Chapter 7 Market Estimates and Forecast, By Application, 2022-2035 (USD Billion)
- 7.1 Key trends
- 7.2 Broadcast/Soil Application
- 7.3 Fertigation
- 7.4 Foliar Application
- 7.5 Others
Chapter 8 Market Estimates and Forecast, By Form, 2022-2035 (USD Billion)
- 8.1 Key trends
- 8.2 Dry
- 8.3 Liquid
Chapter 9 Market Estimates and Forecast, By Region, 2022-2035 (USD Billion)
- 9.1 Key trends
- 9.2 North America
- 9.2.1 U.S.
- 9.2.2 Canada
- 9.3 Europe
- 9.3.1 Germany
- 9.3.2 UK
- 9.3.3 France
- 9.3.4 Spain
- 9.3.5 Italy
- 9.3.6 Rest of Europe
- 9.4 Asia Pacific
- 9.4.1 China
- 9.4.2 India
- 9.4.3 Japan
- 9.4.4 Australia
- 9.4.5 South Korea
- 9.4.6 Rest of Asia Pacific
- 9.5 Latin America
- 9.5.1 Brazil
- 9.5.2 Mexico
- 9.5.3 Argentina
- 9.5.4 Rest of Latin America
- 9.6 Middle East and Africa
- 9.6.1 Saudi Arabia
- 9.6.2 South Africa
- 9.6.3 UAE
- 9.6.4 Rest of Middle East and Africa
Chapter 10 Company Profiles
- 10.1 BASF SE
- 10.2 Koch Agronomic Services
- 10.3 Corteva Agriscience
- 10.4 Yara International ASA
- 10.5 SKW Stickstoffwerke Piesteritz GmbH
- 10.6 ICL Group
- 10.7 Tessenderlo Group
- 10.8 AgXplore International, LLC
- 10.9 Loveland Products, Inc.
- 10.10 J.R. Simplot Company
- 10.11 Helena Agri-Enterprises, LLC


