

|
시장보고서
상품코드
2101649
커피 및 코코아 추적성 시장 기회, 성장 촉진요인, 업계 동향 분석 및 예측(2026-2035년)Coffee and Cocoa Traceability Market Opportunity, Growth Drivers, Industry Trend Analysis, and Forecast 2026 - 2035 |
||||||

세계의 커피 및 코코아 추적성 시장은 2025년에 4억 8,850만 달러 규모에 달하고, 2035년까지 CAGR 15.6%로 성장하여 23억 달러에 달할 것으로 추정됩니다.

커피 및 코코아 추적성(Traceability)이란, 서아프리카나 라틴아메리카 등의 지역에 있는 소규모 생산자와 전 세계의 로스터, 무역업자, 소매 바이어를 연결하는 디지털 플랫폼, 검증 시스템, 서비스 프레임워크로 구성된 생태계를 의미합니다. 이러한 시스템은 모바일 단말기를 활용한 위치 정보 매핑부터 엔터프라이즈급 SaaS 플랫폼, 블록체인을 활용한 인증 시스템에 이르기까지 다양한 도구를 사용하여 밸류체인의 각 단계에서 제품의 원산지, 소유권 이전, 규정 준수 현황을 기록하고 검증합니다. 시장 확대는 규제 집행과 프리미엄 시장에서의 포지셔닝이 융합되면서 큰 영향을 받고 있습니다. 주요 수입 지역에서 엄격한 산림 파괴 방지 규정 준수 요건이 도입됨에 따라, 농장 수준의 추적성은 시장 진입을 위한 필수 요건이 되었습니다. 동시에 스페셜티 커피와 고급 코코아 제품에 대한 수요가 증가함에 따라 원산지 투명성은 단순한 규정 준수 요건에서 상업적 차별화 요인으로 승화되었으며, 자발적인 시장에서도 그 도입이 촉진되고 있습니다. 그 결과, 규제 준수와 브랜드 차원의 지속가능성 노력을 모두 확보하기 위해 협동조합, 수출업체, 가공업체, 그리고 전 세계 바이어들 사이에서 추적성 솔루션의 통합이 점점 더 진행되고 있습니다.
| 시장 범위 | |
|---|---|
| 시작 연도 | 2025년 |
| 예측 기간 | 2026-2035년 |
| 시작 시점 시장 규모 | 4억 8,850만 달러 |
| 예측액 | 23억 달러 |
| CAGR | 15.6% |
플랫폼·소프트웨어 부문은 2025년에 2억 2,960만 달러의 시장 규모를 기록했으며, 2026년부터 2035년까지 연평균 성장률(CAGR) 17.8%로 성장할 것으로 전망됩니다. 이 부문은 추적성 생태계의 핵심이 되는 디지털 계층을 담당하며, 현장 수준의 데이터 수집 도구, 인증 데이터베이스, 물류 시스템의 데이터를 통합하여 통일된 보고 체계를 구축하고 있습니다. 이러한 플랫폼은 기업 사용자와 규제 당국 모두를 대상으로 규정 준수 관련 문서, ESG 보고서, 위험 분석을 생성합니다. 이 부문은 정기적인 구독형 수익 모델과, 단일 디지털 프레임워크 내에서 다국적 기업 및 소규모 농가 네트워크 전체에 서비스를 제공할 수 있는 확장 가능한 클라우드 인프라의 혜택을 받고 있습니다.
커피 부문은 2025년에 51%의 점유율을 차지하고 있으며, 2035년까지 연평균 성장률(CAGR) 14.8%로 성장할 것으로 예측됩니다. 커피 분야의 추적성 수요는 아라비카종, 로부스타종은 물론 스페셜티 커피 및 싱글 오리진과 같은 카테고리까지 확대되고 있습니다. 아라비카 품종의 공급망에서는 특히 라틴아메리카와 동아프리카에서 문서화 기준이 시장 접근 요건과 밀접하게 연결되어 있기 때문에 인증된 프리미엄 수출 채널에서 추적성 시스템이 널리 활용되고 있습니다. 로부스타 생산 지역에서는 규정 준수 의무가 확대됨에 따라 도입이 가속화되고 있습니다. 특히 베트남이나 인도네시아와 같은 주요 수출국에서는 대규모 생산이 산림 벌채나 유럽의 수입 기준에 연동된 실사 요건의 대상이 되는 사례가 증가하고 있습니다.
북미의 커피 및 코코아 추적성 시장은 기업의 지속가능성 노력 강화와 공급망 투명성에 대한 기대감 고조에 힘입어 2035년까지 5억 3,080만 달러에 달할 것으로 예상됩니다. 이 지역의 수요는 주로 소매 및 외식 산업 네트워크에서 사업을 전개하는 식음료 기업들에 의해 주도되고 있으며, 이들 기업은 산림 파괴 없는 조달 정책, 공급업체의 규정 준수 체계, 그리고 보다 광범위한 ESG 보고 요건을 지원하기 위해 추적성 시스템을 도입하고 있습니다. 다른 지역에 비해 규제 압력은 그다지 직접적이지는 않지만, 이해관계자들의 감시가 강화되고 브랜드의 설명 책임이 커짐에 따라 밸류체인 전반에 걸친 도입이 가속화되고 있습니다.
자주 묻는 질문
목차
제1장 조사 방법과 범위
제2장 주요 요약
제3장 업계 인사이트
제4장 경쟁 구도
제5장 시장 추정 및 예측 : 제공 형태별, 2022-2035년
제6장 시장 추정 및 예측 : 상품별, 2022-2035년
제7장 시장 추정 및 예측 : 최종사용자별, 2022-2035년
제8장 시장 추정 및 예측 : 지역별, 2022-2035년
제9장 기업 개요
KSM 26.08.05The Global Coffee & Cocoa Traceability Market was valued at USD 488.5 million in 2025 and is estimated to grow at a CAGR of 15.6% to reach USD 2.3 billion by 2035.
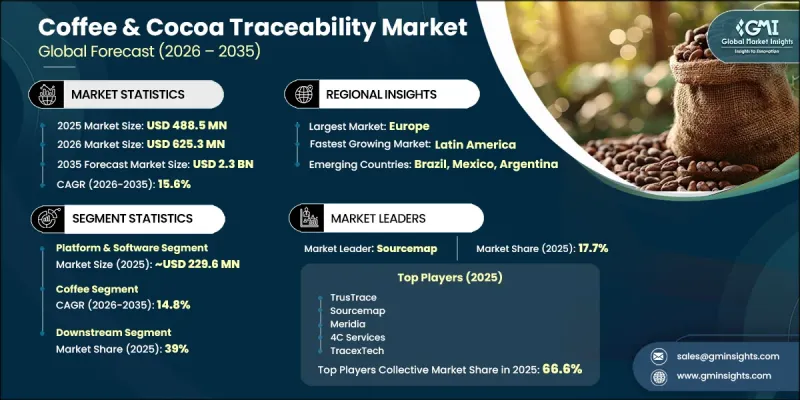
Coffee and cocoa traceability refers to the ecosystem of digital platforms, verification systems, and service frameworks that connect smallholder producers in regions such as West Africa and Latin America with global roasters, traders, and retail buyers. These systems document and validate product origin, custody transitions, and compliance status at each stage of the value chain, using tools that range from mobile-based geolocation mapping to enterprise-grade SaaS platforms and blockchain-enabled certification systems. Market expansion is being strongly influenced by the convergence of regulatory enforcement and premium market positioning. The implementation of strict deforestation compliance requirements in major importing regions has made farm-level traceability a mandatory component of market access. At the same time, rising demand for specialty coffee and fine cocoa products has elevated origin transparency from a compliance requirement to a commercial differentiator, reinforcing adoption even in voluntary markets. As a result, traceability solutions are increasingly integrated across cooperatives, exporters, processors, and global buyers to ensure both regulatory alignment and brand-level sustainability commitments.
| Market Scope | |
|---|---|
| Start Year | 2025 |
| Forecast Year | 2026-2035 |
| Start Value | $488.5 Million |
| Forecast Value | $2.3 Billion |
| CAGR | 15.6% |
The platform & software segment was valued at USD 229.6 million in 2025 and is projected to grow at a CAGR of 17.8% from 2026 to 2035. This segment represents the central digital layer of the traceability ecosystem, integrating data from field-level collection tools, certification databases, and logistics systems into unified reporting structures. These platforms generate compliance documentation, ESG reports, and risk analytics for both corporate users and regulatory bodies. The segment benefits from recurring subscription-based revenue models and scalable cloud infrastructure that enables service delivery across multinational enterprises and smallholder farming networks within a single digital framework.
The coffee segment held a 51% share in 2025 and is projected to grow at a CAGR of 14.8% through 2035. Demand for traceability in coffee spans Arabica, Robusta, and specialty or single-origin categories. In Arabica supply chains, traceability systems are widely used in certified and premium export channels, particularly across Latin America and East Africa, where documentation standards are closely tied to market access requirements. In Robusta-producing regions, adoption is accelerating as compliance obligations expand, especially in major exporting countries such as Vietnam and Indonesia, where large-scale production is increasingly subject to deforestation and due diligence requirements tied to European import standards.
North America Coffee & Cocoa Traceability Market is expected to reach USD 530.8 million by 2035, supported by growing corporate sustainability commitments and evolving supply chain transparency expectations. Demand in the region is primarily driven by food and beverage companies operating across retail and food service networks, which are adopting traceability systems to support deforestation-free sourcing policies, supplier compliance frameworks, and broader ESG reporting requirements. Although regulatory pressure is less direct compared to other regions, increasing stakeholder scrutiny and brand accountability are accelerating adoption across the value chain.
Major players operating in the global coffee & cocoa traceability industry include 4C Services, Agrolinking (AgTrail), Bunachain, Coolx, Corgo, GeoCertify, ICE CoT (IBA), Meridia (Meridia Verify), Monitys, Open Food Chain, Palmyra Ecosystem, Sourcemap, TracexTech, and TrusTrace. Companies in the coffee & cocoa traceability market are focusing on expanding digital platform capabilities that integrate geolocation, certification, and logistics data into unified systems. Many players are investing in blockchain-enabled verification tools to enhance data integrity and strengthen trust across complex supply chains. Strategic partnerships with cooperatives, exporters, and global food brands are being prioritized to expand platform adoption at origin. Firms are also emphasizing SaaS-based subscription models to ensure recurring revenue and scalable deployment across multiple regions. Mobile-first data collection tools are being developed to improve accessibility for smallholder farmers with limited infrastructure. In addition, companies are aligning their solutions with regulatory frameworks and ESG reporting standards to support compliance-driven demand while also targeting premium market segments that require verified origin and sustainability documentation for product differentiation.
Table of Contents
Chapter 1 Methodology & Scope
- 1.1 Market scope and definition
- 1.2 Research design
- 1.2.1 Research approach
- 1.2.2 Data collection methods
- 1.3 Data mining sources
- 1.3.1 Global
- 1.3.2 Regional/Country
- 1.4 Base estimates and calculations
- 1.4.1 Base year calculation
- 1.4.2 Key trends for market estimation
- 1.5 Primary research and validation
- 1.5.1 Primary sources
- 1.6 Forecast model
- 1.7 Research assumptions and limitations
Chapter 2 Executive Summary
- 2.1 Industry 360° synopsis
- 2.2 Key market trends
- 2.2.1 Offering type
- 2.2.2 Commodity
- 2.2.3 End User
- 2.2.4 Regional
- 2.3 TAM Analysis, 2026-2035
- 2.4 CXO perspectives: Strategic imperatives
- 2.5 Future outlook and strategic recommendations
Chapter 3 Industry Insights
- 3.1 Industry ecosystem analysis
- 3.1.1 Supplier landscape
- 3.1.2 Profit margin
- 3.1.3 Value addition at each stage
- 3.1.4 Factor affecting the value chain
- 3.1.5 Disruptions
- 3.2 Industry impact forces
- 3.2.1 Growth drivers
- 3.2.2 Industry pitfalls and challenges
- 3.2.3 Market opportunities
- 3.3 Growth potential analysis
- 3.4 Regulatory landscape
- 3.4.1 North America
- 3.4.2 Europe
- 3.4.3 Asia Pacific
- 3.4.4 Latin America
- 3.4.5 Middle East & Africa
- 3.5 Porter’s analysis
- 3.6 PESTEL analysis
- 3.7 Technology and innovation landscape
- 3.7.1 Current technological trends
- 3.7.2 Emerging technologies
- 3.8 Price trends
- 3.8.1 By region
- 3.8.2 By tag technology
- 3.9 Future market trends
- 3.10 Patent landscape
- 3.11 Trade statistics (HS code)
- 3.11.1 Major importing countries
- 3.11.2 Major exporting countries
- 3.12 Sustainability and environmental aspects
- 3.12.1 Sustainable practices
- 3.12.2 Waste reduction strategies
- 3.12.3 Energy efficiency in production
- 3.12.4 Eco-friendly initiatives
- 3.13 Carbon footprint consideration
Chapter 4 Competitive Landscape, 2025
- 4.1 Introduction
- 4.2 Company market share analysis
- 4.2.1 By region
- 4.2.1.1 North America
- 4.2.1.2 Europe
- 4.2.1.3 Asia Pacific
- 4.2.1.4 LATAM
- 4.2.1.5 MEA
- 4.2.1 By region
- 4.3 Company matrix analysis
- 4.4 Competitive analysis of major market players
- 4.5 Competitive positioning matrix
- 4.6 Key developments
- 4.6.1 Mergers & acquisitions
- 4.6.2 Partnerships & collaborations
- 4.6.3 New product launches
- 4.6.4 Expansion plans
Chapter 5 Market Estimates and Forecast, By Offering Type, 2022–2035 (USD Million)
- 5.1 Key trends
- 5.2 Platform & software
- 5.3 Hardware & sensing devices
- 5.4 Professional services
Chapter 6 Market Estimates and Forecast, By Commodity, 2022–2035 (USD Million)
- 6.1 Key trends
- 6.2 Coffee
- 6.2.1 Arabica
- 6.2.2 Robusta
- 6.2.3 Specialty & single-origin
- 6.3 Cocoa
- 6.3.1 Bulk cocoa
- 6.3.2 Fine flavor & single-origin
- 6.3.3 Certified organic
Chapter 7 Market Estimates and Forecast, By End User, 2022–2035 (USD Million)
- 7.1 Key trends
- 7.2 Upstream
- 7.2.1 Smallholder farmers
- 7.2.2 Cooperatives & farmer groups
- 7.2.3 Wet mills / fermentation centers
- 7.3 Midstream
- 7.3.1 Origin exporters & processors
- 7.3.2 Intl commodity traders
- 7.4 Downstream
- 7.4.1 Roasters & blenders
- 7.4.2 Chocolate & confectionery manufacturers
- 7.4.3 Consumer brands & private label
- 7.4.4 Food service & specialty retailers
- 7.5 Certifiers & regulatory bodies
Chapter 8 Market Estimates and Forecast, By Region, 2022–2035 (USD Million) (Kilo Tons)
- 8.1 Key trends
- 8.2 North America
- 8.2.1 U.S.
- 8.2.2 Canada
- 8.3 Europe
- 8.3.1 Germany
- 8.3.2 UK
- 8.3.3 France
- 8.3.4 Spain
- 8.3.5 Italy
- 8.3.6 Rest of Europe
- 8.4 Asia Pacific
- 8.4.1 China
- 8.4.2 India
- 8.4.3 Japan
- 8.4.4 Australia
- 8.4.5 South Korea
- 8.4.6 Rest of Asia Pacific
- 8.5 Latin America
- 8.5.1 Brazil
- 8.5.2 Mexico
- 8.5.3 Argentina
- 8.5.4 Rest of Latin America
- 8.6 Middle East and Africa
- 8.6.1 Saudi Arabia
- 8.6.2 South Africa
- 8.6.3 UAE
- 8.6.4 Rest of Middle East and Africa
Chapter 9 Company Profiles
- 9.1 4c services
- 9.2 Agrolinking (agtrail)
- 9.3 Bunachain
- 9.4 Coolx
- 9.5 Corgo
- 9.6 Geocertify
- 9.7 Ice cot (iba)
- 9.8 Meridia (meridia verify)
- 9.9 Monitys
- 9.10 Open food chain
- 9.11 Palmyra ecosystem
- 9.12 Sourcemap
- 9.13 Tracextech
- 9.14 Trustrace

(주말 및 공휴일 제외)


