

|
시장보고서
상품코드
2101880
나노포토닉스 시장 기회, 성장 촉진요인, 업계 동향 분석 및 예측(2026-2035년)Nanophotonics Market Opportunity, Growth Drivers, Industry Trend Analysis, and Forecast 2026 - 2035 |
||||||

세계의 나노포토닉스 시장은 2025년에 168억 달러 규모에 달하고, 2035년까지 CAGR 12.2%로 성장하여 539억 달러에 달할 것으로 추정됩니다.
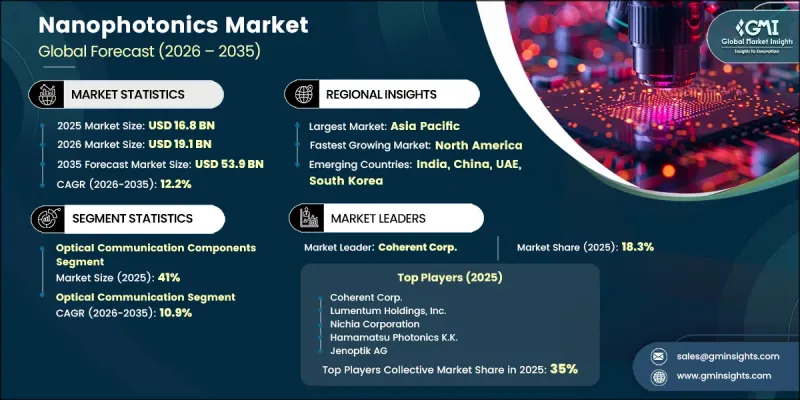
통신 네트워크, 포토닉 집적회로, 차세대 디스플레이 용도 등에서 각 업계가 첨단 광학 기술을 점점 더 많이 채택함에 따라 시장은 성장을 거듭하고 있습니다. 고속 데이터 전송에 대한 수요 증가, 인공지능(AI) 기반 시스템에 따른 계산 요구 사항의 증가, 그리고 집적 포토닉스 기술의 상용화가 진행되고 있는 점이 시장 확대를 위한 큰 기회를 창출하고 있습니다. 나노포토닉스는 나노스케일 수준에서 반도체 기술과 포토닉스 기술을 결합함으로써, 더 소형이고 고속이며 에너지 효율이 뛰어난 광학 솔루션의 개발을 가능하게 하고 있습니다. 기존의 광학 어셈블리에서 집적 포토닉스 플랫폼으로의 전환을 통해, 여러 응용 분야에서 성능 효율이 향상되는 동시에 운영 비용이 절감되고 있습니다. 의료, 자동차 시스템, 에너지 분야에서의 광 센싱 기술 채택 확대 또한 시장 발전에 더욱 기여하고 있습니다. 에너지 효율이 높은 컴퓨팅 인프라에 대한 관심이 높아지고 있는 점도 실리콘 포토닉스 및 첨단 광 인터커넥트 솔루션에 대한 투자를 가속화하고 있습니다. 더 큰 대역폭과 데이터 처리 효율 향상에 대한 수요가 계속 증가하는 가운데, 나노포토닉스는 미래의 통신 및 컴퓨팅 아키텍처를 뒷받침하는 필수적인 기술 분야로 자리매김하고 있습니다.
| 시장 범위 | |
|---|---|
| 시작 연도 | 2025년 |
| 예측 기간 | 2026-2035년 |
| 시작 시점 시장 규모 | 168억 달러 |
| 예측액 | 539억 달러 |
| CAGR | 12.2% |
2025년, 광통신 부품 부문은 41%의 점유율을 차지했습니다. 이 부문에는 실리콘 포토닉 트랜시버, InP 기반 광부품, 전기 흡수 변조 레이저, 분포형 피드백 레이저 솔루션, 기타 집적 포토닉 소자 등 통신 인프라에서 사용되는 다양한 첨단 광기술이 포함됩니다. 고성능 광네트워크, 첨단 데이터센터 인프라, 차세대 통신 시스템의 도입 확대가 이러한 부품에 대한 수요를 지속적으로 견인하고 있습니다.
광통신 애플리케이션 분야는 2025년에 56%의 점유율을 차지했으며, 2026년부터 2035년까지 연평균 성장률(CAGR) 10.9%로 성장할 것으로 전망됩니다. 이 부문은 데이터 전송 네트워크, 지역 광통신 시스템, 장거리 연결 인프라, 무선 통신 애플리케이션 등 다양한 통신 환경에서 널리 채택되고 있어 주도적인 위치를 유지하고 있습니다. 더 높은 전송 용량과 첨단 광네트워크 솔루션에 대한 수요 증가가 포토닉스 기술에 대한 지속적인 투자를 뒷받침하고 있습니다. 데이터 전송 속도의 향상에 따라 가동되는 첨단 파장 기반 전송 시스템은 계속해서 수익 창출에 크게 기여하고 있으며, Coherent Corp. 및 Lumentum Holdings와 같은 기업들이 광학 부품 및 네트워크 솔루션을 통해 상용화를 지원하고 있습니다.
북미의 나노포토닉스 시장은 2025년에 31.5%의 점유율을 차지했으며, 2026년부터 2035년까지 연평균 성장률(CAGR) 9.6%로 성장할 것으로 전망됩니다. 이 지역은 인공지능(AI) 인프라 개발, 광기술 혁신, 그리고 포토닉 부품 제조의 주요 거점으로 자리 잡고 있습니다. 시장 성장은 첨단 컴퓨팅 인프라에 대한 적극적인 투자와 고성능 광 네트워크 솔루션에 대한 수요 증가에 힘입고 있습니다. 주요 클라우드 서비스 제공업체와 대규모 데이터센터 사업자의 존재로 인해, 이 지역 전체에서 실리콘 포토닉스, 광 트랜시버 및 첨단 통신 부품에 대한 큰 수요가 지속적으로 창출되고 있습니다.
자주 묻는 질문
목차
제1장 조사 방법과 범위
제2장 주요 요약
제3장 업계 인사이트
제4장 경쟁 구도
제5장 시장 규모 및 예측 : 제품 유형별, 2022-2035년
제6장 시장 규모 및 예측 : 용도별, 2022-2035년
제7장 시장 규모 및 예측 : 최종 이용 산업별, 2022-2035년
제8장 시장 규모 및 예측 : 지역별, 2022-2035년
제9장 기업 개요
KSM 26.08.05The Global Nanophotonics Market was valued at USD 16.8 billion in 2025 and is estimated to grow at a CAGR of 12.2% to reach USD 53.9 billion by 2035.
The market is experiencing growth as industries increasingly adopt advanced optical technologies across communication networks, photonic integrated circuits, and next-generation display applications. Rising demand for high-speed data transmission, increasing computational requirements from artificial intelligence-driven systems, and the growing commercialization of integrated photonic technologies are creating significant opportunities for market expansion. Nanophotonics is enabling the development of smaller, faster, and more energy-efficient optical solutions by combining semiconductor and photonic technologies at the nanoscale level. The transition from conventional optical assemblies toward integrated photonic platforms is improving performance efficiency while reducing operational costs across multiple applications. Growing adoption of optical sensing technologies in healthcare, automotive systems, and energy applications is further contributing to market development. The increasing focus on energy-efficient computing infrastructure is also accelerating investments in silicon photonics and advanced optical interconnect solutions. As demand for greater bandwidth capacity and improved data processing efficiency continues to rise, nanophotonics is becoming an essential technology area supporting future communication and computing architectures.
| Market Scope | |
|---|---|
| Start Year | 2025 |
| Forecast Year | 2026-2035 |
| Start Value | $16.8 Billion |
| Forecast Value | $53.9 Billion |
| CAGR | 12.2% |
The optical communication components segment held 41% share in 2025. This segment includes various advanced optical technologies used in communication infrastructure, such as silicon photonic transceivers, InP-based optical components, electro-absorption modulated lasers, distributed-feedback laser solutions, and other integrated photonic devices. Increasing deployment of high-performance optical networks, advanced data center infrastructure, and next-generation communication systems continues to drive demand for these components.
The optical communication application segment accounted for 56% share in 2025 and is expected to grow at a CAGR of 10.9% throughout 2026-2035. The segment maintains its leading position due to broad adoption across multiple communication environments, including data transmission networks, regional optical systems, long-distance connectivity infrastructure, and wireless communication applications. Increasing demand for higher transmission capacity and advanced optical networking solutions is supporting continued investment in photonic technologies. Advanced wavelength-based transmission systems operating at increasing data rates continue to contribute significantly to revenue generation, with companies such as Coherent Corp. and Lumentum Holdings supporting commercial development through optical components and networking solutions.
North America Nanophotonics Market accounted for 31.5% share in 2025 and is projected to grow at a CAGR of 9.6% during 2026-2035. The region represents a major center for artificial intelligence infrastructure development, optical technology innovation, and photonic component manufacturing. Market growth is supported by strong investments in advanced computing infrastructure and increasing demand for high-performance optical networking solutions. The presence of major cloud service providers and large-scale data center operators continues to create significant demand for silicon photonics, optical transceivers, and advanced communication components across the region.
Major companies operating in the global nanophotonics industry include Intel Corporation, Samsung Electronics Co., Ltd., Lumentum Holdings, Inc., Coherent Corp., Hamamatsu Photonics K.K., IPG Photonics Corporation, Nichia Corporation, Seoul Semiconductor Co., Ltd., and Jenoptik AG. Companies operating in the nanophotonics market are strengthening their market presence through continuous innovation, strategic partnerships, and expansion of advanced optical technology portfolios. Industry participants are investing heavily in research and development to improve photonic integration, energy efficiency, and communication performance. Businesses are focusing on developing advanced optical components that support artificial intelligence infrastructure, high-speed networking, and emerging technology applications. Strategic collaborations with technology providers, investments in manufacturing capabilities, and expansion into new application areas are helping companies improve their competitive position. Manufacturers are also prioritizing product miniaturization, enhanced reliability, and improved performance to address evolving customer requirements.
Table of Contents
Chapter 1 Methodology & Scope
- 1.1 Research approach
- 1.2 Quality commitments
- 1.2.1 GMI AI policy & data integrity commitment
- 1.2.1.1 Source consistency protocol
- 1.2.1 GMI AI policy & data integrity commitment
- 1.3 Research trail & confidence scoring
- 1.3.1 Research trail components
- 1.3.2 Scoring components
- 1.4 Data collection
- 1.4.1 Partial list of primary sources
- 1.5 Data mining sources
- 1.5.1 Paid sources
- 1.5.1.1 Sources, by region
- 1.5.1 Paid sources
- 1.6 Base estimates and calculations
- 1.6.1 Base year calculation for any one approach
- 1.7 Market estimates & forecasts parameters
- 1.8 Forecast model
- 1.8.1 Quantified market impact analysis
- 1.8.1.1 Mathematical impact of growth parameters on forecast
- 1.8.1 Quantified market impact analysis
- 1.9 Research transparency addendum
- 1.9.1 Source attribution framework
- 1.9.2 Quality assurance metrics
- 1.9.3 Our commitment to trust
- 1.10 Market definitions
Chapter 2 Executive Summary
- 2.1 Industry synopsis, 2022 - 2035
- 2.1.1 Product type trends
- 2.1.2 Application trends
- 2.1.3 End-user industry trends
- 2.1.4 Regional trends
Chapter 3 Industry Insights
- 3.1 Industry ecosystem analysis
- 3.2 Industry impact forces
- 3.2.1 Growth drivers
- 3.2.1.1 AI infrastructure increases demand for high-speed optical interconnects
- 3.2.1.2 Growing hyperscale data centers require energy-efficient photonics
- 3.2.1.3 5G/6G networks accelerate integrated photonic component deployment
- 3.2.1.4 Rising biomedical diagnostics adopt nanoscale optical sensing technologies
- 3.2.2 Industry pitfalls and challenges
- 3.2.2.1 Complex nanofabrication increases manufacturing costs
- 3.2.2.2 Material integration limits large-scale commercial production
- 3.2.3 Market opportunities
- 3.2.3.1 Co-packaged optics expands silicon photonics deployment
- 3.2.3.2 Integrated quantum photonics enables next-generation computing
- 3.2.1 Growth drivers
- 3.3 Growth potential analysis
- 3.4 Regulatory landscape (Driven by primary research)
- 3.4.1 North America
- 3.4.2 Europe
- 3.4.3 Asia Pacific
- 3.4.4 Latin America
- 3.4.5 MEA
- 3.5 Technology landscape
- 3.5.1 Current technological trends
- 3.5.2 Emerging technologies
- 3.6 Pricing trend analysis (Driven by primary research)
- 3.7 Future market trends
- 3.8 Patent analysis
- 3.9 Porter's analysis
- 3.10 PESTEL analysis
- 3.11 Impact of AI and Generative AI on the market (Driven by primary research)
- 3.12 Value chain analysis (Driven by primary research)
- 3.13 Investment & funding analysis (Driven by primary research)
- 3.14 Consumer insights (Driven by primary research)
Chapter 4 Competitive Landscape, 2025
- 4.1 Introduction
- 4.2 Company market share analysis, by region, 2025
- 4.2.1 North America
- 4.2.2 Europe
- 4.2.3 Asia Pacific
- 4.2.4 Middle East & Africa
- 4.2.5 Latin America
- 4.3 Key developments
- 4.3.1 Key partnerships & collaborations
- 4.3.2 Major M&A activities
- 4.3.3 Product innovations & launches
- 4.3.4 Market expansion strategies
- 4.4 Competitive positioning matrix
Chapter 5 Market Size and Forecast, By Product Type, 2022 - 2035 (USD Million)
- 5.1 Key trends
- 5.2 Nanophotonic display & light emission devices
- 5.2.1 Micro-LEDs & nano-LEDs
- 5.2.2 OLEDs
- 5.3 Optical communication components
- 5.3.1 Optical amplifiers
- 5.3.2 Optical switches
- 5.4 Photonic integrated circuits (PICs)
- 5.5 Nanophotonic sensors
- 5.6 Nanophotonic solar cells
- 5.7 Others
Chapter 6 Market Size and Forecast, By Application, 2022 - 2035 (USD Million)
- 6.1 Key trends
- 6.2 Optical communication
- 6.3 Optical sensing & detection
- 6.4 Imaging & microscopy
- 6.5 Display & lighting
- 6.6 Energy harvesting
- 6.7 Optical computing & signal processing
- 6.8 Others
Chapter 7 Market Size and Forecast, By End-Use Industry, 2022 - 2035 (USD Million)
- 7.1 Key trends
- 7.2 Telecommunications
- 7.3 Consumer electronics
- 7.4 Healthcare & life sciences
- 7.5 Automotive
- 7.6 Aerospace & defense
- 7.7 Industrial manufacturing
- 7.8 Energy
- 7.9 Others
Chapter 8 Market Size and Forecast, By Region, 2022 - 2035 (USD Million)
- 8.1 Key trends
- 8.2 North America
- 8.2.1 U.S.
- 8.2.2 Canada
- 8.3 Europe
- 8.3.1 Germany
- 8.3.2 France
- 8.3.3 UK
- 8.3.4 Spain
- 8.3.5 Italy
- 8.4 Asia Pacific
- 8.4.1 China
- 8.4.2 Japan
- 8.4.3 South Korea
- 8.4.4 India
- 8.4.5 Australia
- 8.5 Middle East & Africa
- 8.5.1 Saudi Arabia
- 8.5.2 UAE
- 8.5.3 South Africa
- 8.6 Latin America
- 8.6.1 Brazil
- 8.6.2 Argentina
- 8.6.3 Mexico
Chapter 9 Company Profiles
- 9.1 Intel Corporation
- 9.2 Samsung Electronics Co., Ltd.
- 9.3 Lumentum Holdings, Inc.
- 9.4 Coherent Corp.
- 9.5 Hamamatsu Photonics K.K.
- 9.6 IPG Photonics Corporation
- 9.7 Nichia Corporation
- 9.8 Seoul Semiconductor Co., Ltd.
- 9.9 Jenoptik AG
- 9.10 OLEDWorks LLC
- 9.11 Ayar Labs, Inc.
- 9.12 Agiltron Inc.
- 9.13 OpenLight Photonics
- 9.14 Ligentec SA
- 9.15 Thorlabs, Inc.
- 9.16 Nanosys, Inc.
- 9.17 Effect Photonics


