

|
시장보고서
상품코드
2109180
프랙 샌드 및 프로판트 시장 기회, 성장 촉진요인, 산업 동향 분석 및 예측(2026-2035년)Frac Sand and Proppant Market Opportunity, Growth Drivers, Industry Trend Analysis, and Forecast 2026 - 2035 |
||||||

세계의 프랙 샌드 및 프로판트 시장은 2025년에 51억 달러 규모로 평가되었고, CAGR 4.8%로 성장하여 82억 달러에 이를 것으로 추정되고 있습니다.
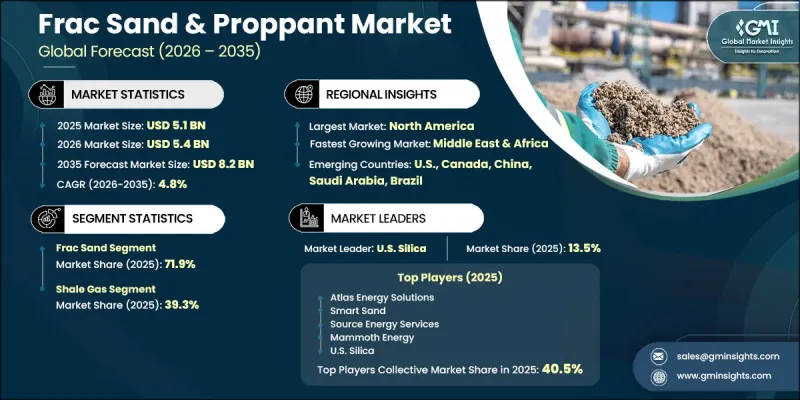
시장의 성장은 비전통적 석유 및 가스 탐사 활동 증가, 유정 완공률 상승, 그리고 유정당 프로판트 소비량 증가에 힘입고 있습니다. 수평 시추 작업의 지속적인 확대와 첨단 수압 파쇄 기술의 채택 확대가 프랙 샌드 및 고품질 프로판트 재료에 대한 안정적인 수요를 견인하고 있습니다. 또한, 고성능 프로판트의 상용화와 자동 모래 처리 기술의 향상으로 운영 효율이 개선됨과 동시에 프로판트 도입의 전반적인 가치도 높아지고 있습니다. 탐사 및 생산 기업들이 횡굴의 길이를 연장하고 더욱 집중적인 완공 전략을 지속적으로 채택함에 따라, 유정당 프로판트 사용량은 꾸준히 증가하고 있습니다. 신흥 지역에서의 비전통적 자원 개발 확대 또한 기존 생산 시장을 넘어선 추가적인 성장 기회를 창출하고 있습니다. 자원 개발 프로젝트에 대한 지속적인 투자와 시추·완공 기술의 끊임없는 최적화가 맞물려 장기적인 시장 전망을 공고히 하고 있습니다. 생산 효율 향상, 지속적인 설비 투자, 그리고 기술 발전이 어우러져 예측 기간 동안 전 세계 프랙 샌드 및 프로판트 시장이 견조하게 확대될 것으로 전망됩니다.
| 시장 범위 | |
|---|---|
| 시작 연도 | 2025년 |
| 예측 기간 | 2026-2035년 |
| 시작 연도 시장 규모 | 51억 달러 |
| 예측 금액 | 82억 달러 |
| CAGR | 4.8% |
프랙 샌드(Flack Sand) 부문은 2025년에 71.9%의 점유을을 차지했으며, 2026년부터 연평균 성장률(CAGR) 4.6%를 나타낼 것으로 전망됩니다. 이 부문이 계속해서 주도적인 위치를 유지하고 있는 이유는 운영 성과와 비용 효율성 사이에서 효과적인 균형을 제공하기 때문입니다. 광범위한 수압 파쇄 작업에서 널리 사용되는 배경에는 고품질 대체재보다 재료 비용을 낮게 유지하면서도 신뢰할 수 있는 파쇄 전도성을 확보할 수 있는 능력이 있습니다. 사업자들이 유정 완공 설계를 지속적으로 최적화하는 가운데, 여러 비전통 자원 개발 분야에서 프랙 샌드에 대한 수요는 계속해서 견조합니다.
셰일가스 용도 부문은 2025년에 39.3%의 점유율을 차지했습니다. 이 용도 부문이 주도적인 위치를 차지하고 있는 배경에는 지속적인 시추 활동, 수압 파쇄 빈도 증가, 그리고 비전통 탄화수소 생산에 대한 지속적인 투자가 있습니다. 유정당 프로판트 사용량 증가와 생산 효율의 지속적인 향상으로 인해 두 용도 부문 수요가 계속해서 뒷받침되고 있습니다.
북미의 프랙 샌드 및 프로판트 시장은 75.2%의 점유율을 차지했으며, 2026년부터 연평균 성장률(CAGR) 5%로 성장했습니다. 이 지역의 견조한 수요는 광범위한 비전통 석유 및 가스 개발, 활발한 시추 활동, 그리고 유정 완공 프로그램에 대한 지속적인 투자에 힘입어 뒷받침되고 있습니다. 수평 시추 길이 증가와 시추공 1피트당 프로판트 사용량 증가로 인해 이 지역 전체의 소비량은 지속적으로 확대되고 있으며, 이는 세계 시장에서 북미의 주도적 위치를 더욱 공고히 하고 있습니다.
자주 묻는 질문
목차
제1장 조사 방법과 범위
제2장 주요 요약
제3장 업계 인사이트
제4장 경쟁 구도
제5장 시장 규모 및 예측 : 제품별(2022-2035년)
제6장 시장 규모 및 예측 : 메시 사이즈별(2022-2035년)
제7장 시장 규모 및 예측 : 갱정 유형별(2022-2035년)
제8장 시장 규모 및 예측 : 용도별(2022-2035년)
제9장 시장 규모 및 예측 : 지역별(2022-2035년)
제10장 기업 개요
KTH 26.08.20The Global Frac Sand and Proppant Market was valued at USD 5.1 billion in 2025 and is estimated to grow at a CAGR of 4.8% to reach USD 8.2 billion by 2035.
Market growth is supported by increasing unconventional oil and gas exploration activities, higher well completion rates, and rising proppant consumption per well. The continued expansion of horizontal drilling operations and the growing adoption of advanced hydraulic fracturing techniques are driving consistent demand for frac sand and premium proppant materials. In addition, the commercialization of high-performance proppants and improvements in automated sand handling technologies are enhancing operational efficiency while increasing the overall value of proppant deployment. As exploration and production companies continue extending lateral well lengths and adopting more intensive completion strategies, proppant usage per well continues to rise steadily. Growing unconventional resource development in emerging regions is also creating additional growth opportunities beyond established producing markets. Ongoing investments in resource development projects, combined with continuous optimization of drilling and completion techniques, are strengthening long-term market prospects. The combination of increasing production efficiency, sustained capital investment, and technological advancements is expected to support healthy expansion of the global frac sand and proppant market throughout the forecast period.
| Market Scope | |
|---|---|
| Start Year | 2025 |
| Forecast Year | 2026-2035 |
| Start Value | $5.1 Billion |
| Forecast Value | $8.2 Billion |
| CAGR | 4.8% |
The frac sand segment accounted for a 71.9% share in 2025 and is anticipated to register a CAGR of 4.6% during 2026-2035. The segment continues to dominate because it offers an effective balance between operational performance and cost efficiency. Its widespread use across a broad range of hydraulic fracturing operations is supported by its ability to deliver reliable fracture conductivity while maintaining lower material costs than premium alternatives. As operators continue optimizing well completion designs, demand for frac sand remains strong across multiple unconventional resource developments.
The shale gas application segment captured a 39.3% share in 2025. The leading position of these application segments is driven by sustained drilling activity, increased hydraulic fracturing intensity, and continued investment in unconventional hydrocarbon production. Higher proppant loading per completion and ongoing improvements in production efficiency continue to support demand across both application categories.
North America Frac Sand and Proppant Market held a 75.2% share, growing at a CAGR of 5% during 2026-2035. Strong regional demand is supported by extensive unconventional oil and gas development, high drilling activity, and continuous investment in well completion programs. Increasing lateral drilling lengths and greater proppant utilization per foot of well continue to strengthen consumption levels across the region, reinforcing North America's leadership in the global market.
Key players in the Global Frac Sand and Proppant Market include Alpine Silica, Atlas Energy Solutions, Badger Mining Corporation, Baker Hughes Company, Black Mountain, CARBO Ceramics, Covia Holdings, Eagle Materials, Halliburton, Hi-Crush, Imerys, IRON OAK ENERGY SOLUTIONS, Mammoth Energy Services, NOV, Preferred Sands, Saint-Gobain, Sibelco, SLB, Smart Sand, Solaris Energy Infrastructure, Source Energy Services, U.S. Silica. Companies operating in the frac sand and proppant market are focusing on expanding production capacity, improving supply chain efficiency, and investing in advanced proppant technologies to strengthen their competitive position. Manufacturers are enhancing product portfolios with high-performance proppants while adopting automated material handling solutions that improve operational efficiency and reduce logistics costs. Strategic partnerships with exploration and production companies, long-term supply agreements, and acquisitions are helping companies secure stable revenue streams and broaden their customer base. Businesses are also investing in regional distribution networks, digital monitoring solutions, and sustainable mining practices to improve service quality and operational performance. Continuous product innovation, manufacturing optimization, and expansion into emerging energy markets further support long-term market growth and reinforce their industry leadership.
Table of Contents
Chapter 1 Methodology & Scope
- 1.1 Research approach
- 1.2 Quality commitments
- 1.2.1 GMI AI policy & data integrity commitment
- 1.2.1.1 Source consistency protocol
- 1.2.1 GMI AI policy & data integrity commitment
- 1.3 Research trail & confidence scoring
- 1.3.1 Research trail components
- 1.3.2 Scoring components
- 1.4 Data collection
- 1.4.1 Partial list of primary sources
- 1.5 Data mining sources
- 1.5.1 Paid sources
- 1.5.1.1 Sources, by region
- 1.5.1 Paid sources
- 1.6 Base estimates and calculations
- 1.6.1 Base year calculation for any one approach
- 1.7 Market estimates & forecasts parameters
- 1.8 Forecast model
- 1.8.1 Quantified market impact analysis
- 1.8.1.1 Mathematical impact of growth parameters on forecast
- 1.8.1 Quantified market impact analysis
- 1.9 Research transparency addendum
- 1.9.1 Source attribution framework
- 1.9.2 Quality assurance metrics
- 1.9.3 Our commitment to trust
- 1.10 Market definitions
Chapter 2 Executive Summary
- 2.1 Industry synopsis, 2022 - 2035
- 2.1.1 Business trends
- 2.1.2 Product trends
- 2.1.3 Mesh size trends
- 2.1.4 Well type trends
- 2.1.5 Application trends
- 2.1.6 Regional trends
Chapter 3 Industry Insights
- 3.1 Industry ecosystem analysis
- 3.1.1 Raw material availability & sourcing analysis
- 3.1.2 Manufacturing capacity assessment
- 3.1.3 Supply chain resilience & risk factors
- 3.1.4 Distribution network analysis
- 3.2 Industry impact forces
- 3.2.1 Growth drivers
- 3.2.2 Industry pitfalls & challenges
- 3.3 Regulatory landscape
- 3.4 Growth potential analysis
- 3.5 Porter's analysis
- 3.5.1 Bargaining power of suppliers
- 3.5.2 Bargaining power of buyers
- 3.5.3 Threat of new entrants
- 3.5.4 Threat of substitutes
- 3.6 PESTEL analysis
- 3.6.1 Political factors
- 3.6.2 Economic factors
- 3.6.3 Social factors
- 3.6.4 Technological factors
- 3.6.5 Legal factors
- 3.6.6 Environmental factors
- 3.7 Cost structure analysis of frac sand & proppant
- 3.8 Emerging opportunities & trends
- 3.9 Digitalization & IoT integration
- 3.10 Investment analysis & future prospects
- 3.11 Price trend analysis (USD/Tons) (Driven by Primary Research)
- 3.11.1 By region (Driven by Primary Research)
- 3.11.2 By mesh size (Driven by Primary Research)
- 3.12 Trade data analysis (Driven by Primary Research)
- 3.12.1 Import/export value trends (Driven by Primary Research)
- 3.12.2 Key trade corridors & tariff impact (Driven by Primary Research)
- 3.13 Capacity & production landscape (Driven by Primary Research)
- 3.13.1 Capacity by region & key producer (Driven by Primary Research)
- 3.13.2 Capacity utilization rates & expansion pipelines (Driven by Primary Research)
- 3.14 Impact of AI & Generative AI on the market (Driven by Primary Research)
- 3.14.1 AI-Driven production optimization (Driven by Primary Research)
- 3.14.2 Predictive maintenance & fault detection (Driven by Primary Research)
Chapter 4 Competitive Landscape, 2026
- 4.1 Introduction
- 4.2 Company market share analysis, by region, 2025
- 4.2.1 North America
- 4.2.2 Europe
- 4.2.3 Asia Pacific
- 4.2.4 Middle East & Africa
- 4.2.5 Latin America
- 4.3 Competitive analysis of major market players
- 4.4 Competitive positioning matrix
- 4.5 Key developments
- 4.5.1 Mergers & acquisitions
- 4.5.2 Partnerships & collaborations
- 4.5.3 New product launches
- 4.5.4 Expansion plans & funding
- 4.6 Company tier benchmarking
- 4.6.1 Tier classification criteria & qualifying thresholds
- 4.6.2 Tier positioning matrix by revenue, geography & innovation
Chapter 5 Market Size and Forecast, By Product, 2022 - 2035 (USD Million & Tons)
- 5.1 Key trends
- 5.2 Frac sand
- 5.3 Resin-coated proppant
- 5.4 Ceramic proppant
- 5.5 Others
Chapter 6 Market Size and Forecast, By Mesh Size, 2022 - 2035 (USD Million & Tons)
- 6.1 Key trends
- 6.2 20/40 mesh
- 6.3 30/50 mesh
- 6.4 40/70 mesh
- 6.5 70/140 mesh
- 6.6 100 mesh & above
Chapter 7 Market Size and Forecast, By Well Type, 2022 - 2035 (USD Million & Tons)
- 7.1 Key trends
- 7.2 Horizontal
- 7.3 Vertical
- 7.4 Directional
Chapter 8 Market Size and Forecast, By Application, 2022 - 2035 (USD Million & Tons)
- 8.1 Key trends
- 8.2 Shale gas
- 8.3 Tight oil
- 8.4 Tight gas
- 8.5 Coal bed methane (CBM)
- 8.6 Conventional reservoirs
- 8.7 Others
Chapter 9 Market Size and Forecast, By Region, 2022 - 2035 (USD Million & Tons)
- 9.1 Key trends
- 9.2 North America
- 9.2.1 U.S.
- 9.2.2 Canada
- 9.2.3 Mexico
- 9.3 Europe
- 9.3.1 UK
- 9.3.2 Germany
- 9.3.3 France
- 9.3.4 Italy
- 9.3.5 Spain
- 9.3.6 Netherlands
- 9.3.7 Norway
- 9.3.8 Denmark
- 9.4 Asia Pacific
- 9.4.1 China
- 9.4.2 India
- 9.4.3 Japan
- 9.4.4 South Korea
- 9.4.5 Australia
- 9.4.6 Indonesia
- 9.4.7 Malaysia
- 9.4.8 Thailand
- 9.5 Middle East & Africa
- 9.5.1 Saudi Arabia
- 9.5.2 UAE
- 9.5.3 Qatar
- 9.5.4 Kuwait
- 9.5.5 Oman
- 9.5.6 Egypt
- 9.5.7 Algeria
- 9.5.8 Nigeria
- 9.5.9 South Africa
- 9.6 Latin America
- 9.6.1 Brazil
- 9.6.2 Argentina
- 9.6.3 Colombia
- 9.6.4 Peru
Chapter 10 Company Profiles
- 10.1 Alpine Silica
- 10.2 Atlas Energy Solutions
- 10.3 Badger Mining Corporation
- 10.4 Baker Hughes Company
- 10.5 Black Mountain
- 10.6 CARBO Ceramics
- 10.7 Covia Holdings
- 10.8 Eagle Materials
- 10.9 Halliburton
- 10.10 Hi-Crush
- 10.11 Imerys
- 10.12 IRON OAK ENERGY SOLUTIONS
- 10.13 Mammoth Energy Services
- 10.14 NOV
- 10.15 Preferred Sands
- 10.16 Saint-Gobain
- 10.17 Sibelco
- 10.18 SLB
- 10.19 Smart Sand
- 10.20 Solaris Energy Infrastructure
- 10.21 Source Energy Services
- 10.22 U.S. Silica


