

|
시장보고서
상품코드
2109184
오일 상태 모니터링 시장 비즈니스 기회, 성장요인, 업계 동향 분석 및 예측(2026-2035년)Oil Condition Monitoring Market Opportunity, Growth Drivers, Industry Trend Analysis, and Forecast 2026 - 2035 |
||||||

세계의 오일 상태 모니터링 시장은 2025년에 15억 달러로 평가되었고, CAGR 8.8%로 성장하여 2035년까지 34억 달러에 이를 것으로 추정되고 있습니다.
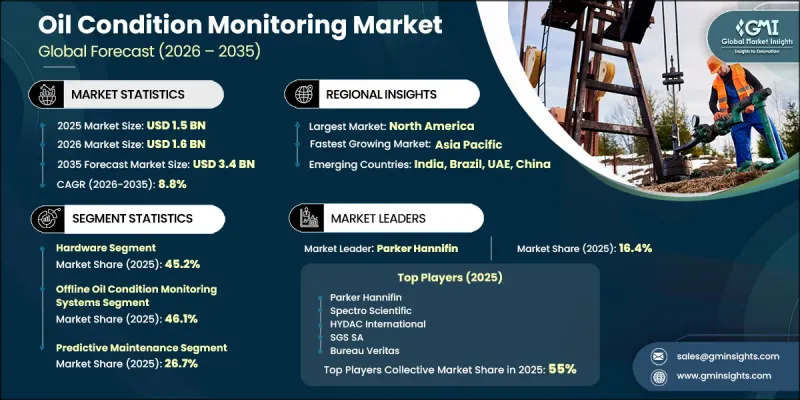
자산 집약형 산업에서 설비의 신뢰성, 운영 효율성 및 예측 유지보수 전략이 점점 더 중요해짐에 따라, 오일 상태 모니터링 시장은 성장을 거듭하고 있습니다. 제조, 에너지, 공정 산업에서 산업 자동화가 진전되고 첨단 기계의 도입이 확대됨에 따라 오일 상태 모니터링 솔루션에 대한 수요가 크게 증가하고 있습니다. 기업들은 예기치 못한 설비 고장을 최소화하고, 유지보수 비용을 절감하며, 자산의 가동 수명을 연장하기 위해 오일 상태 모니터링 기술 도입을 점점 더 확대되고 있습니다. 스마트 센서, 디지털 플랫폼, 고급 분석 기술 등 커넥티드 기술의 채택 확대는 윤활유의 성능을 보다 정확하게 모니터링할 수 있게 하여 기존의 유지보수 관행을 혁신하고 있습니다. 데이터 기반 유지보수 접근 방식을 통해 산업 운영자는 잠재적인 설비 문제를 조기에 파악하고, 전반적인 자산 관리 전략을 개선할 수 있게 되었습니다. 기업들이 생산성 향상과 가동 중단 감소를 추구하는 가운데, 상태 기반 유지보수로의 전환은 시장 확장을 뒷받침하는 중요한 요인이 되고 있습니다. 산업 전반에 걸쳐 예측 기술의 통합이 진행됨에 따라, 전 세계적으로 오일 상태 모니터링 솔루션에 대한 수요가 계속해서 견인될 것으로 예측됩니다.
| 시장 범위 | |
|---|---|
| 개시 연도 | 2025년 |
| 예측 기간 | 2026-2035년 |
| 초기 시장 규모 | 15억 달러 |
| 예측액 | 34억 달러 |
| CAGR | 8.8% |
오일 상태 모니터링 시장의 성장은 예방 정비의 중요성에 대한 산업 운영자들의 인식 제고에 힘입어 크게 가속화되고 있습니다. 윤활유 열화에 따른 설비 성능 문제는 막대한 운영 손실로 이어질 수 있으므로, 기업들은 신뢰성을 높이고 정비 위험을 줄이기 위해 모니터링 기술에 대한 투자를 적극적으로 추진하고 있습니다. 연결형 모니터링 시스템, 클라우드 기반 분석 도구, 그리고 첨단 데이터 처리 기능의 결합을 통해 조직이 윤활유 상태를 보다 효과적으로 관리할 수 있는 능력이 향상되고 있습니다. 이러한 기술의 발전으로 다양한 산업 분야에서 도입이 가속화되고 있으며, 현대적인 유지보수 프로그램에 필수적인 요소로서 오일 상태 모니터링의 역할이 강화되고 있습니다.
2025년에는 하드웨어 부문이 45.2%의 점유율을 차지했습니다. 하드웨어 구성 요소는 윤활유 성능 데이터를 수집하기 위한 주요 기반이 되므로, 이 부문은 계속해서 주도적인 위치를 유지하고 있습니다. 산업용 자산 내에 설치된 센서, 모니터링 장치 및 감지 장비를 통해 윤활유 품질과 설비 상태를 지속적으로 평가할 수 있습니다. 다양한 산업 시스템에서 하드웨어 솔루션이 폭넓게 활용됨에 따라 안정적인 수요가 지속적으로 뒷받침되고 있습니다. 또한, 모니터링 기술의 발전에 따라 설비 업그레이드, 센서 교체 및 교정 작업과 관련된 정기적인 수요가 이 부문의 지속적인 수익 창출에 기여하고 있습니다.
오프라인 오일 상태 모니터링 시스템 부문은 2025년에 46.1%의 점유율을 차지했습니다. 이 부문은 합리적인 가격, 간편한 도입 절차, 그리고 상세한 윤활유 분석이 가능하다는 점 덕분에 계속해서 채택이 확대되고 있습니다. 오프라인 모니터링 솔루션은 가동 중인 설비에서 오일 샘플을 채취하여 시험 기법을 통해 평가함으로써 윤활유의 품질과 기계 상태를 판정합니다. 이러한 시스템은 윤활유의 주요 특성을 분석하여, 운영자가 오염, 열화, 마모와 관련된 문제를 파악할 수 있도록 지원합니다. 유연성과 비용상의 이점으로 인해, 지속적인 모니터링 솔루션이 필요하지 않거나 경제적으로 현실적이지 않은 산업 분야에 적합합니다.
북미의 오일 상태 모니터링 시장은 자산 집약적 산업의 활발한 수요와 확립된 유지보수 관행에 힘입어 2025년에는 36.3%의 시장 점유율을 차지했습니다. 미국은 산업 전반에 걸쳐 첨단 모니터링 기술이 널리 채택되고 있어 지역 성장에 가장 크게 기여하는 국가입니다. 규제 체계와 설비 신뢰성에 대한 중요성이 높아짐에 따라, 조직들은 유지보수 전략에 오일 분석 프로그램을 통합하도록 장려받고 있습니다. 이러한 요인들로 인해 오일 상태 모니터링은 단순한 선택적 유지보수 기법에서 수많은 산업 시설의 핵심 운영 요건으로 그 위상이 높아지고 있습니다.
자주 묻는 질문
목차
제1장 조사 방법과 범위
제2장 주요 요약
제3장 업계 인사이트
제4장 경쟁 구도
제5장 시장 추산 및 예측 : 제공 형태별, 2022년-2035년
제6장 시장 추산 및 예측 : 제품 유형별, 2022년-2035년
제7장 시장 추산 및 예측 : 기기 유형별, 2022년-2035년
제8장 시장 추산 및 예측 : 용도별, 2022년-2035년
제9장 시장 추산 및 예측 : 최종 이용 산업별, 2022년-2035년
제10장 시장 추산 및 예측 : 지역별, 2022년-2035년
제11장 기업 개요
LSH 26.08.14The Global Oil Condition Monitoring Market was valued at USD 1.5 billion in 2025 and is estimated to grow at a CAGR of 8.8% to reach USD 3.4 billion by 2035.
The oil condition monitoring industry is witnessing growth as asset-intensive sectors increasingly prioritize equipment reliability, operational efficiency, and predictive maintenance strategies. Growing industrial automation and expanding deployment of advanced machinery across manufacturing, energy, and process industries are creating significant demand for lubricant monitoring solutions. Organizations are increasingly adopting oil condition monitoring technologies to minimize unexpected equipment failures, lower maintenance expenses, and extend asset operating life. The rising adoption of connected technologies, including smart sensors, digital platforms, and advanced analytics, is transforming traditional maintenance practices by enabling more accurate monitoring of lubricant performance. Data-driven maintenance approaches are allowing industrial operators to identify potential equipment issues earlier and improve overall asset management strategies. The shift toward condition-based maintenance is becoming a key factor supporting market expansion as companies seek greater productivity and reduced operational disruptions. Increasing integration of predictive technologies across industrial applications is expected to continue driving demand for oil condition monitoring solutions worldwide.
| Market Scope | |
|---|---|
| Start Year | 2025 |
| Forecast Year | 2026-2035 |
| Start Value | $1.5 Billion |
| Forecast Value | $3.4 Billion |
| CAGR | 8.8% |
The growth of the oil condition monitoring market is strongly supported by increasing awareness among industrial operators regarding the importance of proactive maintenance practices. Equipment performance issues associated with lubricant deterioration can result in significant operational losses, encouraging companies to invest in monitoring technologies that improve reliability and reduce maintenance risks. The combination of connected monitoring systems, cloud-based analytical tools, and advanced data processing capabilities is enhancing the ability of organizations to manage lubricant conditions more effectively. These technological advancements are accelerating adoption across multiple industries and strengthening the role of oil condition monitoring as an essential component of modern maintenance programs.
The hardware segment held a 45.2% share in 2025. This segment maintains its leading position because hardware components serve as the primary foundation for collecting lubricant performance data. Sensors, monitoring devices, and detection equipment installed within industrial assets enable continuous evaluation of oil quality and equipment conditions. The broad application of hardware solutions across various industrial systems continues to support steady demand. Additionally, recurring requirements related to equipment upgrades, sensor replacement, and calibration activities contribute to sustained revenue generation within this segment as monitoring technologies continue to evolve.
The offline oil condition monitoring systems segment captured a 46.1% share in 2025. This segment continues to gain adoption due to its affordability, straightforward implementation process, and ability to deliver detailed lubricant analysis. Offline monitoring solutions involve collecting oil samples from operating equipment and evaluating them through testing methods to assess lubricant quality and machine health. These systems analyze important oil characteristics, helping operators identify contamination, degradation, and wear-related issues. Their flexibility and cost advantages make them suitable for industries where continuous monitoring solutions may not be necessary or economically practical.
North America Oil Condition Monitoring Market accounted for a 36.3% share in 2025, supported by strong demand from asset-intensive industries and the presence of established maintenance management practices. The United States represents the largest contributor to regional growth due to widespread adoption of advanced monitoring technologies across industrial sectors. Regulatory frameworks and increasing emphasis on equipment reliability are encouraging organizations to integrate oil analysis programs into maintenance strategies. These factors are elevating oil condition monitoring from an optional maintenance approach to an important operational requirement across numerous industrial facilities.
Prominent players operating in the global oil condition monitoring market include Bureau Veritas, eralytics, Eurofins TestOil, ExxonMobil, GasTOPS, HYDAC International, ifm electronic, Intertek Group, Parker Hannifin, Poseidon Systems, Rheonics, SGS SA, Shell, Spectro Scientific, Tan Delta Systems, Veritas Petroleum Services (VPS), and WearCheck International. Companies operating in the oil condition monitoring market are strengthening their market presence by expanding technology portfolios, improving sensor capabilities, and developing advanced analytical solutions for predictive maintenance applications. Market participants are investing in research and development to enhance monitoring accuracy, data processing capabilities, and integration with digital industrial platforms. Strategic partnerships with equipment manufacturers, industrial operators, and technology providers are helping companies expand their customer base and improve solution offerings. Businesses are also focusing on cloud-based monitoring services, automation, and customized solutions to meet evolving industry requirements. Expansion into emerging markets, stronger service networks, and continuous innovation in diagnostics technologies remain key strategies for improving competitiveness, increasing customer adoption, and reinforcing long-term market positioning within the global oil condition monitoring industry.
Table of Contents
Chapter 1 Methodology and Scope
- 1.1 Market scope and definition
- 1.2 Research design
- 1.2.1 Research approach
- 1.2.2 Data collection methods
- 1.3 Data mining sources
- 1.3.1 Global
- 1.3.2 Regional/Country
- 1.4 Base estimates and calculations
- 1.4.1 Base year calculation
- 1.4.2 Key trends for market estimation
- 1.5 Primary research and validation
- 1.5.1 Primary sources
- 1.6 Forecast model
- 1.7 Research assumptions and limitations
Chapter 2 Executive Summary
- 2.1 Industry 360° synopsis, 2022 – 2035
- 2.2 Key market trends
- 2.2.1 Offering trends
- 2.2.2 Product Type trends
- 2.2.3 Equipment Type trends
- 2.2.4 Application trends
- 2.2.5 Regional trends
- 2.3 TAM Analysis, 2026-2035
- 2.4 CXO perspectives: Strategic imperatives
Chapter 3 Industry Insights
- 3.1 Industry ecosystem analysis
- 3.1.1 Supplier Landscape
- 3.1.2 Profit Margin
- 3.1.3 Cost structure
- 3.1.4 Value addition at each stage
- 3.1.5 Factor affecting the value chain
- 3.1.6 Disruptions
- 3.2 Industry impact forces
- 3.2.1 Growth drivers
- 3.2.1.1 Rising Industrial Automation and Machinery Usage
- 3.2.1.2 Increasing Focus on Reducing Equipment Downtime and Maintenance Costs
- 3.2.1.3 Expansion of Oil & Gas, Power Generation, and Manufacturing Operations
- 3.2.1.4 Growing Emphasis on Equipment Life Extension and Reliability
- 3.2.1.5 Stricter Regulatory Compliance and Environmental/Safety Standards
- 3.2.2 Industry pitfalls and challenges
- 3.2.2.1 High Costs of Advanced Monitoring Systems and Lab Testing
- 3.2.2.2 Complexity in Data Integration and Standardization
- 3.2.3 Market opportunities
- 3.2.3.1 Growing Adoption in Emerging Economies and SMEs
- 3.2.3.2 AI-Based Predictive Diagnostics and Cloud Analytics
- 3.2.1 Growth drivers
- 3.3 Growth potential analysis
- 3.4 Pricing Analysis (Driven by Primary Research)
- 3.4.1 Historical Price Trend Analysis
- 3.4.2 Pricing Strategy by Player Type (Premium / Value / Cost-plus)
- 3.5 Regulatory landscape
- 3.5.1 North America
- 3.5.2 Europe
- 3.5.3 Asia Pacific
- 3.5.4 Latin America
- 3.5.5 Middle East & Africa
- 3.6 Porter’s analysis
- 3.7 PESTEL analysis
- 3.8 Trade Data Analysis (Based on Paid Database)
- 3.8.1 Import/Export Volume & Value Trends
- 3.8.2 Key Trade Corridors & Tariff Impact
- 3.9 Impact of AI & Generative AI on the Market (Driven by Primary Research)
- 3.9.1 AI-Driven Disruption of Existing Business Models
- 3.9.2 GenAI Use Cases & Adoption Roadmap by Segment
- 3.10 Capacity & Production Landscape (Driven by Primary Research)
- 3.10.1 Production Capacity by Key Producer
- 3.10.2 Capacity Utilization Rates & Expansion Pipelines
Chapter 4 Competitive Landscape, 2025
- 4.1 Company market share analysis, 2025
- 4.1.1 By Region
- 4.1.1.1 North America
- 4.1.1.2 Europe
- 4.1.1.3 Asia-Pacific
- 4.1.1.4 Latin America
- 4.1.1.5 Middle East and Africa
- 4.1.2 Market Concentration Analysis
- 4.1.1 By Region
- 4.2 Competitive analysis of major market players
- 4.3 Competitive positioning matrix
- 4.4 Key developments
- 4.4.1 Mergers & acquisitions
- 4.4.2 Partnerships & collaborations
- 4.4.3 New product launches
- 4.4.4 Expansion plans and funding
- 4.5 Company tier benchmarking
- 4.5.1 Tier classification criteria & qualifying thresholds
- 4.5.2 Tier positioning matrix by revenue, geography & innovation
Chapter 5 Market Estimates and Forecast, By Offering, 2022 – 2035 (USD Million)
- 5.1 Key trends
- 5.2 Hardware
- 5.3 Software
- 5.4 Services
Chapter 6 Market Estimates and Forecast, By Product Type, 2022 – 2035 (USD Million)
- 6.1 Key trends
- 6.2 Portable Oil Condition Monitoring Systems
- 6.3 Online Oil Condition Monitoring Systems
- 6.4 Off-line Oil Condition Monitoring Systems
Chapter 7 Market Estimates and Forecast, By Equipment Type, 2022 – 2035 (USD Million)
- 7.1 Key trends
- 7.2 Turbines
- 7.3 Compressors
- 7.4 Engines
- 7.5 Gear Systems
- 7.6 Hydraulic Systems
- 7.7 Transformers
- 7.8 Others
Chapter 8 Market Estimates and Forecast, By Application, 2022 – 2035 (USD Million)
- 8.1 Key trends
- 8.2 Predictive Maintenance
- 8.3 Equipment Health Monitoring
- 8.4 Contamination Detection
- 8.5 Lubricant Performance Assessment
- 8.6 Wear Particle Analysis
- 8.7 Fault Detection & Diagnostics
- 8.8 Others
Chapter 9 Market Estimates and Forecast, By End-use Industry, 2022 – 2035 (USD Million)
- 9.1 Key trends
- 9.2 Oil & Gas
- 9.3 Power Generation
- 9.4 Manufacturing
- 9.5 Mining
- 9.6 Marine
- 9.7 Transportation & Railways
- 9.8 Aerospace & Defense
- 9.9 Wind & Renewable Energy
- 9.10 Construction Equipment
- 9.11 Others
Chapter 10 Market Estimates and Forecast, By Region, 2022 – 2035 (USD Million)
- 10.1 Key trends
- 10.2 North America
- 10.2.1 U.S.
- 10.2.2 Canada
- 10.3 Europe
- 10.3.1 Germany
- 10.3.2 UK
- 10.3.3 France
- 10.3.4 Spain
- 10.3.5 Italy
- 10.4 Asia Pacific
- 10.4.1 China
- 10.4.2 India
- 10.4.3 Japan
- 10.4.4 Australia
- 10.4.5 South Korea
- 10.5 Latin America
- 10.5.1 Brazil
- 10.5.2 Mexico
- 10.5.3 Argentina
- 10.6 Middle East and Africa
- 10.6.1 South Africa
- 10.6.2 Saudi Arabia
- 10.6.3 UAE
Chapter 11 Company Profiles
- 11.1 Global Key Players
- 11.1.1 Parker Hannifin Corporation
- 11.1.2 HYDAC International
- 11.1.3 SGS SA
- 11.1.4 Bureau Veritas
- 11.1.5 Intertek Group
- 11.1.6 Shell
- 11.1.7 ExxonMobil
- 11.2 Regional key players
- 11.2.1 North America
- 11.2.1.1 Spectro Scientific
- 11.2.1.2 GasTOPS
- 11.2.1.3 Eurofins TestOil
- 11.2.2 Europe
- 11.2.2.1 Tan Delta Systems
- 11.2.2.2 eralytics
- 11.2.2.3 ifm electronic
- 11.2.2.4 Veritas Petroleum Services (VPS)
- 11.2.1 North America
- 11.3 Niche Players/Disruptors
- 11.3.1 WearCheck International
- 11.3.2 Poseidon Systems
- 11.3.3 Rheonics


