

|
시장보고서
상품코드
2109308
제과 원료 시장 : 비즈니스 기회, 성장요인, 업계 동향 분석 및 예측(2026-2035년)Confectionery Ingredients Market Opportunity, Growth Drivers, Industry Trend Analysis, and Forecast 2026 - 2035 |
||||||

세계의 제과 원료 시장은 2025년에 922억 달러 규모가 되어, 2035년까지 연평균 복합 성장률(CAGR)3.9%로 성장하여 1,350억 달러에 이를 것으로 추정되고 있습니다.
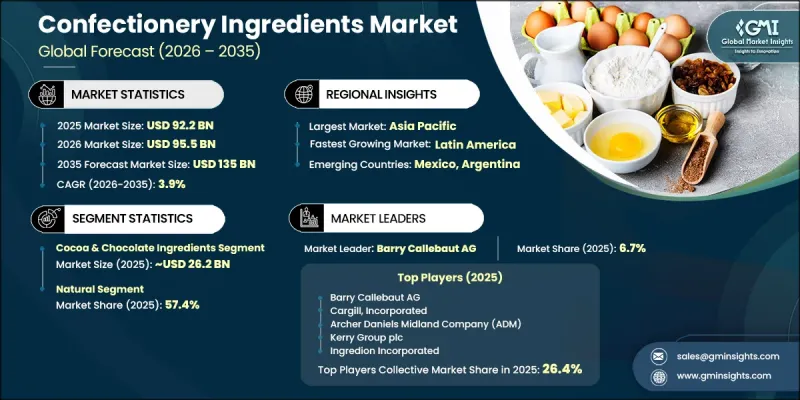
프리미엄급이며 장인의 솜씨가 돋보이는 고품질 제과 제품에 대한 소비자의 선호도가 높아짐에 따라, 전 세계 시장 전반에서 첨단 원료 솔루션에 대한 꾸준한 수요가 견인되고 있습니다. 각 제조업체는 제품 품질을 향상시키고 끊임없이 변화하는 소비자의 기대에 부응하기 위해 프리미엄 원료, 천연 유래 원료 및 특수 배합을 점점 더 많이 활용하고 있습니다. 제과 원료 시장에 영향을 미치는 가장 중요한 구조적 변화 중 하나는 인공 착색료, 인공 향료, 유화제, 인공 감미료가 천연 유래 대체재로 대체되고 있다는 점입니다. 이러한 전환은 제품 개발 전략을 새롭게 하고, 업계 전반에 걸친 원료 혁신을 촉진하고 있습니다. 동시에, 인공지능(AI)과 머신러닝을 활용한 디지털 기술은 제품 개발 가속화, 배합 정밀도 향상, 관능적 특성 최적화를 통해 원료 배합의 방식을 혁신하고 있습니다. 이러한 첨단 개발 플랫폼을 통해 제조업체는 원료 조합을 보다 효율적으로 평가할 수 있게 되어, 개발 기간을 대폭 단축하면서도 제품의 품질 안정성을 높일 수 있습니다. '클린 라벨' 제품, 프리미엄 원료, 혁신적인 제과류 배합에 대한 수요가 계속 증가함에 따라, 제과류 원료 시장은 예측 기간 동안 안정적인 성장을 유지할 것으로 전망됩니다.
| 시장 범위 | |
|---|---|
| 시작 연도 | 2025년 |
| 예측 기간 | 2026-2035년 |
| 초기 시장 규모 | 922억 달러 |
| 예측 시장 규모 | 1,350억 달러 |
| CAGR | 3.9% |
코코아 및 초콜릿 원료 부문은 2025년에 28.4%의 점유율을 차지하며 262억 달러의 매출을 기록했습니다. 2035년까지 연평균 성장률(CAGR) 3.8%를 나타낼 것으로 예측됩니다. 이 부문은 산업 규모 및 수제 제과 제조 모두에서 코코아계 원료에 대한 수요가 견조함에 따라 계속해서 시장을 주도하고 있습니다. 감미료는 여전히 2위 원료 카테고리이며, 제조업체들은 제품의 재조성 이니셔티브를 지원하기 위해 대체 감미료 솔루션을 점점 더 많이 도입하고 있습니다. 또한, 우유 및 유제품 원료는 고품질 원재료가 제품 차별화에 있어 계속해서 중요한 역할을 하는 프리미엄 제과류 용도에서 여전히 필수적인 존재로 남아 있습니다.
2025년 기준, 천연 원료 부문의 점유율은 57.4%를 차지했습니다. 각 제조업체가 클린 라벨 제품에 대한 소비자의 선호도, 지속가능성 목표, 그리고 변화하는 규제적 기대에 부응함에 따라 천연 유래 원료에 대한 수요는 계속해서 가속화되고 있습니다. 이러한 업계 전반의 전환에 따라 최소한의 가공을 거친 원료, 발효 유래 원료 및 천연 유래 원료의 채택이 더욱 확대되고 있습니다. 식물 유래 유화제, 천연 착색료 및 식물성 감미료는 합성 대체품을 대체하는 추세가 강해지고 있으며, 보다 자연스러운 원료 배합으로의 장기적인 전환을 뒷받침하고 있습니다.
2025년, 북미 제과 원료 시장은 21.5%의 점유율을 차지했습니다. 이 지역 시장 성장은 주로 클린 라벨 원료 배합에 대한 수요 증가와 제과 공급망 전반에 걸친 조달 기준의 강화에 힘입은 것입니다. 각 제조업체는 변화하는 소비자 기호에 부응하기 위해 프리미엄 제품 라인업을 확충하는 한편, 천연 유래이며 추적 가능성이 확보되고 지속 가능한 방식으로 조달된 원료를 더욱 중시하고 있습니다. 제품의 투명성과 원료 품질에 대한 지속적인 관심이 해당 지역 전체의 꾸준한 시장 발전을 뒷받침할 것으로 예측됩니다.
자주 묻는 질문
목차
제1장 조사 방법과 범위
제2장 주요 요약
제3장 업계 인사이트
제4장 경쟁 구도
제5장 시장 추산 및 예측 : 원료 유형별, 2022-2035년
제6장 시장 추산 및 예측 : 공급원별, 2022-2035년
제7장 시장 추산 및 예측 : 형태별, 2022-2035년
제8장 시장 추산 및 예측 : 용도별, 2022-2035년
제9장 시장 추산 및 예측 : 지역별, 2022-2035년
제10장 기업 개요
JHS 26.08.18The Global Confectionery Ingredients Market was valued at USD 92.2 billion in 2025 and is estimated to grow at a CAGR of 3.9% to reach USD 135 billion by 2035.
Rising consumer preference for premium, artisanal, and high-quality confectionery products is driving steady demand for advanced ingredient solutions across global markets. Manufacturers are increasingly utilizing premium raw materials, naturally derived ingredients, and specialty formulations to enhance product quality and meet evolving consumer expectations. One of the most significant structural shifts influencing the confectionery ingredients market is the growing replacement of artificial colors, flavors, emulsifiers, and sweeteners with naturally sourced alternatives. This transition is reshaping product development strategies and encouraging ingredient innovation across the industry. At the same time, digital technologies powered by artificial intelligence and machine learning are transforming ingredient formulation by accelerating product development, improving formulation precision, and enhancing sensory optimization. These advanced development platforms enable manufacturers to evaluate ingredient combinations more efficiently, significantly reducing development timelines while improving product consistency. As demand for clean-label products, premium ingredients, and innovative confectionery formulations continues to increase, the confectionery ingredients market is expected to maintain stable growth throughout the forecast period.
| Market Scope | |
|---|---|
| Start Year | 2025 |
| Forecast Year | 2026-2035 |
| Start Value | $92.2 Billion |
| Forecast Value | $135 Billion |
| CAGR | 3.9% |
The cocoa and chocolate ingredients segment accounted for a 28.4% share in 2025, generating USD 26.2 billion, and is expected to grow at a CAGR of 3.8% through 2035. The segment continues to dominate due to consistent demand for cocoa-based ingredients across both industrial-scale and artisanal confectionery production. Sweeteners remain the second-largest ingredient category, with manufacturers increasingly incorporating alternative sweetening solutions to support product reformulation initiatives. Milk and dairy ingredients also remain essential for premium confectionery applications, where high-quality raw materials continue to play a critical role in product differentiation.
The natural ingredients segment held a 57.4% share in 2025. Demand for naturally sourced ingredients continues to accelerate as manufacturers respond to consumer preferences for clean-label products, sustainability objectives, and evolving regulatory expectations. This industry-wide transition is driving greater adoption of minimally processed, fermentation-derived, and naturally sourced ingredients. Plant-based emulsifiers, natural color solutions, and botanical sweeteners are increasingly replacing synthetic alternatives, reinforcing the long-term shift toward more natural ingredient formulations.
North America Confectionery Ingredients Market accounted for 21.5% share in 2025. Market growth across the region is primarily supported by increasing demand for clean-label ingredient formulations and stricter sourcing standards throughout the confectionery supply chain. Manufacturers are placing greater emphasis on natural, traceable, and sustainably sourced ingredients while expanding premium product offerings to meet changing consumer preferences. Continued focus on product transparency and ingredient quality is expected to support steady market development across the region.
Key players operating in the global confectionery ingredients market include Archer Daniels Midland Company (ADM), Balchem Corporation, Barry Callebaut AG, Cargill, Incorporated, Corbion N.V., DSM-Firmenich AG, Ingredion Incorporated, Kerry Group plc, Natra S.A., Olam Food Ingredients (OFI), Prova SAS, Puratos Group, Sensient Technologies Corporation, and Tate & Lyle PLC. Companies operating in the confectionery ingredients market are strengthening their competitive position by expanding premium ingredient portfolios, investing in research and development, and introducing innovative clean-label solutions that align with evolving consumer preferences. Manufacturers are increasing investments in natural ingredients, sustainable sourcing programs, and advanced formulation technologies to improve product quality and accelerate innovation. Strategic collaborations with food manufacturers, ingredient suppliers, and distribution partners are helping companies broaden market reach and strengthen customer relationships. Businesses are also enhancing production capabilities, improving supply chain efficiency, and developing customized ingredient solutions tailored to changing formulation requirements.
Table of Contents
Chapter 1 Methodology & Scope
- 1.1 Research approach
- 1.2 Quality Commitments
- 1.2.1 GMI AI policy & data integrity commitment
- 1.2.1.1 Source consistency protocol
- 1.2.1 GMI AI policy & data integrity commitment
- 1.3 Research Trail & Confidence Scoring
- 1.3.1 Research Trail Components
- 1.3.2 Scoring Components
- 1.4 Data Collection
- 1.4.1 Partial list of primary sources
- 1.5 Data mining sources
- 1.5.1 Paid sources
- 1.5.1.1 Sources, by region
- 1.5.1 Paid sources
- 1.6 Base estimates and calculations
- 1.6.1 Base year calculation for any one approach
- 1.7 Forecast model
- 1.7.1 Quantified market impact analysis
- 1.7.1.1 Mathematical impact of growth parameters on forecast
- 1.7.1 Quantified market impact analysis
- 1.8 Research transparency addendum
- 1.8.1 Source attribution framework
- 1.8.2 Quality assurance metrics
- 1.8.3 Our commitment to trust
Chapter 2 Executive Summary
- 2.1 Industry 360° synopsis
- 2.2 Key market trends
- 2.2.1 Regional
- 2.2.2 Ingredient type
- 2.2.3 Source
- 2.2.4 Form
- 2.2.5 Application
Chapter 3 Industry Insights
- 3.1 Industry ecosystem analysis
- 3.1.1 Supplier landscape
- 3.1.2 Profit margin
- 3.1.3 Value addition at each stage
- 3.1.4 Factor affecting the value chain
- 3.1.5 Disruptions
- 3.2 Industry impact forces
- 3.2.1 Growth drivers
- 3.2.2 Industry pitfalls and challenges
- 3.2.3 Market opportunities
- 3.3 Growth potential analysis
- 3.4 Regulatory landscape
- 3.4.1 North America
- 3.4.2 Europe
- 3.4.3 Asia Pacific
- 3.4.4 Latin America
- 3.4.5 Middle East & Africa
- 3.5 Porter’s analysis
- 3.6 PESTEL analysis
- 3.7 Price trends
- 3.7.1 By region
- 3.7.2 By ingredient type
- 3.8 Future market trends
- 3.9 Technology and innovation landscape
- 3.9.1 Current technological trends
- 3.9.2 Emerging technologies
- 3.10 Patent Landscape
- 3.11 Trade statistics (HS code)
- 3.11.1 Major importing countries
- 3.11.2 Major exporting countries
- 3.12 Sustainability and environmental aspects
- 3.12.1 Sustainable practices
- 3.12.2 Waste reduction strategies
- 3.12.3 Energy efficiency in production
- 3.12.4 Eco-friendly initiatives
- 3.13 Carbon footprint consideration
Chapter 4 Competitive Landscape, 2025
- 4.1 Introduction
- 4.2 Company market share analysis
- 4.2.1 By region
- 4.2.1.1 North America
- 4.2.1.2 Europe
- 4.2.1.3 Asia Pacific
- 4.2.1.4 LATAM
- 4.2.1.5 MEA
- 4.2.1 By region
- 4.3 Competitive analysis of major market players
- 4.4 Competitive positioning matrix
- 4.5 Key developments
- 4.5.1 Mergers & acquisitions
- 4.5.2 Partnerships & collaborations
- 4.5.3 New Product Launches
- 4.5.4 Expansion Plans
Chapter 5 Market Estimates and Forecast, By Ingredient Type, 2022–2035 (USD Billion) (Kilo Tons)
- 5.1 Key trends
- 5.2 Cocoa & chocolate ingredients
- 5.3 Dairy ingredients
- 5.4 Sweeteners
- 5.5 Emulsifiers, stabilizers & hydrocolloids
- 5.6 Oils & shortenings
- 5.7 Flavors & colors
- 5.8 Malts & cereal ingredients
- 5.9 Nuts & fruits
- 5.10 Others
Chapter 6 Market Estimates and Forecast, By Source, 2022–2035 (USD Billion) (Kilo Tons)
- 6.1 Key trends
- 6.2 Natural
- 6.3 Synthetic
Chapter 7 Market Estimates and Forecast, By Form, 2022–2035 (USD Billion) (Kilo Tons)
- 7.1 Key trends
- 7.2 Dry/powder
- 7.3 Liquid
- 7.4 Gel/paste
Chapter 8 Market Estimates and Forecast, By Application, 2022–2035 (USD Billion) (Kilo Tons)
- 8.1 Key trends
- 8.2 Chocolate confectionery
- 8.2.1 Dark chocolate
- 8.2.2 Milk chocolate
- 8.2.3 White & ruby chocolate
- 8.2.4 Compound & filled chocolate products
- 8.3 Sugar confectionery
- 8.3.1 Hard candies & lollipops
- 8.3.2 Caramels, toffees & fudge
- 8.3.3 Marshmallows, fondants & nougat
- 8.4 Bakery confectionery
- 8.4.1 Chocolate-filled & enrobed pastries
- 8.4.2 Cream-filled cookies, biscuits & wafers
- 8.4.3 Confectionery cake decorations & glazing coatings
- 8.5 Chewing gum & jelly confectionery
- 8.5.1 Chewing gum & bubble gum
- 8.5.2 Gummy candies & soft jellies
- 8.5.3 Pectin-based & gelatin-based confections
- 8.6 Others
Chapter 9 Market Estimates and Forecast, By Region, 2022–2035 (USD Billion) (Kilo Tons)
- 9.1 Key trends
- 9.2 North America
- 9.2.1 U.S.
- 9.2.2 Canada
- 9.3 Europe
- 9.3.1 Germany
- 9.3.2 UK
- 9.3.3 France
- 9.3.4 Spain
- 9.3.5 Italy
- 9.3.6 Rest of Europe
- 9.4 Asia Pacific
- 9.4.1 China
- 9.4.2 India
- 9.4.3 Japan
- 9.4.4 Australia
- 9.4.5 South Korea
- 9.4.6 Rest of Asia Pacific
- 9.5 Latin America
- 9.5.1 Brazil
- 9.5.2 Mexico
- 9.5.3 Argentina
- 9.5.4 Rest of Latin America
- 9.6 Middle East and Africa
- 9.6.1 Saudi Arabia
- 9.6.2 South Africa
- 9.6.3 UAE
- 9.6.4 Rest of Middle East and Africa
Chapter 10 Company Profiles
- 10.1 Archer Daniels Midland Company (ADM)
- 10.2 Balchem Corporation
- 10.3 Barry Callebaut AG
- 10.4 Cargill, Incorporated
- 10.5 Corbion N.V.
- 10.6 DSM-Firmenich AG
- 10.7 Ingredion Incorporated
- 10.8 Kerry Group plc
- 10.9 Natra S.A.
- 10.10 Olam Food Ingredients (OFI)
- 10.11 Prova SAS
- 10.12 Puratos Group
- 10.13 Sensient Technologies Corporation
- 10.14 Tate & Lyle PLC


