|
시장보고서
상품코드
2121194
제어 밸브 시장 기회, 성장 촉진요인, 업계 동향 분석 및 예측(2026-2035년)Control Valve Market Opportunity, Growth Drivers, Industry Trend Analysis, and Forecast 2026 - 2035 |
||||||

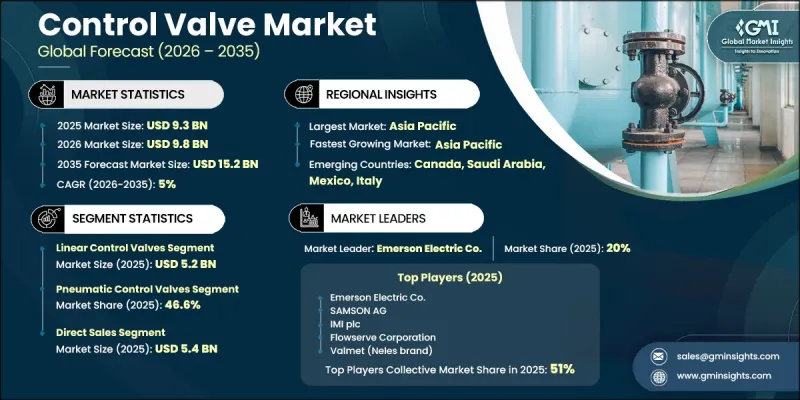
세계의 제어 밸브 시장은 2025년에 93억 달러로 평가되며, CAGR 5%로 성장하여 2035년까지 152억 달러에 달할 것으로 추정됩니다.
프로세스 산업에서 운영 정밀도, 생산 효율 및 공정 신뢰성을 향상시키기 위해 첨단 유량 제어 기술에 대한 의존도가 높아짐에 따라 시장은 계속해서 확대되고 있습니다. 제어 밸브는 안정적인 운영 유지 및 에너지 소비 최적화를 위해 유체의 유량을 정밀하게 제어하는 것이 필수적인 산업 시설에서 여전히 없어서는 안 될 구성요소로 자리 잡고 있습니다. 산업용 공정 제어 시스템의 지속적인 현대화에 따라, 첨단 액추에이터, 지능형 포지셔너, 실시간 모니터링 기능을 갖춘 디지털 대응 제어 밸브의 도입이 촉진되고 있습니다. 이러한 기술을 통해 운영자는 시스템 성능을 향상시키고, 유지보수 부담을 줄이며, 공정의 가시성을 높이는 동시에 장기적인 운영 효율을 유지할 수 있게 됩니다. 동시에, 환경 규제의 강화와 기업의 지속가능성 노력 확대가 구매 결정에 영향을 미치고 있으며, 최종사용자는 저배출 밸브 기술, 에너지 효율이 높은 구동 시스템 및 스마트 진단 솔루션에 대한 투자를 진행하고 있습니다. 기존 밸브 시스템에서 첨단 디지털 제어 플랫폼으로의 전환으로 인해 교체 수요가 가속화되는 동시에, 이미 설치된 밸브 어셈블리의 전반적인 가치도 높아지고 있습니다. 이러한 요인들이 전 세계 제어 밸브 시장의 지속적인 성장을 뒷받침하고 있습니다.
| 시장 범위 | |
|---|---|
| 시작 연도 | 2025년 |
| 예측 기간 | 2026-2035년 |
| 개시 금액 | 93억 달러 |
| 예측 금액 | 152억 달러 |
| CAGR | 5% |
선형 제어 밸브 부문은 2025년에 52억 달러의 매출을 기록했습니다. 이 부문은 선형 제어 밸브가 정확한 유량 조절, 신뢰성 높은 차단 성능, 그리고 광범위한 산업 공정 조건에서 일관된 작동을 제공하기 때문에 계속해서 주도적인 위치를 유지하고 있습니다. 안정적인 공정 제어를 실현하고 효율적인 시스템 성능을 뒷받침하는 그 능력은, 작동 정밀도와 신뢰성 높은 유량 관리가 필수적인 연속 공정 환경에서 널리 채택되는 요인 중 하나입니다.
2025년, 공압식 제어 밸브 부문은 시장 점유율의 46.6%를 차지했습니다. 공압 인프라의 광범위한 보급과 산업 시설에서 입증된 공압 구동 기술의 성능 덕분에 견조한 시장 수요가 지속적으로 뒷받침되고 있습니다. 많은 사업자들은 공정 효율 향상, 제어 정밀도 향상, 설비 수명 연장, 그리고 기존 플랜트 인프라와의 호환성을 유지하면서 설비 투자를 최소화하기 위해 첨단 액추에이터 및 위치 결정 기술을 활용하여 기존 공압 제어 시스템을 업그레이드하고 있습니다.
2025년, 미국의 제어 밸브 시장은 74.3%의 점유율을 차지하며 22억 달러 규모의 시장을 기록했습니다. 미국의 광범위한 산업 생산 기반에 더해, 산업 현대화 및 공정 자동화에 대한 지속적인 투자가 맞물려 첨단 제어 밸브 기술에 대한 수요를 지속적으로 견인하고 있습니다. 운영 효율 향상, 생산 신뢰성 제고, 환경 규정 준수 강화, 그리고 산업 시설 현대화에 대한 중요성이 높아지고 있는 점이 전미 제어 밸브 시장의 확장을 더욱 뒷받침하고 있습니다.
자주 묻는 질문
목차
제1장 조사 방법과 범위
제2장 주요 요약
제3장 업계 인사이트
제4장 경쟁 구도
제5장 시장 추정 및 예측 : 밸브 유형별, 2022-2035년
제6장 시장 추정 및 예측 : 구동 기술별, 2022-2035년
제7장 시장 추정 및 예측 : 구성요소별, 2022-2035년
제8장 시장 추정 및 예측 : 소재별, 2022-2035년
제9장 시장 추정 및 예측 : 사이즈별, 2022-2035년
제10장 시장 추정 및 예측 : 압력 범위별, 2022-2035년
제11장 시장 추정 및 예측 : 용도별, 2022-2035년
제12장 시장 추정 및 예측 : 최종 이용 산업별, 2022-2035년
제13장 시장 추정 및 예측 : 유통 채널별, 2022-2035년
제14장 시장 추정 및 예측 : 지역별, 2022-2035년
제15장 기업 개요
KSM 26.09.07The Global Control Valve Market was valued at USD 9.3 billion in 2025 and is estimated to grow at a CAGR of 5% to reach USD 15.2 billion by 2035.
The market continues to expand as process industries increasingly rely on advanced flow control technologies to improve operational accuracy, production efficiency, and process reliability. Control valves remain an essential component across industrial facilities where precise regulation of fluid flow is critical for maintaining stable operations and optimizing energy consumption. Ongoing modernization of industrial process control systems is encouraging greater adoption of digitally enabled control valves equipped with advanced actuators, intelligent positioners, and real-time monitoring capabilities. These technologies allow operators to improve system performance, reduce maintenance requirements, and enhance process visibility while supporting long-term operational efficiency. At the same time, tightening environmental regulations and growing corporate sustainability initiatives are influencing purchasing decisions, prompting end users to invest in low-emission valve technologies, energy-efficient actuation systems, and smart diagnostic solutions. The transition from conventional valve systems to advanced digital control platforms is accelerating replacement demand while increasing the overall value of installed valve assemblies. These factors continue to support sustained growth across the global Control Valve Market.
| Market Scope | |
|---|---|
| Start Year | 2025 |
| Forecast Year | 2026-2035 |
| Start Value | $9.3 Billion |
| Forecast Value | $15.2 Billion |
| CAGR | 5% |
The linear control valves segment generated USD 5.2 billion in 2025. The segment continues to maintain its leading position because linear control valves provide accurate flow regulation, dependable shut-off performance, and consistent operation across a broad range of industrial process conditions. Their ability to deliver stable process control and support efficient system performance has contributed to widespread adoption across continuous processing environments where operational precision and reliable flow management remain essential.
The pneumatic control valves segment accounted for 46.6% share in 2025. Strong market demand continues to be supported by the widespread availability of pneumatic infrastructure and the proven performance of pneumatic actuation technologies in industrial facilities. Many operators are upgrading existing pneumatic control systems with advanced actuator and positioning technologies to improve process efficiency, enhance control accuracy, extend equipment life, and maintain compatibility with established plant infrastructure while minimizing capital investment.
United States Control Valve Market held a 74.3% share generating USD 2.2 billion in 2025. The country's extensive industrial manufacturing base, combined with continued investments in industrial modernization and process automation, continues to drive demand for advanced control valve technologies. Growing emphasis on improving operational efficiency, increasing production reliability, strengthening environmental compliance, and modernizing industrial facilities further supports the expansion of the Control Valve Market across the United States.
Major companies operating in the Global Control Valve Market include Emerson Electric Co., Flowserve Corporation, Valmet (Neles brand), Baker Hughes (Masoneilan), SAMSON AG, IMI plc, KSB SE & Co. KGaA, CEPAI Group, Bray International, Neway Valve (Suzhou) Co., Kitz Corporation, ARI-Armaturen, CIRCOR International, ARCA Regler GmbH, Burkert Fluid Control Systems, Azbil Corporation, Zhejiang SUPCON Fluid Technology, GEMU Group, Mokveld Valves BV, Curtiss-Wright Corporation, and Velan Inc. Companies participating in the Control Valve Market are strengthening their market positions through continuous investments in product innovation, digital technologies, and advanced process automation solutions. Manufacturers are expanding their portfolios by introducing intelligent control valves with enhanced diagnostics, predictive maintenance capabilities, improved energy efficiency, and seamless integration with digital industrial control systems. Strategic partnerships, mergers, acquisitions, and technology collaborations remain important growth strategies for expanding global presence and strengthening engineering capabilities. Companies are also increasing research and development investments to improve product reliability, operational performance, material durability, and automation compatibility.
Table of Contents
Chapter 1 Methodology & Scope
- 1.1 Research approach
- 1.2 Quality Commitments
- 1.2.1 GMI AI policy & data integrity commitment
- 1.2.1.1 Source consistency protocol
- 1.2.1 GMI AI policy & data integrity commitment
- 1.3 Research Trail & Confidence Scoring
- 1.3.1 Research Trail Components
- 1.3.2 Scoring Components
- 1.4 Data Collection
- 1.4.1 Partial list of primary sources
- 1.5 Data mining sources
- 1.5.1 Paid sources
- 1.5.1.1 Sources, by region
- 1.5.1 Paid sources
- 1.6 Base estimates and calculations
- 1.6.1 Base year calculation for any one approach
- 1.7 Forecast model
- 1.7.1 Quantified market impact analysis
- 1.7.1.1 Mathematical impact of growth parameters on forecast
- 1.7.1 Quantified market impact analysis
- 1.8 Research transparency addendum
- 1.8.1 Source attribution framework
- 1.8.2 Quality assurance metrics
- 1.8.3 Our commitment to trust
Chapter 2 Executive Summary
- 2.1 Industry 360° synopsis
- 2.2 Key market trends
- 2.2.1 Regional
- 2.2.2 Valve type
- 2.2.3 Actuation technology
- 2.2.4 Component
- 2.2.5 Material
- 2.2.6 Size
- 2.2.7 Pressure range
- 2.2.8 Application
- 2.2.9 End user industry
- 2.2.10 Distribution channel
Chapter 3 Industry Insights
- 3.1 Industry ecosystem analysis
- 3.1.1 Supplier landscape
- 3.1.2 Profit margin
- 3.1.3 Value addition at each stage
- 3.1.4 Factor affecting the value chain
- 3.2 Industry impact forces
- 3.2.1 Growth drivers
- 3.2.1.1 Rising industrial automation
- 3.2.1.2 Increasing focus on operational efficiency
- 3.2.1.3 Regulatory and safety requirements
- 3.2.2 Industry pitfalls & challenges
- 3.2.2.1 High installation and maintenance costs
- 3.2.2.2 Supply chain and raw material volatility
- 3.2.3 Opportunities
- 3.2.3.1 Smart control valves
- 3.2.3.2 Water and wastewater sector expansion
- 3.2.1 Growth drivers
- 3.3 Growth potential analysis
- 3.4 Regulatory framework
- 3.4.1 US EPA methane reduction & fugitive emission standards
- 3.4.2 EU industrial emissions directive & ATEX compliance
- 3.4.3 API, ANSI/ISA, IEC standards for control valve design & testing
- 3.4.4 Regional regulatory landscape (APAC, MEA)
- 3.5 Pricing analysis (driven by primary research)
- 3.5.1 Historical price trend analysis (2022-2025)
- 3.5.2 Pricing strategy by player type (premium / value / cost-plus)
- 3.6 Trade data analysis (driven by paid database)
- 3.6.1 Import/export volume & value trends by HS code (8481)
- 3.6.2 Key trade corridors & tariff impact
- 3.7 Impact of AI & generative AI on the market
- 3.7.1 AI-driven disruption of existing business models
- 3.7.2 GenAI use cases & adoption roadmap by segment
- 3.7.3 Risks, limitations & regulatory considerations
- 3.8 Capacity & production landscape (driven by primary research)
- 3.8.1 Installed manufacturing capacity by region & key producer
- 3.8.2 Capacity utilization rates & expansion pipelines
Chapter 4 Competitive Landscape, 2025
- 4.1 Introduction
- 4.2 Company market share analysis
- 4.2.1 By region
- 4.2.1.1 North America
- 4.2.1.2 Europe
- 4.2.1.3 Asia Pacific
- 4.2.1.4 Latin America
- 4.2.1.5 Middle East and Africa
- 4.2.1 By region
- 4.3 Company matrix analysis
- 4.4 Competitive analysis of major market players
- 4.5 Competitive positioning matrix
- 4.6 Key developments
- 4.6.1 Mergers & acquisitions
- 4.6.2 Partnerships & collaborations
- 4.6.3 New product launches
- 4.6.4 Expansion plans
Chapter 5 Market Estimates and Forecast, By Valve Type, 2022 – 2035 (USD Billion) (Units)
- 5.1 Key trends
- 5.2 Linear control valves
- 5.3 Rotary control valves
Chapter 6 Market Estimates and Forecast, By Actuation Technology, 2022 – 2035 (USD Billion) (Units)
- 6.1 Key trends
- 6.2 Pneumatic control valves
- 6.3 Electric control valves
- 6.4 Electro-hydraulic control valves
- 6.5 Hydraulic control valves
- 6.6 Manual control valves
Chapter 7 Market Estimates and Forecast, By Component, 2022 – 2035 (USD Billion) (Units)
- 7.1 Key trends
- 7.2 Valve body
- 7.3 Actuators
- 7.4 Pneumatic actuators
- 7.5 Electric actuators
- 7.6 Hydraulic actuators
- 7.7 Positioners
- 7.8 Pneumatic positioners
- 7.9 Digital/smart positioners
- 7.10 Others (limit switches, solenoid pilots, sealing assemblies, accessories)
Chapter 8 Market Estimates and Forecast, By Material, 2022 – 2035 (USD Billion) (Units)
- 8.1 Key trends
- 8.2 Stainless steel
- 8.3 Cast iron
- 8.4 Carbon steel & chrome-moly alloys
- 8.5 Cryogenic-grade materials
- 8.6 Exotic alloys
- 8.7 Others
Chapter 9 Market Estimates and Forecast, By Size, 2022 – 2035 (USD Billion) (Units)
- 9.1 Key trends
- 9.2 Up to 1"
- 9.3 1" – 6"
- 9.4 6" – 25"
- 9.5 25" – 50"
- 9.6 Above 50"
Chapter 10 Market Estimates and Forecast, By Pressure Range, 2022 – 2035 (USD Billion) (Units)
- 10.1 Key trends
- 10.2 < 50 Bar
- 10.3 50 – 350 Bar
- 10.4 351 – 700 Bar
- 10.5 701 – 1,000 Bar
- 10.6 > 1,000 Bar
Chapter 11 Market Estimates and Forecast, By Application, 2022 – 2035 (USD Billion) (Units)
- 11.1 Key trends
- 11.2 Flow control
- 11.3 Pressure control
- 11.4 Temperature control
- 11.5 Level control
- 11.6 Others
Chapter 12 Market Estimates and Forecast, By End User Industry, 2022 – 2035 (USD Billion) (Units)
- 12.1 Key trends
- 12.2 Oil & gas
- 12.3 Energy & power
- 12.4 Water & wastewater treatment
- 12.5 Chemicals & petrochemicals
- 12.6 Food & beverages
- 12.7 Pharmaceuticals
- 12.8 Metals & mining
- 12.9 Pulp & paper
- 12.10 Building & construction
- 12.11 Others
Chapter 13 Market Estimates and Forecast, By Distribution Channel, 2022 – 2035 (USD Billion) (Units)
- 13.1 Key trends
- 13.2 Direct sales
- 13.3 Indirect sales
Chapter 14 Market Estimates and Forecast, By Region, 2022 – 2035 (USD Billion) (Units)
- 14.1 Key trends
- 14.2 North America
- 14.2.1 U.S.
- 14.2.2 Canada
- 14.3 Europe
- 14.3.1 Germany
- 14.3.2 UK
- 14.3.3 France
- 14.3.4 Italy
- 14.3.5 Spain
- 14.4 Asia Pacific
- 14.4.1 China
- 14.4.2 Japan
- 14.4.3 India
- 14.4.4 Australia
- 14.4.5 South Korea
- 14.5 Latin America
- 14.5.1 Brazil
- 14.5.2 Mexico
- 14.5.3 Argentina
- 14.6 Middle East and Africa
- 14.6.1 South Africa
- 14.6.2 Saudi Arabia
- 14.6.3 UAE
Chapter 15 Company Profiles
- 15.1 Global players
- 15.1.1 Emerson Electric Co.
- 15.1.2 Flowserve Corporation
- 15.1.3 Valmet (Neles brand)
- 15.1.4 Baker Hughes (Masoneilan)
- 15.1.5 SAMSON AG
- 15.1.6 IMI plc
- 15.1.7 KSB SE & Co. KGaA
- 15.2 Regional players
- 15.2.1 CEPAI Group
- 15.2.2 Bray International
- 15.2.3 Neway Valve (Suzhou) Co.
- 15.2.4 Kitz Corporation
- 15.2.5 ARI-Armaturen
- 15.2.6 CIRCOR International
- 15.2.7 ARCA Regler GmbH
- 15.3 Emerging players
- 15.3.1 Burkert Fluid Control Systems
- 15.3.2 Azbil Corporation
- 15.3.3 Zhejiang SUPCON Fluid Technology
- 15.3.4 GEMU Group
- 15.3.5 Mokveld Valves BV
- 15.3.6 Curtiss-Wright Corporation
- 15.3.7 Velan Inc.