|
시장보고서
상품코드
1551779
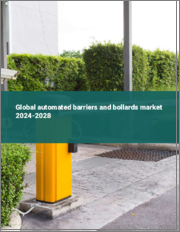
자동 차단기 및 볼라드 시장Automated Barriers and Bollards |
||||||
자동 차단기 및 볼라드 세계 시장은 2030년까지 17억 달러에 달할 것으로 예상됩니다.
2023년에 14억 달러로 추정되는 자동 차단기 및 볼라드 세계 시장은 2023년부터 2030년까지 연평균 2.9% 성장하여 2030년에는 17억 달러에 달할 것으로 예상됩니다. 이 보고서에서 분석한 부문 중 하나인 자동 차단기는 CAGR 3.2%를 기록하여 분석 기간이 끝날 때까지 10억 달러에 도달할 것으로 예상됩니다. 자동 볼라드 부문의 성장률은 분석 기간 동안 CAGR 2.4%로 추정됩니다.
미국 시장 3억 7,460만 달러, 중국은 CAGR 5.7%로 성장 전망
미국의 자동 차단기 및 볼라드 시장은 2023년 3억 7,460만 달러로 추정됩니다. 세계 2위의 경제 대국인 중국은 2030년까지 시장 규모가 3억 3,990만 달러에 달할 것으로 예상되며, 2023-2030년의 분석 기간 동안 5.7%의 연평균 복합 성장률(CAGR)을 나타낼 것으로 예상됩니다. 다른 주목할 만한 지역 시장으로는 일본과 캐나다가 있으며, 분석 기간 동안 각각 0.8%와 2.1%의 연평균 복합 성장률(CAGR)을 나타낼 것으로 예상됩니다. 유럽에서는 독일이 연평균 1.5%의 성장률을 보일 것으로 예상됩니다.
세계 자동 차단기 및 볼라드 시장 - 주요 동향 및 촉진요인 정리
자동 차단기 및 볼라드는 어떻게 보안과 출입 통제에 혁명을 일으키고 있는가?
자동 차단기 및 볼라드는 민감한 지역이나 제한 구역에서 차량 및 보행자 교통을 관리할 수 있는 효율적이고 신뢰할 수 있으며 확장 가능한 솔루션을 제공함으로써 보안 및 출입 통제에 혁명을 일으키고 있습니다. 이 시스템은 사유지, 주차장, 공공장소, 보안이 강화된 시설에 대한 접근을 제어하고 허가된 차량과 개인만 지정된 구역에 진입할 수 있도록 설계되었습니다. 게이트 및 라이징 암 배리어와 같은 자동화 배리어는 주차장이나 게이트 커뮤니티와 같은 장소에서 일반적으로 사용되며, 볼라드(특히 개폐식 및 충돌 등급 유형)는 무단 접근을 방지하거나 차량 충돌 공격으로부터 보호하기 위해 도시 지역, 정부 건물 및 군사 시설에 자주 배치됩니다. 이러한 장벽과 볼라드의 자동화는 보안을 강화할 뿐만 아니라 교통 흐름을 개선하고 수동 개입의 필요성을 줄이기 때문에 현대 보안 인프라의 필수적인 요소로 자리 잡았습니다. 자동 차단기 및 볼라드는 CCTV, RFID 리더기, 스마트 액세스 제어 플랫폼과 같은 다른 보안 시스템과 통합하여 중요한 자산을 보호하고 액세스를 효율적으로 관리할 수 있는 종합적이고 매우 효과적인 솔루션을 제공합니다.
자동 차단기 및 볼라드는 어떤 기술 혁신을 통해 기능을 향상시킬 수 있을까요?
자동 차단기 및 볼라드의 기술 혁신은 소재의 발전, 자동화 기술, 스마트 시스템과의 통합을 통해 그 기능성을 향상시키고 있습니다. 최근 장벽과 볼라드는 강화강이나 복합 합금과 같은 고강도 재료로 구성되는 경우가 많아 내구성과 내충격성이 향상되어 위험도가 높은 환경에서도 오래 사용할 수 있게 되었습니다. 유압 및 공압 시스템 채택으로 장벽의 속도와 신뢰성이 향상되어 긴급 상황이나 교통량이 많은 곳에서 중요한 빠른 응답 시간과 원활한 작동이 가능해졌습니다. 또한 IoT 연결 및 고급 센서와 같은 스마트 기술의 통합으로 이러한 시스템을 원격으로 제어하고 모니터링할 수 있게 되어 액세스 포인트 및 장벽의 상태에 대한 실시간 데이터를 제공할 수 있게 되었습니다. 이러한 스마트 시스템은 시간 일정, 보안 경보 또는 교통 상황에 따라 출입 통제를 자동으로 조정하도록 프로그래밍할 수 있어 보안과 편의성을 모두 향상시킬 수 있습니다. 또한, 태양광 발전으로 구동되는 장벽과 볼라드도 점점 더 보편화되고 있으며, 재생 가능 에너지를 사용하여 환경에 미치는 영향과 운영 비용을 절감하고 있습니다. 이러한 기술 혁신으로 자동 장벽과 볼라드는 더욱 효과적이고 적응력이 뛰어나며 현대의 보안 및 도시 계획의 요구 사항에 부합하는 자동 장벽과 볼라드가 되었습니다.
자동 차단기 및 볼라드는 보안과 도시 관리에 어떤 영향을 미칩니까?
자동 차단기 및 볼라드는 견고하고 확장 가능한 솔루션을 제공함으로써 공공 및 사적 공간의 접근 관리, 안전 및 질서 유지에 기여하여 보안 및 도시 관리에 큰 영향을 미칩니다. 정부 건물, 공항, 군사 시설과 같은 고도의 보안 환경에서 이러한 시스템은 무단 차량 접근을 방지하여 테러 공격을 포함한 잠재적 위협으로부터 보호하는 데 중요한 역할을 합니다. 또한, 차량을 정지시키는 충돌 방지 볼라드를 사용하면 기밀성이 높은 장소에서 충격적인 충돌의 위험을 줄여 보안을 더욱 강화할 수 있습니다. 도시 관리에서 자동 장벽과 볼라드는 차량과 보행자 교통을 효율적으로 조정하여 혼잡을 완화하고 교통량이 많은 지역의 전반적인 흐름을 개선할 수 있습니다. 또한 보행자 전용 구역을 설치하는 데도 필수적이며, 필요에 따라 볼라드를 올리거나 내릴 수 있어 차량 진입을 허용하거나 제한할 수 있습니다. 이러한 자동화 솔루션은 광범위한 교통 관리 시스템 및 보안 시스템과 통합되어 도시 환경의 안전과 효율성을 향상시키고, 보다 스마트하고 안전한 도시 개발을 지원하고 있습니다.
자동 차단기 및 볼라드 시장의 성장을 가속하는 트렌드는 무엇인가?
자동 차단기 및 볼라드 시장의 성장을 가속하는 몇 가지 추세는 보안 강화에 대한 요구 증가, 도시 인프라 확장, 스마트 기술 통합 등 여러 가지를 들 수 있습니다. 전 세계적으로 보안에 대한 우려가 높아짐에 따라 중요한 인프라, 공공 공간 및 사유 재산을 무단 접근 및 잠재적 위협으로부터 보호할 수 있는 견고한 출입 통제 솔루션에 대한 수요가 증가하고 있습니다. 이러한 수요는 특히 급속한 도시화가 진행 중인 지역에서 두드러지게 나타나고 있으며, 인프라 확장을 위해서는 고도의 교통 관리 및 보안 솔루션이 필요합니다. 또한 스마트 시티 개념의 부상도 이 시장의 성장을 가속하고 있습니다. 도시들은 교통 관리를 간소화하고, 공공 안전을 강화하며, 도시 생활 환경을 개선하는 기술에 투자하고 있기 때문입니다. 또한, 지속가능성을 추구하는 추세는 태양에너지로 구동되는 등 에너지 효율적이고 친환경적인 자동 장벽과 볼라드의 채택을 촉진하고 있습니다. 이러한 추세는 현대 도시 환경의 보안 및 관리에서 자동 차단기 및 볼라드가 점점 더 중요해지고 있으며, 자동 차단기 및 볼라드는 미래 도시 계획 및 보안 전략에서 중요한 요소로 자리 잡고 있음을 보여줍니다.
조사 대상 기업 예시(총 46건)
- Automatic Systems S.A.
- Avians Innovations Technology Private Limited
- Avon Barrier Corporation Ltd.
- BFT S.p.A.
- Burgolarm Security Products Ltd.
- Consel Group AG
- Houston System Private Limited
- ID Tech Solutions Pvt.
- Macs Automated Bollard Systems Ltd.
- Neptune Automatic Pvt.
- Omnitec Group(Omnitec Security Systems LLC)
- Oxley Garage Doors Ltd
- Quiko Italy SRL
- Swaraj Secutech Private Limited
- WLS(West London Security);
- WLS(West London Security)
목차
제1장 조사 방법
제2장 주요 요약
- 시장 개요
- 주요 기업
- 시장 동향과 촉진요인
- 세계 시장 전망
제3장 시장 분석
- 미국
- 캐나다
- 일본
- 중국
- 유럽
- 프랑스
- 독일
- 이탈리아
- 영국
- 스페인
- 러시아
- 기타 유럽
- 아시아태평양
- 호주
- 인도
- 한국
- 기타 아시아태평양
- 라틴아메리카
- 아르헨티나
- 브라질
- 멕시코
- 기타 라틴아메리카
- 중동
- 이란
- 이스라엘
- 사우디아라비아
- 아랍에미리트(UAE)
- 기타 중동
- 아프리카
제4장 경쟁
LSH 24.09.23Global Automated Barriers and Bollards Market to Reach US$1.7 Billion by 2030
The global market for Automated Barriers and Bollards estimated at US$1.4 Billion in the year 2023, is expected to reach US$1.7 Billion by 2030, growing at a CAGR of 2.9% over the analysis period 2023-2030. Automated Barriers, one of the segments analyzed in the report, is expected to record a 3.2% CAGR and reach US$1.0 Billion by the end of the analysis period. Growth in the Automated Bollards segment is estimated at 2.4% CAGR over the analysis period.
The U.S. Market is Estimated at US$374.6 Million While China is Forecast to Grow at 5.7% CAGR
The Automated Barriers and Bollards market in the U.S. is estimated at US$374.6 Million in the year 2023. China, the world's second largest economy, is forecast to reach a projected market size of US$339.9 Million by the year 2030 trailing a CAGR of 5.7% over the analysis period 2023-2030. Among the other noteworthy geographic markets are Japan and Canada, each forecast to grow at a CAGR of 0.8% and 2.1% respectively over the analysis period. Within Europe, Germany is forecast to grow at approximately 1.5% CAGR.
Global Automated Barriers and Bollards Market - Key Trends and Drivers Summarized
How Are Automated Barriers and Bollards Revolutionizing Security and Access Control?
Automated barriers and bollards are revolutionizing security and access control by providing efficient, reliable, and scalable solutions for managing vehicle and pedestrian traffic in sensitive or restricted areas. These systems are designed to control access to private properties, parking lots, public spaces, and high-security facilities, ensuring that only authorized vehicles and individuals can enter designated areas. Automated barriers, such as gates and rising arm barriers, are commonly used in locations like parking garages and gated communities, while bollards—especially retractable and crash-rated types—are often deployed in urban areas, government buildings, and military sites to prevent unauthorized access or to protect against vehicle-ramming attacks. The automation of these barriers and bollards not only enhances security but also improves traffic flow and reduces the need for manual intervention, making them an essential component of modern security infrastructure. By integrating with other security systems like CCTV, RFID readers, and smart access control platforms, automated barriers and bollards offer a comprehensive and highly effective solution for safeguarding critical assets and managing access efficiently.
What Innovations Are Enhancing the Functionality of Automated Barriers and Bollards?
Innovations in automated barriers and bollards are enhancing their functionality through advancements in materials, automation technology, and integration with smart systems. Modern barriers and bollards are increasingly constructed from high-strength materials like reinforced steel and composite alloys, which provide greater durability and resistance to impact, ensuring long-lasting performance even in high-risk environments. The use of hydraulic and pneumatic systems has improved the speed and reliability of these barriers, enabling faster response times and smoother operation, which is crucial in emergency situations or high-traffic areas. Moreover, the integration of smart technology, such as IoT connectivity and advanced sensors, allows these systems to be controlled and monitored remotely, offering real-time data on access points and the status of barriers. These smart systems can be programmed to automatically adjust access controls based on time schedules, security alerts, or traffic conditions, enhancing both security and convenience. Additionally, solar-powered barriers and bollards are becoming more common, reducing the environmental impact and operational costs by utilizing renewable energy sources. These innovations are making automated barriers and bollards more effective, adaptable, and aligned with the demands of modern security and urban planning.
How Do Automated Barriers and Bollards Impact Security and Urban Management?
Automated barriers and bollards significantly impact security and urban management by providing robust, scalable solutions that help manage access, enhance safety, and maintain order in public and private spaces. In high-security environments, such as government buildings, airports, and military installations, these systems play a crucial role in preventing unauthorized vehicle access, thereby protecting against potential threats, including terrorist attacks. The use of crash-rated bollards, which are designed to stop vehicles in their tracks, adds an additional layer of security by mitigating the risk of high-impact collisions in sensitive areas. In urban management, automated barriers and bollards contribute to the efficient regulation of vehicle and pedestrian traffic, reducing congestion and improving the overall flow of movement in busy areas. They are also essential in creating pedestrian-only zones, where bollards can be raised or lowered as needed to allow or restrict vehicle access. By integrating with broader traffic management and security systems, these automated solutions enhance the safety and efficiency of urban environments, supporting the development of smarter, more secure cities.
What Trends Are Driving Growth in the Automated Barriers and Bollards Market?
Several trends are driving growth in the automated barriers and bollards market, including the increasing need for enhanced security measures, the expansion of urban infrastructure, and the integration of smart technologies. As global security concerns rise, there is a growing demand for robust access control solutions that can protect critical infrastructure, public spaces, and private properties from unauthorized access and potential threats. This demand is particularly strong in regions experiencing rapid urbanization, where the expansion of infrastructure requires advanced traffic management and security solutions. The rise of smart city initiatives is also fueling the growth of this market, as cities invest in technologies that can streamline traffic management, enhance public safety, and improve urban living conditions. Additionally, the trend towards sustainability is encouraging the adoption of energy-efficient and eco-friendly automated barriers and bollards, such as those powered by solar energy. These trends highlight the increasing importance of automated barriers and bollards in securing and managing modern urban environments, making them a critical component of future city planning and security strategies.
Select Competitors (Total 46 Featured) -
- Automatic Systems S.A.
- Avians Innovations Technology Private Limited
- Avon Barrier Corporation Ltd.
- BFT S.p.A.
- Burgolarm Security Products Ltd.
- Consel Group AG
- Houston System Private Limited
- ID Tech Solutions Pvt. Ltd.
- Macs Automated Bollard Systems Ltd.
- Neptune Automatic Pvt. Ltd.
- Omnitec Group (Omnitec Security Systems LLC)
- Oxley Garage Doors Ltd
- Quiko Italy SRL
- Swaraj Secutech Private Limited
- WLS (West London Security);
TABLE OF CONTENTS
I. METHODOLOGY
II. EXECUTIVE SUMMARY
- 1. MARKET OVERVIEW
- Influencer Market Insights
- World Market Trajectories
- Global Economic Update
- Automated Barriers and Bollards - Global Key Competitors Percentage Market Share in 2024 (E)
- Competitive Market Presence - Strong/Active/Niche/Trivial for Players Worldwide in 2024 (E)
- 2. FOCUS ON SELECT PLAYERS
- 3. MARKET TRENDS & DRIVERS
- Increasing Global Emphasis on Security Measures Boosts Demand for Automated Barriers and Bollards
- Urbanization and the Need for Traffic Control Solutions Propel Market Growth
- Rising Terror Threats and the Deployment of Robust Perimeter Security
- Integration of IoT for Smart Management and Monitoring of Barrier Systems
- Expansion of the Commercial Sector Including Retail and Entertainment Venues
- Adoption of Automated Barriers in Residential Complexes for Enhanced Security
- Market Dynamics Influenced by Innovations in Hydraulic and Pneumatic Systems
- Future Trends: Autonomous Vehicle Impact on Barrier and Bollard Systems
- 4. GLOBAL MARKET PERSPECTIVE
- TABLE 1: World Automated Barriers and Bollards Market Analysis of Annual Sales in US$ Thousand for Years 2014 through 2030
- TABLE 2: World Recent Past, Current & Future Analysis for Automated Barriers and Bollards by Geographic Region - USA, Canada, Japan, China, Europe, Asia-Pacific, Latin America, Middle East and Africa Markets - Independent Analysis of Annual Sales in US$ Thousand for Years 2023 through 2030 and % CAGR
- TABLE 3: World Historic Review for Automated Barriers and Bollards by Geographic Region - USA, Canada, Japan, China, Europe, Asia-Pacific, Latin America, Middle East and Africa Markets - Independent Analysis of Annual Sales in US$ Thousand for Years 2014 through 2022 and % CAGR
- TABLE 4: World 16-Year Perspective for Automated Barriers and Bollards by Geographic Region - Percentage Breakdown of Value Sales for USA, Canada, Japan, China, Europe, Asia-Pacific, Latin America, Middle East and Africa Markets for Years 2014, 2024 & 2030
- TABLE 5: World Recent Past, Current & Future Analysis for Automated Barriers by Geographic Region - USA, Canada, Japan, China, Europe, Asia-Pacific, Latin America, Middle East and Africa Markets - Independent Analysis of Annual Sales in US$ Thousand for Years 2023 through 2030 and % CAGR
- TABLE 6: World Historic Review for Automated Barriers by Geographic Region - USA, Canada, Japan, China, Europe, Asia-Pacific, Latin America, Middle East and Africa Markets - Independent Analysis of Annual Sales in US$ Thousand for Years 2014 through 2022 and % CAGR
- TABLE 7: World 16-Year Perspective for Automated Barriers by Geographic Region - Percentage Breakdown of Value Sales for USA, Canada, Japan, China, Europe, Asia-Pacific, Latin America, Middle East and Africa for Years 2014, 2024 & 2030
- TABLE 8: World Recent Past, Current & Future Analysis for Automated Bollards by Geographic Region - USA, Canada, Japan, China, Europe, Asia-Pacific, Latin America, Middle East and Africa Markets - Independent Analysis of Annual Sales in US$ Thousand for Years 2023 through 2030 and % CAGR
- TABLE 9: World Historic Review for Automated Bollards by Geographic Region - USA, Canada, Japan, China, Europe, Asia-Pacific, Latin America, Middle East and Africa Markets - Independent Analysis of Annual Sales in US$ Thousand for Years 2014 through 2022 and % CAGR
- TABLE 10: World 16-Year Perspective for Automated Bollards by Geographic Region - Percentage Breakdown of Value Sales for USA, Canada, Japan, China, Europe, Asia-Pacific, Latin America, Middle East and Africa for Years 2014, 2024 & 2030
- TABLE 11: World Recent Past, Current & Future Analysis for Push Button by Geographic Region - USA, Canada, Japan, China, Europe, Asia-Pacific, Latin America, Middle East and Africa Markets - Independent Analysis of Annual Sales in US$ Thousand for Years 2023 through 2030 and % CAGR
- TABLE 12: World Historic Review for Push Button by Geographic Region - USA, Canada, Japan, China, Europe, Asia-Pacific, Latin America, Middle East and Africa Markets - Independent Analysis of Annual Sales in US$ Thousand for Years 2014 through 2022 and % CAGR
- TABLE 13: World 16-Year Perspective for Push Button by Geographic Region - Percentage Breakdown of Value Sales for USA, Canada, Japan, China, Europe, Asia-Pacific, Latin America, Middle East and Africa for Years 2014, 2024 & 2030
- TABLE 14: World Recent Past, Current & Future Analysis for RFID by Geographic Region - USA, Canada, Japan, China, Europe, Asia-Pacific, Latin America, Middle East and Africa Markets - Independent Analysis of Annual Sales in US$ Thousand for Years 2023 through 2030 and % CAGR
- TABLE 15: World Historic Review for RFID by Geographic Region - USA, Canada, Japan, China, Europe, Asia-Pacific, Latin America, Middle East and Africa Markets - Independent Analysis of Annual Sales in US$ Thousand for Years 2014 through 2022 and % CAGR
- TABLE 16: World 16-Year Perspective for RFID by Geographic Region - Percentage Breakdown of Value Sales for USA, Canada, Japan, China, Europe, Asia-Pacific, Latin America, Middle East and Africa for Years 2014, 2024 & 2030
- TABLE 17: World Recent Past, Current & Future Analysis for Remote Controlled by Geographic Region - USA, Canada, Japan, China, Europe, Asia-Pacific, Latin America, Middle East and Africa Markets - Independent Analysis of Annual Sales in US$ Thousand for Years 2023 through 2030 and % CAGR
- TABLE 18: World Historic Review for Remote Controlled by Geographic Region - USA, Canada, Japan, China, Europe, Asia-Pacific, Latin America, Middle East and Africa Markets - Independent Analysis of Annual Sales in US$ Thousand for Years 2014 through 2022 and % CAGR
- TABLE 19: World 16-Year Perspective for Remote Controlled by Geographic Region - Percentage Breakdown of Value Sales for USA, Canada, Japan, China, Europe, Asia-Pacific, Latin America, Middle East and Africa for Years 2014, 2024 & 2030
- TABLE 20: World Recent Past, Current & Future Analysis for Loop Detectors by Geographic Region - USA, Canada, Japan, China, Europe, Asia-Pacific, Latin America, Middle East and Africa Markets - Independent Analysis of Annual Sales in US$ Thousand for Years 2023 through 2030 and % CAGR
- TABLE 21: World Historic Review for Loop Detectors by Geographic Region - USA, Canada, Japan, China, Europe, Asia-Pacific, Latin America, Middle East and Africa Markets - Independent Analysis of Annual Sales in US$ Thousand for Years 2014 through 2022 and % CAGR
- TABLE 22: World 16-Year Perspective for Loop Detectors by Geographic Region - Percentage Breakdown of Value Sales for USA, Canada, Japan, China, Europe, Asia-Pacific, Latin America, Middle East and Africa for Years 2014, 2024 & 2030
- TABLE 23: World Recent Past, Current & Future Analysis for Other Technology Types by Geographic Region - USA, Canada, Japan, China, Europe, Asia-Pacific, Latin America, Middle East and Africa Markets - Independent Analysis of Annual Sales in US$ Thousand for Years 2023 through 2030 and % CAGR
- TABLE 24: World Historic Review for Other Technology Types by Geographic Region - USA, Canada, Japan, China, Europe, Asia-Pacific, Latin America, Middle East and Africa Markets - Independent Analysis of Annual Sales in US$ Thousand for Years 2014 through 2022 and % CAGR
- TABLE 25: World 16-Year Perspective for Other Technology Types by Geographic Region - Percentage Breakdown of Value Sales for USA, Canada, Japan, China, Europe, Asia-Pacific, Latin America, Middle East and Africa for Years 2014, 2024 & 2030
III. MARKET ANALYSIS
- UNITED STATES
- Automated Barriers and Bollards Market Presence - Strong/Active/Niche/Trivial - Key Competitors in the United States for 2024 (E)
- TABLE 26: USA Recent Past, Current & Future Analysis for Automated Barriers and Bollards by Type - Automated Barriers and Automated Bollards - Independent Analysis of Annual Sales in US$ Thousand for the Years 2023 through 2030 and % CAGR
- TABLE 27: USA Historic Review for Automated Barriers and Bollards by Type - Automated Barriers and Automated Bollards Markets - Independent Analysis of Annual Sales in US$ Thousand for Years 2014 through 2022 and % CAGR
- TABLE 28: USA 16-Year Perspective for Automated Barriers and Bollards by Type - Percentage Breakdown of Value Sales for Automated Barriers and Automated Bollards for the Years 2014, 2024 & 2030
- TABLE 29: USA Recent Past, Current & Future Analysis for Automated Barriers and Bollards by Technology Type - Push Button, RFID, Remote Controlled, Loop Detectors and Other Technology Types - Independent Analysis of Annual Sales in US$ Thousand for the Years 2023 through 2030 and % CAGR
- TABLE 30: USA Historic Review for Automated Barriers and Bollards by Technology Type - Push Button, RFID, Remote Controlled, Loop Detectors and Other Technology Types Markets - Independent Analysis of Annual Sales in US$ Thousand for Years 2014 through 2022 and % CAGR
- TABLE 31: USA 16-Year Perspective for Automated Barriers and Bollards by Technology Type - Percentage Breakdown of Value Sales for Push Button, RFID, Remote Controlled, Loop Detectors and Other Technology Types for the Years 2014, 2024 & 2030
- CANADA
- TABLE 32: Canada Recent Past, Current & Future Analysis for Automated Barriers and Bollards by Type - Automated Barriers and Automated Bollards - Independent Analysis of Annual Sales in US$ Thousand for the Years 2023 through 2030 and % CAGR
- TABLE 33: Canada Historic Review for Automated Barriers and Bollards by Type - Automated Barriers and Automated Bollards Markets - Independent Analysis of Annual Sales in US$ Thousand for Years 2014 through 2022 and % CAGR
- TABLE 34: Canada 16-Year Perspective for Automated Barriers and Bollards by Type - Percentage Breakdown of Value Sales for Automated Barriers and Automated Bollards for the Years 2014, 2024 & 2030
- TABLE 35: Canada Recent Past, Current & Future Analysis for Automated Barriers and Bollards by Technology Type - Push Button, RFID, Remote Controlled, Loop Detectors and Other Technology Types - Independent Analysis of Annual Sales in US$ Thousand for the Years 2023 through 2030 and % CAGR
- TABLE 36: Canada Historic Review for Automated Barriers and Bollards by Technology Type - Push Button, RFID, Remote Controlled, Loop Detectors and Other Technology Types Markets - Independent Analysis of Annual Sales in US$ Thousand for Years 2014 through 2022 and % CAGR
- TABLE 37: Canada 16-Year Perspective for Automated Barriers and Bollards by Technology Type - Percentage Breakdown of Value Sales for Push Button, RFID, Remote Controlled, Loop Detectors and Other Technology Types for the Years 2014, 2024 & 2030
- JAPAN
- Automated Barriers and Bollards Market Presence - Strong/Active/Niche/Trivial - Key Competitors in Japan for 2024 (E)
- TABLE 38: Japan Recent Past, Current & Future Analysis for Automated Barriers and Bollards by Type - Automated Barriers and Automated Bollards - Independent Analysis of Annual Sales in US$ Thousand for the Years 2023 through 2030 and % CAGR
- TABLE 39: Japan Historic Review for Automated Barriers and Bollards by Type - Automated Barriers and Automated Bollards Markets - Independent Analysis of Annual Sales in US$ Thousand for Years 2014 through 2022 and % CAGR
- TABLE 40: Japan 16-Year Perspective for Automated Barriers and Bollards by Type - Percentage Breakdown of Value Sales for Automated Barriers and Automated Bollards for the Years 2014, 2024 & 2030
- TABLE 41: Japan Recent Past, Current & Future Analysis for Automated Barriers and Bollards by Technology Type - Push Button, RFID, Remote Controlled, Loop Detectors and Other Technology Types - Independent Analysis of Annual Sales in US$ Thousand for the Years 2023 through 2030 and % CAGR
- TABLE 42: Japan Historic Review for Automated Barriers and Bollards by Technology Type - Push Button, RFID, Remote Controlled, Loop Detectors and Other Technology Types Markets - Independent Analysis of Annual Sales in US$ Thousand for Years 2014 through 2022 and % CAGR
- TABLE 43: Japan 16-Year Perspective for Automated Barriers and Bollards by Technology Type - Percentage Breakdown of Value Sales for Push Button, RFID, Remote Controlled, Loop Detectors and Other Technology Types for the Years 2014, 2024 & 2030
- CHINA
- Automated Barriers and Bollards Market Presence - Strong/Active/Niche/Trivial - Key Competitors in China for 2024 (E)
- TABLE 44: China Recent Past, Current & Future Analysis for Automated Barriers and Bollards by Type - Automated Barriers and Automated Bollards - Independent Analysis of Annual Sales in US$ Thousand for the Years 2023 through 2030 and % CAGR
- TABLE 45: China Historic Review for Automated Barriers and Bollards by Type - Automated Barriers and Automated Bollards Markets - Independent Analysis of Annual Sales in US$ Thousand for Years 2014 through 2022 and % CAGR
- TABLE 46: China 16-Year Perspective for Automated Barriers and Bollards by Type - Percentage Breakdown of Value Sales for Automated Barriers and Automated Bollards for the Years 2014, 2024 & 2030
- TABLE 47: China Recent Past, Current & Future Analysis for Automated Barriers and Bollards by Technology Type - Push Button, RFID, Remote Controlled, Loop Detectors and Other Technology Types - Independent Analysis of Annual Sales in US$ Thousand for the Years 2023 through 2030 and % CAGR
- TABLE 48: China Historic Review for Automated Barriers and Bollards by Technology Type - Push Button, RFID, Remote Controlled, Loop Detectors and Other Technology Types Markets - Independent Analysis of Annual Sales in US$ Thousand for Years 2014 through 2022 and % CAGR
- TABLE 49: China 16-Year Perspective for Automated Barriers and Bollards by Technology Type - Percentage Breakdown of Value Sales for Push Button, RFID, Remote Controlled, Loop Detectors and Other Technology Types for the Years 2014, 2024 & 2030
- EUROPE
- Automated Barriers and Bollards Market Presence - Strong/Active/Niche/Trivial - Key Competitors in Europe for 2024 (E)
- TABLE 50: Europe Recent Past, Current & Future Analysis for Automated Barriers and Bollards by Geographic Region - France, Germany, Italy, UK, Spain, Russia and Rest of Europe Markets - Independent Analysis of Annual Sales in US$ Thousand for Years 2023 through 2030 and % CAGR
- TABLE 51: Europe Historic Review for Automated Barriers and Bollards by Geographic Region - France, Germany, Italy, UK, Spain, Russia and Rest of Europe Markets - Independent Analysis of Annual Sales in US$ Thousand for Years 2014 through 2022 and % CAGR
- TABLE 52: Europe 16-Year Perspective for Automated Barriers and Bollards by Geographic Region - Percentage Breakdown of Value Sales for France, Germany, Italy, UK, Spain, Russia and Rest of Europe Markets for Years 2014, 2024 & 2030
- TABLE 53: Europe Recent Past, Current & Future Analysis for Automated Barriers and Bollards by Type - Automated Barriers and Automated Bollards - Independent Analysis of Annual Sales in US$ Thousand for the Years 2023 through 2030 and % CAGR
- TABLE 54: Europe Historic Review for Automated Barriers and Bollards by Type - Automated Barriers and Automated Bollards Markets - Independent Analysis of Annual Sales in US$ Thousand for Years 2014 through 2022 and % CAGR
- TABLE 55: Europe 16-Year Perspective for Automated Barriers and Bollards by Type - Percentage Breakdown of Value Sales for Automated Barriers and Automated Bollards for the Years 2014, 2024 & 2030
- TABLE 56: Europe Recent Past, Current & Future Analysis for Automated Barriers and Bollards by Technology Type - Push Button, RFID, Remote Controlled, Loop Detectors and Other Technology Types - Independent Analysis of Annual Sales in US$ Thousand for the Years 2023 through 2030 and % CAGR
- TABLE 57: Europe Historic Review for Automated Barriers and Bollards by Technology Type - Push Button, RFID, Remote Controlled, Loop Detectors and Other Technology Types Markets - Independent Analysis of Annual Sales in US$ Thousand for Years 2014 through 2022 and % CAGR
- TABLE 58: Europe 16-Year Perspective for Automated Barriers and Bollards by Technology Type - Percentage Breakdown of Value Sales for Push Button, RFID, Remote Controlled, Loop Detectors and Other Technology Types for the Years 2014, 2024 & 2030
- FRANCE
- Automated Barriers and Bollards Market Presence - Strong/Active/Niche/Trivial - Key Competitors in France for 2024 (E)
- TABLE 59: France Recent Past, Current & Future Analysis for Automated Barriers and Bollards by Type - Automated Barriers and Automated Bollards - Independent Analysis of Annual Sales in US$ Thousand for the Years 2023 through 2030 and % CAGR
- TABLE 60: France Historic Review for Automated Barriers and Bollards by Type - Automated Barriers and Automated Bollards Markets - Independent Analysis of Annual Sales in US$ Thousand for Years 2014 through 2022 and % CAGR
- TABLE 61: France 16-Year Perspective for Automated Barriers and Bollards by Type - Percentage Breakdown of Value Sales for Automated Barriers and Automated Bollards for the Years 2014, 2024 & 2030
- TABLE 62: France Recent Past, Current & Future Analysis for Automated Barriers and Bollards by Technology Type - Push Button, RFID, Remote Controlled, Loop Detectors and Other Technology Types - Independent Analysis of Annual Sales in US$ Thousand for the Years 2023 through 2030 and % CAGR
- TABLE 63: France Historic Review for Automated Barriers and Bollards by Technology Type - Push Button, RFID, Remote Controlled, Loop Detectors and Other Technology Types Markets - Independent Analysis of Annual Sales in US$ Thousand for Years 2014 through 2022 and % CAGR
- TABLE 64: France 16-Year Perspective for Automated Barriers and Bollards by Technology Type - Percentage Breakdown of Value Sales for Push Button, RFID, Remote Controlled, Loop Detectors and Other Technology Types for the Years 2014, 2024 & 2030
- GERMANY
- Automated Barriers and Bollards Market Presence - Strong/Active/Niche/Trivial - Key Competitors in Germany for 2024 (E)
- TABLE 65: Germany Recent Past, Current & Future Analysis for Automated Barriers and Bollards by Type - Automated Barriers and Automated Bollards - Independent Analysis of Annual Sales in US$ Thousand for the Years 2023 through 2030 and % CAGR
- TABLE 66: Germany Historic Review for Automated Barriers and Bollards by Type - Automated Barriers and Automated Bollards Markets - Independent Analysis of Annual Sales in US$ Thousand for Years 2014 through 2022 and % CAGR
- TABLE 67: Germany 16-Year Perspective for Automated Barriers and Bollards by Type - Percentage Breakdown of Value Sales for Automated Barriers and Automated Bollards for the Years 2014, 2024 & 2030
- TABLE 68: Germany Recent Past, Current & Future Analysis for Automated Barriers and Bollards by Technology Type - Push Button, RFID, Remote Controlled, Loop Detectors and Other Technology Types - Independent Analysis of Annual Sales in US$ Thousand for the Years 2023 through 2030 and % CAGR
- TABLE 69: Germany Historic Review for Automated Barriers and Bollards by Technology Type - Push Button, RFID, Remote Controlled, Loop Detectors and Other Technology Types Markets - Independent Analysis of Annual Sales in US$ Thousand for Years 2014 through 2022 and % CAGR
- TABLE 70: Germany 16-Year Perspective for Automated Barriers and Bollards by Technology Type - Percentage Breakdown of Value Sales for Push Button, RFID, Remote Controlled, Loop Detectors and Other Technology Types for the Years 2014, 2024 & 2030
- ITALY
- TABLE 71: Italy Recent Past, Current & Future Analysis for Automated Barriers and Bollards by Type - Automated Barriers and Automated Bollards - Independent Analysis of Annual Sales in US$ Thousand for the Years 2023 through 2030 and % CAGR
- TABLE 72: Italy Historic Review for Automated Barriers and Bollards by Type - Automated Barriers and Automated Bollards Markets - Independent Analysis of Annual Sales in US$ Thousand for Years 2014 through 2022 and % CAGR
- TABLE 73: Italy 16-Year Perspective for Automated Barriers and Bollards by Type - Percentage Breakdown of Value Sales for Automated Barriers and Automated Bollards for the Years 2014, 2024 & 2030
- TABLE 74: Italy Recent Past, Current & Future Analysis for Automated Barriers and Bollards by Technology Type - Push Button, RFID, Remote Controlled, Loop Detectors and Other Technology Types - Independent Analysis of Annual Sales in US$ Thousand for the Years 2023 through 2030 and % CAGR
- TABLE 75: Italy Historic Review for Automated Barriers and Bollards by Technology Type - Push Button, RFID, Remote Controlled, Loop Detectors and Other Technology Types Markets - Independent Analysis of Annual Sales in US$ Thousand for Years 2014 through 2022 and % CAGR
- TABLE 76: Italy 16-Year Perspective for Automated Barriers and Bollards by Technology Type - Percentage Breakdown of Value Sales for Push Button, RFID, Remote Controlled, Loop Detectors and Other Technology Types for the Years 2014, 2024 & 2030
- UNITED KINGDOM
- Automated Barriers and Bollards Market Presence - Strong/Active/Niche/Trivial - Key Competitors in the United Kingdom for 2024 (E)
- TABLE 77: UK Recent Past, Current & Future Analysis for Automated Barriers and Bollards by Type - Automated Barriers and Automated Bollards - Independent Analysis of Annual Sales in US$ Thousand for the Years 2023 through 2030 and % CAGR
- TABLE 78: UK Historic Review for Automated Barriers and Bollards by Type - Automated Barriers and Automated Bollards Markets - Independent Analysis of Annual Sales in US$ Thousand for Years 2014 through 2022 and % CAGR
- TABLE 79: UK 16-Year Perspective for Automated Barriers and Bollards by Type - Percentage Breakdown of Value Sales for Automated Barriers and Automated Bollards for the Years 2014, 2024 & 2030
- TABLE 80: UK Recent Past, Current & Future Analysis for Automated Barriers and Bollards by Technology Type - Push Button, RFID, Remote Controlled, Loop Detectors and Other Technology Types - Independent Analysis of Annual Sales in US$ Thousand for the Years 2023 through 2030 and % CAGR
- TABLE 81: UK Historic Review for Automated Barriers and Bollards by Technology Type - Push Button, RFID, Remote Controlled, Loop Detectors and Other Technology Types Markets - Independent Analysis of Annual Sales in US$ Thousand for Years 2014 through 2022 and % CAGR
- TABLE 82: UK 16-Year Perspective for Automated Barriers and Bollards by Technology Type - Percentage Breakdown of Value Sales for Push Button, RFID, Remote Controlled, Loop Detectors and Other Technology Types for the Years 2014, 2024 & 2030
- SPAIN
- TABLE 83: Spain Recent Past, Current & Future Analysis for Automated Barriers and Bollards by Type - Automated Barriers and Automated Bollards - Independent Analysis of Annual Sales in US$ Thousand for the Years 2023 through 2030 and % CAGR
- TABLE 84: Spain Historic Review for Automated Barriers and Bollards by Type - Automated Barriers and Automated Bollards Markets - Independent Analysis of Annual Sales in US$ Thousand for Years 2014 through 2022 and % CAGR
- TABLE 85: Spain 16-Year Perspective for Automated Barriers and Bollards by Type - Percentage Breakdown of Value Sales for Automated Barriers and Automated Bollards for the Years 2014, 2024 & 2030
- TABLE 86: Spain Recent Past, Current & Future Analysis for Automated Barriers and Bollards by Technology Type - Push Button, RFID, Remote Controlled, Loop Detectors and Other Technology Types - Independent Analysis of Annual Sales in US$ Thousand for the Years 2023 through 2030 and % CAGR
- TABLE 87: Spain Historic Review for Automated Barriers and Bollards by Technology Type - Push Button, RFID, Remote Controlled, Loop Detectors and Other Technology Types Markets - Independent Analysis of Annual Sales in US$ Thousand for Years 2014 through 2022 and % CAGR
- TABLE 88: Spain 16-Year Perspective for Automated Barriers and Bollards by Technology Type - Percentage Breakdown of Value Sales for Push Button, RFID, Remote Controlled, Loop Detectors and Other Technology Types for the Years 2014, 2024 & 2030
- RUSSIA
- TABLE 89: Russia Recent Past, Current & Future Analysis for Automated Barriers and Bollards by Type - Automated Barriers and Automated Bollards - Independent Analysis of Annual Sales in US$ Thousand for the Years 2023 through 2030 and % CAGR
- TABLE 90: Russia Historic Review for Automated Barriers and Bollards by Type - Automated Barriers and Automated Bollards Markets - Independent Analysis of Annual Sales in US$ Thousand for Years 2014 through 2022 and % CAGR
- TABLE 91: Russia 16-Year Perspective for Automated Barriers and Bollards by Type - Percentage Breakdown of Value Sales for Automated Barriers and Automated Bollards for the Years 2014, 2024 & 2030
- TABLE 92: Russia Recent Past, Current & Future Analysis for Automated Barriers and Bollards by Technology Type - Push Button, RFID, Remote Controlled, Loop Detectors and Other Technology Types - Independent Analysis of Annual Sales in US$ Thousand for the Years 2023 through 2030 and % CAGR
- TABLE 93: Russia Historic Review for Automated Barriers and Bollards by Technology Type - Push Button, RFID, Remote Controlled, Loop Detectors and Other Technology Types Markets - Independent Analysis of Annual Sales in US$ Thousand for Years 2014 through 2022 and % CAGR
- TABLE 94: Russia 16-Year Perspective for Automated Barriers and Bollards by Technology Type - Percentage Breakdown of Value Sales for Push Button, RFID, Remote Controlled, Loop Detectors and Other Technology Types for the Years 2014, 2024 & 2030
- REST OF EUROPE
- TABLE 95: Rest of Europe Recent Past, Current & Future Analysis for Automated Barriers and Bollards by Type - Automated Barriers and Automated Bollards - Independent Analysis of Annual Sales in US$ Thousand for the Years 2023 through 2030 and % CAGR
- TABLE 96: Rest of Europe Historic Review for Automated Barriers and Bollards by Type - Automated Barriers and Automated Bollards Markets - Independent Analysis of Annual Sales in US$ Thousand for Years 2014 through 2022 and % CAGR
- TABLE 97: Rest of Europe 16-Year Perspective for Automated Barriers and Bollards by Type - Percentage Breakdown of Value Sales for Automated Barriers and Automated Bollards for the Years 2014, 2024 & 2030
- TABLE 98: Rest of Europe Recent Past, Current & Future Analysis for Automated Barriers and Bollards by Technology Type - Push Button, RFID, Remote Controlled, Loop Detectors and Other Technology Types - Independent Analysis of Annual Sales in US$ Thousand for the Years 2023 through 2030 and % CAGR
- TABLE 99: Rest of Europe Historic Review for Automated Barriers and Bollards by Technology Type - Push Button, RFID, Remote Controlled, Loop Detectors and Other Technology Types Markets - Independent Analysis of Annual Sales in US$ Thousand for Years 2014 through 2022 and % CAGR
- TABLE 100: Rest of Europe 16-Year Perspective for Automated Barriers and Bollards by Technology Type - Percentage Breakdown of Value Sales for Push Button, RFID, Remote Controlled, Loop Detectors and Other Technology Types for the Years 2014, 2024 & 2030
- ASIA-PACIFIC
- Automated Barriers and Bollards Market Presence - Strong/Active/Niche/Trivial - Key Competitors in Asia-Pacific for 2024 (E)
- TABLE 101: Asia-Pacific Recent Past, Current & Future Analysis for Automated Barriers and Bollards by Geographic Region - Australia, India, South Korea and Rest of Asia-Pacific Markets - Independent Analysis of Annual Sales in US$ Thousand for Years 2023 through 2030 and % CAGR
- TABLE 102: Asia-Pacific Historic Review for Automated Barriers and Bollards by Geographic Region - Australia, India, South Korea and Rest of Asia-Pacific Markets - Independent Analysis of Annual Sales in US$ Thousand for Years 2014 through 2022 and % CAGR
- TABLE 103: Asia-Pacific 16-Year Perspective for Automated Barriers and Bollards by Geographic Region - Percentage Breakdown of Value Sales for Australia, India, South Korea and Rest of Asia-Pacific Markets for Years 2014, 2024 & 2030
- TABLE 104: Asia-Pacific Recent Past, Current & Future Analysis for Automated Barriers and Bollards by Type - Automated Barriers and Automated Bollards - Independent Analysis of Annual Sales in US$ Thousand for the Years 2023 through 2030 and % CAGR
- TABLE 105: Asia-Pacific Historic Review for Automated Barriers and Bollards by Type - Automated Barriers and Automated Bollards Markets - Independent Analysis of Annual Sales in US$ Thousand for Years 2014 through 2022 and % CAGR
- TABLE 106: Asia-Pacific 16-Year Perspective for Automated Barriers and Bollards by Type - Percentage Breakdown of Value Sales for Automated Barriers and Automated Bollards for the Years 2014, 2024 & 2030
- TABLE 107: Asia-Pacific Recent Past, Current & Future Analysis for Automated Barriers and Bollards by Technology Type - Push Button, RFID, Remote Controlled, Loop Detectors and Other Technology Types - Independent Analysis of Annual Sales in US$ Thousand for the Years 2023 through 2030 and % CAGR
- TABLE 108: Asia-Pacific Historic Review for Automated Barriers and Bollards by Technology Type - Push Button, RFID, Remote Controlled, Loop Detectors and Other Technology Types Markets - Independent Analysis of Annual Sales in US$ Thousand for Years 2014 through 2022 and % CAGR
- TABLE 109: Asia-Pacific 16-Year Perspective for Automated Barriers and Bollards by Technology Type - Percentage Breakdown of Value Sales for Push Button, RFID, Remote Controlled, Loop Detectors and Other Technology Types for the Years 2014, 2024 & 2030
- AUSTRALIA
- Automated Barriers and Bollards Market Presence - Strong/Active/Niche/Trivial - Key Competitors in Australia for 2024 (E)
- TABLE 110: Australia Recent Past, Current & Future Analysis for Automated Barriers and Bollards by Type - Automated Barriers and Automated Bollards - Independent Analysis of Annual Sales in US$ Thousand for the Years 2023 through 2030 and % CAGR
- TABLE 111: Australia Historic Review for Automated Barriers and Bollards by Type - Automated Barriers and Automated Bollards Markets - Independent Analysis of Annual Sales in US$ Thousand for Years 2014 through 2022 and % CAGR
- TABLE 112: Australia 16-Year Perspective for Automated Barriers and Bollards by Type - Percentage Breakdown of Value Sales for Automated Barriers and Automated Bollards for the Years 2014, 2024 & 2030
- TABLE 113: Australia Recent Past, Current & Future Analysis for Automated Barriers and Bollards by Technology Type - Push Button, RFID, Remote Controlled, Loop Detectors and Other Technology Types - Independent Analysis of Annual Sales in US$ Thousand for the Years 2023 through 2030 and % CAGR
- TABLE 114: Australia Historic Review for Automated Barriers and Bollards by Technology Type - Push Button, RFID, Remote Controlled, Loop Detectors and Other Technology Types Markets - Independent Analysis of Annual Sales in US$ Thousand for Years 2014 through 2022 and % CAGR
- TABLE 115: Australia 16-Year Perspective for Automated Barriers and Bollards by Technology Type - Percentage Breakdown of Value Sales for Push Button, RFID, Remote Controlled, Loop Detectors and Other Technology Types for the Years 2014, 2024 & 2030
- INDIA
- Automated Barriers and Bollards Market Presence - Strong/Active/Niche/Trivial - Key Competitors in India for 2024 (E)
- TABLE 116: India Recent Past, Current & Future Analysis for Automated Barriers and Bollards by Type - Automated Barriers and Automated Bollards - Independent Analysis of Annual Sales in US$ Thousand for the Years 2023 through 2030 and % CAGR
- TABLE 117: India Historic Review for Automated Barriers and Bollards by Type - Automated Barriers and Automated Bollards Markets - Independent Analysis of Annual Sales in US$ Thousand for Years 2014 through 2022 and % CAGR
- TABLE 118: India 16-Year Perspective for Automated Barriers and Bollards by Type - Percentage Breakdown of Value Sales for Automated Barriers and Automated Bollards for the Years 2014, 2024 & 2030
- TABLE 119: India Recent Past, Current & Future Analysis for Automated Barriers and Bollards by Technology Type - Push Button, RFID, Remote Controlled, Loop Detectors and Other Technology Types - Independent Analysis of Annual Sales in US$ Thousand for the Years 2023 through 2030 and % CAGR
- TABLE 120: India Historic Review for Automated Barriers and Bollards by Technology Type - Push Button, RFID, Remote Controlled, Loop Detectors and Other Technology Types Markets - Independent Analysis of Annual Sales in US$ Thousand for Years 2014 through 2022 and % CAGR
- TABLE 121: India 16-Year Perspective for Automated Barriers and Bollards by Technology Type - Percentage Breakdown of Value Sales for Push Button, RFID, Remote Controlled, Loop Detectors and Other Technology Types for the Years 2014, 2024 & 2030
- SOUTH KOREA
- TABLE 122: South Korea Recent Past, Current & Future Analysis for Automated Barriers and Bollards by Type - Automated Barriers and Automated Bollards - Independent Analysis of Annual Sales in US$ Thousand for the Years 2023 through 2030 and % CAGR
- TABLE 123: South Korea Historic Review for Automated Barriers and Bollards by Type - Automated Barriers and Automated Bollards Markets - Independent Analysis of Annual Sales in US$ Thousand for Years 2014 through 2022 and % CAGR
- TABLE 124: South Korea 16-Year Perspective for Automated Barriers and Bollards by Type - Percentage Breakdown of Value Sales for Automated Barriers and Automated Bollards for the Years 2014, 2024 & 2030
- TABLE 125: South Korea Recent Past, Current & Future Analysis for Automated Barriers and Bollards by Technology Type - Push Button, RFID, Remote Controlled, Loop Detectors and Other Technology Types - Independent Analysis of Annual Sales in US$ Thousand for the Years 2023 through 2030 and % CAGR
- TABLE 126: South Korea Historic Review for Automated Barriers and Bollards by Technology Type - Push Button, RFID, Remote Controlled, Loop Detectors and Other Technology Types Markets - Independent Analysis of Annual Sales in US$ Thousand for Years 2014 through 2022 and % CAGR
- TABLE 127: South Korea 16-Year Perspective for Automated Barriers and Bollards by Technology Type - Percentage Breakdown of Value Sales for Push Button, RFID, Remote Controlled, Loop Detectors and Other Technology Types for the Years 2014, 2024 & 2030
- REST OF ASIA-PACIFIC
- TABLE 128: Rest of Asia-Pacific Recent Past, Current & Future Analysis for Automated Barriers and Bollards by Type - Automated Barriers and Automated Bollards - Independent Analysis of Annual Sales in US$ Thousand for the Years 2023 through 2030 and % CAGR
- TABLE 129: Rest of Asia-Pacific Historic Review for Automated Barriers and Bollards by Type - Automated Barriers and Automated Bollards Markets - Independent Analysis of Annual Sales in US$ Thousand for Years 2014 through 2022 and % CAGR
- TABLE 130: Rest of Asia-Pacific 16-Year Perspective for Automated Barriers and Bollards by Type - Percentage Breakdown of Value Sales for Automated Barriers and Automated Bollards for the Years 2014, 2024 & 2030
- TABLE 131: Rest of Asia-Pacific Recent Past, Current & Future Analysis for Automated Barriers and Bollards by Technology Type - Push Button, RFID, Remote Controlled, Loop Detectors and Other Technology Types - Independent Analysis of Annual Sales in US$ Thousand for the Years 2023 through 2030 and % CAGR
- TABLE 132: Rest of Asia-Pacific Historic Review for Automated Barriers and Bollards by Technology Type - Push Button, RFID, Remote Controlled, Loop Detectors and Other Technology Types Markets - Independent Analysis of Annual Sales in US$ Thousand for Years 2014 through 2022 and % CAGR
- TABLE 133: Rest of Asia-Pacific 16-Year Perspective for Automated Barriers and Bollards by Technology Type - Percentage Breakdown of Value Sales for Push Button, RFID, Remote Controlled, Loop Detectors and Other Technology Types for the Years 2014, 2024 & 2030
- LATIN AMERICA
- Automated Barriers and Bollards Market Presence - Strong/Active/Niche/Trivial - Key Competitors in Latin America for 2024 (E)
- TABLE 134: Latin America Recent Past, Current & Future Analysis for Automated Barriers and Bollards by Geographic Region - Argentina, Brazil, Mexico and Rest of Latin America Markets - Independent Analysis of Annual Sales in US$ Thousand for Years 2023 through 2030 and % CAGR
- TABLE 135: Latin America Historic Review for Automated Barriers and Bollards by Geographic Region - Argentina, Brazil, Mexico and Rest of Latin America Markets - Independent Analysis of Annual Sales in US$ Thousand for Years 2014 through 2022 and % CAGR
- TABLE 136: Latin America 16-Year Perspective for Automated Barriers and Bollards by Geographic Region - Percentage Breakdown of Value Sales for Argentina, Brazil, Mexico and Rest of Latin America Markets for Years 2014, 2024 & 2030
- TABLE 137: Latin America Recent Past, Current & Future Analysis for Automated Barriers and Bollards by Type - Automated Barriers and Automated Bollards - Independent Analysis of Annual Sales in US$ Thousand for the Years 2023 through 2030 and % CAGR
- TABLE 138: Latin America Historic Review for Automated Barriers and Bollards by Type - Automated Barriers and Automated Bollards Markets - Independent Analysis of Annual Sales in US$ Thousand for Years 2014 through 2022 and % CAGR
- TABLE 139: Latin America 16-Year Perspective for Automated Barriers and Bollards by Type - Percentage Breakdown of Value Sales for Automated Barriers and Automated Bollards for the Years 2014, 2024 & 2030
- TABLE 140: Latin America Recent Past, Current & Future Analysis for Automated Barriers and Bollards by Technology Type - Push Button, RFID, Remote Controlled, Loop Detectors and Other Technology Types - Independent Analysis of Annual Sales in US$ Thousand for the Years 2023 through 2030 and % CAGR
- TABLE 141: Latin America Historic Review for Automated Barriers and Bollards by Technology Type - Push Button, RFID, Remote Controlled, Loop Detectors and Other Technology Types Markets - Independent Analysis of Annual Sales in US$ Thousand for Years 2014 through 2022 and % CAGR
- TABLE 142: Latin America 16-Year Perspective for Automated Barriers and Bollards by Technology Type - Percentage Breakdown of Value Sales for Push Button, RFID, Remote Controlled, Loop Detectors and Other Technology Types for the Years 2014, 2024 & 2030
- ARGENTINA
- TABLE 143: Argentina Recent Past, Current & Future Analysis for Automated Barriers and Bollards by Type - Automated Barriers and Automated Bollards - Independent Analysis of Annual Sales in US$ Thousand for the Years 2023 through 2030 and % CAGR
- TABLE 144: Argentina Historic Review for Automated Barriers and Bollards by Type - Automated Barriers and Automated Bollards Markets - Independent Analysis of Annual Sales in US$ Thousand for Years 2014 through 2022 and % CAGR
- TABLE 145: Argentina 16-Year Perspective for Automated Barriers and Bollards by Type - Percentage Breakdown of Value Sales for Automated Barriers and Automated Bollards for the Years 2014, 2024 & 2030
- TABLE 146: Argentina Recent Past, Current & Future Analysis for Automated Barriers and Bollards by Technology Type - Push Button, RFID, Remote Controlled, Loop Detectors and Other Technology Types - Independent Analysis of Annual Sales in US$ Thousand for the Years 2023 through 2030 and % CAGR
- TABLE 147: Argentina Historic Review for Automated Barriers and Bollards by Technology Type - Push Button, RFID, Remote Controlled, Loop Detectors and Other Technology Types Markets - Independent Analysis of Annual Sales in US$ Thousand for Years 2014 through 2022 and % CAGR
- TABLE 148: Argentina 16-Year Perspective for Automated Barriers and Bollards by Technology Type - Percentage Breakdown of Value Sales for Push Button, RFID, Remote Controlled, Loop Detectors and Other Technology Types for the Years 2014, 2024 & 2030
- BRAZIL
- TABLE 149: Brazil Recent Past, Current & Future Analysis for Automated Barriers and Bollards by Type - Automated Barriers and Automated Bollards - Independent Analysis of Annual Sales in US$ Thousand for the Years 2023 through 2030 and % CAGR
- TABLE 150: Brazil Historic Review for Automated Barriers and Bollards by Type - Automated Barriers and Automated Bollards Markets - Independent Analysis of Annual Sales in US$ Thousand for Years 2014 through 2022 and % CAGR
- TABLE 151: Brazil 16-Year Perspective for Automated Barriers and Bollards by Type - Percentage Breakdown of Value Sales for Automated Barriers and Automated Bollards for the Years 2014, 2024 & 2030
- TABLE 152: Brazil Recent Past, Current & Future Analysis for Automated Barriers and Bollards by Technology Type - Push Button, RFID, Remote Controlled, Loop Detectors and Other Technology Types - Independent Analysis of Annual Sales in US$ Thousand for the Years 2023 through 2030 and % CAGR
- TABLE 153: Brazil Historic Review for Automated Barriers and Bollards by Technology Type - Push Button, RFID, Remote Controlled, Loop Detectors and Other Technology Types Markets - Independent Analysis of Annual Sales in US$ Thousand for Years 2014 through 2022 and % CAGR
- TABLE 154: Brazil 16-Year Perspective for Automated Barriers and Bollards by Technology Type - Percentage Breakdown of Value Sales for Push Button, RFID, Remote Controlled, Loop Detectors and Other Technology Types for the Years 2014, 2024 & 2030
- MEXICO
- TABLE 155: Mexico Recent Past, Current & Future Analysis for Automated Barriers and Bollards by Type - Automated Barriers and Automated Bollards - Independent Analysis of Annual Sales in US$ Thousand for the Years 2023 through 2030 and % CAGR
- TABLE 156: Mexico Historic Review for Automated Barriers and Bollards by Type - Automated Barriers and Automated Bollards Markets - Independent Analysis of Annual Sales in US$ Thousand for Years 2014 through 2022 and % CAGR
- TABLE 157: Mexico 16-Year Perspective for Automated Barriers and Bollards by Type - Percentage Breakdown of Value Sales for Automated Barriers and Automated Bollards for the Years 2014, 2024 & 2030
- TABLE 158: Mexico Recent Past, Current & Future Analysis for Automated Barriers and Bollards by Technology Type - Push Button, RFID, Remote Controlled, Loop Detectors and Other Technology Types - Independent Analysis of Annual Sales in US$ Thousand for the Years 2023 through 2030 and % CAGR
- TABLE 159: Mexico Historic Review for Automated Barriers and Bollards by Technology Type - Push Button, RFID, Remote Controlled, Loop Detectors and Other Technology Types Markets - Independent Analysis of Annual Sales in US$ Thousand for Years 2014 through 2022 and % CAGR
- TABLE 160: Mexico 16-Year Perspective for Automated Barriers and Bollards by Technology Type - Percentage Breakdown of Value Sales for Push Button, RFID, Remote Controlled, Loop Detectors and Other Technology Types for the Years 2014, 2024 & 2030
- REST OF LATIN AMERICA
- TABLE 161: Rest of Latin America Recent Past, Current & Future Analysis for Automated Barriers and Bollards by Type - Automated Barriers and Automated Bollards - Independent Analysis of Annual Sales in US$ Thousand for the Years 2023 through 2030 and % CAGR
- TABLE 162: Rest of Latin America Historic Review for Automated Barriers and Bollards by Type - Automated Barriers and Automated Bollards Markets - Independent Analysis of Annual Sales in US$ Thousand for Years 2014 through 2022 and % CAGR
- TABLE 163: Rest of Latin America 16-Year Perspective for Automated Barriers and Bollards by Type - Percentage Breakdown of Value Sales for Automated Barriers and Automated Bollards for the Years 2014, 2024 & 2030
- TABLE 164: Rest of Latin America Recent Past, Current & Future Analysis for Automated Barriers and Bollards by Technology Type - Push Button, RFID, Remote Controlled, Loop Detectors and Other Technology Types - Independent Analysis of Annual Sales in US$ Thousand for the Years 2023 through 2030 and % CAGR
- TABLE 165: Rest of Latin America Historic Review for Automated Barriers and Bollards by Technology Type - Push Button, RFID, Remote Controlled, Loop Detectors and Other Technology Types Markets - Independent Analysis of Annual Sales in US$ Thousand for Years 2014 through 2022 and % CAGR
- TABLE 166: Rest of Latin America 16-Year Perspective for Automated Barriers and Bollards by Technology Type - Percentage Breakdown of Value Sales for Push Button, RFID, Remote Controlled, Loop Detectors and Other Technology Types for the Years 2014, 2024 & 2030
- MIDDLE EAST
- Automated Barriers and Bollards Market Presence - Strong/Active/Niche/Trivial - Key Competitors in Middle East for 2024 (E)
- TABLE 167: Middle East Recent Past, Current & Future Analysis for Automated Barriers and Bollards by Geographic Region - Iran, Israel, Saudi Arabia, UAE and Rest of Middle East Markets - Independent Analysis of Annual Sales in US$ Thousand for Years 2023 through 2030 and % CAGR
- TABLE 168: Middle East Historic Review for Automated Barriers and Bollards by Geographic Region - Iran, Israel, Saudi Arabia, UAE and Rest of Middle East Markets - Independent Analysis of Annual Sales in US$ Thousand for Years 2014 through 2022 and % CAGR
- TABLE 169: Middle East 16-Year Perspective for Automated Barriers and Bollards by Geographic Region - Percentage Breakdown of Value Sales for Iran, Israel, Saudi Arabia, UAE and Rest of Middle East Markets for Years 2014, 2024 & 2030
- TABLE 170: Middle East Recent Past, Current & Future Analysis for Automated Barriers and Bollards by Type - Automated Barriers and Automated Bollards - Independent Analysis of Annual Sales in US$ Thousand for the Years 2023 through 2030 and % CAGR
- TABLE 171: Middle East Historic Review for Automated Barriers and Bollards by Type - Automated Barriers and Automated Bollards Markets - Independent Analysis of Annual Sales in US$ Thousand for Years 2014 through 2022 and % CAGR
- TABLE 172: Middle East 16-Year Perspective for Automated Barriers and Bollards by Type - Percentage Breakdown of Value Sales for Automated Barriers and Automated Bollards for the Years 2014, 2024 & 2030
- TABLE 173: Middle East Recent Past, Current & Future Analysis for Automated Barriers and Bollards by Technology Type - Push Button, RFID, Remote Controlled, Loop Detectors and Other Technology Types - Independent Analysis of Annual Sales in US$ Thousand for the Years 2023 through 2030 and % CAGR
- TABLE 174: Middle East Historic Review for Automated Barriers and Bollards by Technology Type - Push Button, RFID, Remote Controlled, Loop Detectors and Other Technology Types Markets - Independent Analysis of Annual Sales in US$ Thousand for Years 2014 through 2022 and % CAGR
- TABLE 175: Middle East 16-Year Perspective for Automated Barriers and Bollards by Technology Type - Percentage Breakdown of Value Sales for Push Button, RFID, Remote Controlled, Loop Detectors and Other Technology Types for the Years 2014, 2024 & 2030
- IRAN
- TABLE 176: Iran Recent Past, Current & Future Analysis for Automated Barriers and Bollards by Type - Automated Barriers and Automated Bollards - Independent Analysis of Annual Sales in US$ Thousand for the Years 2023 through 2030 and % CAGR
- TABLE 177: Iran Historic Review for Automated Barriers and Bollards by Type - Automated Barriers and Automated Bollards Markets - Independent Analysis of Annual Sales in US$ Thousand for Years 2014 through 2022 and % CAGR
- TABLE 178: Iran 16-Year Perspective for Automated Barriers and Bollards by Type - Percentage Breakdown of Value Sales for Automated Barriers and Automated Bollards for the Years 2014, 2024 & 2030
- TABLE 179: Iran Recent Past, Current & Future Analysis for Automated Barriers and Bollards by Technology Type - Push Button, RFID, Remote Controlled, Loop Detectors and Other Technology Types - Independent Analysis of Annual Sales in US$ Thousand for the Years 2023 through 2030 and % CAGR
- TABLE 180: Iran Historic Review for Automated Barriers and Bollards by Technology Type - Push Button, RFID, Remote Controlled, Loop Detectors and Other Technology Types Markets - Independent Analysis of Annual Sales in US$ Thousand for Years 2014 through 2022 and % CAGR
- TABLE 181: Iran 16-Year Perspective for Automated Barriers and Bollards by Technology Type - Percentage Breakdown of Value Sales for Push Button, RFID, Remote Controlled, Loop Detectors and Other Technology Types for the Years 2014, 2024 & 2030
- ISRAEL
- TABLE 182: Israel Recent Past, Current & Future Analysis for Automated Barriers and Bollards by Type - Automated Barriers and Automated Bollards - Independent Analysis of Annual Sales in US$ Thousand for the Years 2023 through 2030 and % CAGR
- TABLE 183: Israel Historic Review for Automated Barriers and Bollards by Type - Automated Barriers and Automated Bollards Markets - Independent Analysis of Annual Sales in US$ Thousand for Years 2014 through 2022 and % CAGR
- TABLE 184: Israel 16-Year Perspective for Automated Barriers and Bollards by Type - Percentage Breakdown of Value Sales for Automated Barriers and Automated Bollards for the Years 2014, 2024 & 2030
- TABLE 185: Israel Recent Past, Current & Future Analysis for Automated Barriers and Bollards by Technology Type - Push Button, RFID, Remote Controlled, Loop Detectors and Other Technology Types - Independent Analysis of Annual Sales in US$ Thousand for the Years 2023 through 2030 and % CAGR
- TABLE 186: Israel Historic Review for Automated Barriers and Bollards by Technology Type - Push Button, RFID, Remote Controlled, Loop Detectors and Other Technology Types Markets - Independent Analysis of Annual Sales in US$ Thousand for Years 2014 through 2022 and % CAGR
- TABLE 187: Israel 16-Year Perspective for Automated Barriers and Bollards by Technology Type - Percentage Breakdown of Value Sales for Push Button, RFID, Remote Controlled, Loop Detectors and Other Technology Types for the Years 2014, 2024 & 2030
- SAUDI ARABIA
- TABLE 188: Saudi Arabia Recent Past, Current & Future Analysis for Automated Barriers and Bollards by Type - Automated Barriers and Automated Bollards - Independent Analysis of Annual Sales in US$ Thousand for the Years 2023 through 2030 and % CAGR
- TABLE 189: Saudi Arabia Historic Review for Automated Barriers and Bollards by Type - Automated Barriers and Automated Bollards Markets - Independent Analysis of Annual Sales in US$ Thousand for Years 2014 through 2022 and % CAGR
- TABLE 190: Saudi Arabia 16-Year Perspective for Automated Barriers and Bollards by Type - Percentage Breakdown of Value Sales for Automated Barriers and Automated Bollards for the Years 2014, 2024 & 2030
- TABLE 191: Saudi Arabia Recent Past, Current & Future Analysis for Automated Barriers and Bollards by Technology Type - Push Button, RFID, Remote Controlled, Loop Detectors and Other Technology Types - Independent Analysis of Annual Sales in US$ Thousand for the Years 2023 through 2030 and % CAGR
- TABLE 192: Saudi Arabia Historic Review for Automated Barriers and Bollards by Technology Type - Push Button, RFID, Remote Controlled, Loop Detectors and Other Technology Types Markets - Independent Analysis of Annual Sales in US$ Thousand for Years 2014 through 2022 and % CAGR
- TABLE 193: Saudi Arabia 16-Year Perspective for Automated Barriers and Bollards by Technology Type - Percentage Breakdown of Value Sales for Push Button, RFID, Remote Controlled, Loop Detectors and Other Technology Types for the Years 2014, 2024 & 2030
- UNITED ARAB EMIRATES
- TABLE 194: UAE Recent Past, Current & Future Analysis for Automated Barriers and Bollards by Type - Automated Barriers and Automated Bollards - Independent Analysis of Annual Sales in US$ Thousand for the Years 2023 through 2030 and % CAGR
- TABLE 195: UAE Historic Review for Automated Barriers and Bollards by Type - Automated Barriers and Automated Bollards Markets - Independent Analysis of Annual Sales in US$ Thousand for Years 2014 through 2022 and % CAGR
- TABLE 196: UAE 16-Year Perspective for Automated Barriers and Bollards by Type - Percentage Breakdown of Value Sales for Automated Barriers and Automated Bollards for the Years 2014, 2024 & 2030
- TABLE 197: UAE Recent Past, Current & Future Analysis for Automated Barriers and Bollards by Technology Type - Push Button, RFID, Remote Controlled, Loop Detectors and Other Technology Types - Independent Analysis of Annual Sales in US$ Thousand for the Years 2023 through 2030 and % CAGR
- TABLE 198: UAE Historic Review for Automated Barriers and Bollards by Technology Type - Push Button, RFID, Remote Controlled, Loop Detectors and Other Technology Types Markets - Independent Analysis of Annual Sales in US$ Thousand for Years 2014 through 2022 and % CAGR
- TABLE 199: UAE 16-Year Perspective for Automated Barriers and Bollards by Technology Type - Percentage Breakdown of Value Sales for Push Button, RFID, Remote Controlled, Loop Detectors and Other Technology Types for the Years 2014, 2024 & 2030
- REST OF MIDDLE EAST
- TABLE 200: Rest of Middle East Recent Past, Current & Future Analysis for Automated Barriers and Bollards by Type - Automated Barriers and Automated Bollards - Independent Analysis of Annual Sales in US$ Thousand for the Years 2023 through 2030 and % CAGR
- TABLE 201: Rest of Middle East Historic Review for Automated Barriers and Bollards by Type - Automated Barriers and Automated Bollards Markets - Independent Analysis of Annual Sales in US$ Thousand for Years 2014 through 2022 and % CAGR
- TABLE 202: Rest of Middle East 16-Year Perspective for Automated Barriers and Bollards by Type - Percentage Breakdown of Value Sales for Automated Barriers and Automated Bollards for the Years 2014, 2024 & 2030
- TABLE 203: Rest of Middle East Recent Past, Current & Future Analysis for Automated Barriers and Bollards by Technology Type - Push Button, RFID, Remote Controlled, Loop Detectors and Other Technology Types - Independent Analysis of Annual Sales in US$ Thousand for the Years 2023 through 2030 and % CAGR
- TABLE 204: Rest of Middle East Historic Review for Automated Barriers and Bollards by Technology Type - Push Button, RFID, Remote Controlled, Loop Detectors and Other Technology Types Markets - Independent Analysis of Annual Sales in US$ Thousand for Years 2014 through 2022 and % CAGR
- TABLE 205: Rest of Middle East 16-Year Perspective for Automated Barriers and Bollards by Technology Type - Percentage Breakdown of Value Sales for Push Button, RFID, Remote Controlled, Loop Detectors and Other Technology Types for the Years 2014, 2024 & 2030
- AFRICA
- Automated Barriers and Bollards Market Presence - Strong/Active/Niche/Trivial - Key Competitors in Africa for 2024 (E)
- TABLE 206: Africa Recent Past, Current & Future Analysis for Automated Barriers and Bollards by Type - Automated Barriers and Automated Bollards - Independent Analysis of Annual Sales in US$ Thousand for the Years 2023 through 2030 and % CAGR
- TABLE 207: Africa Historic Review for Automated Barriers and Bollards by Type - Automated Barriers and Automated Bollards Markets - Independent Analysis of Annual Sales in US$ Thousand for Years 2014 through 2022 and % CAGR
- TABLE 208: Africa 16-Year Perspective for Automated Barriers and Bollards by Type - Percentage Breakdown of Value Sales for Automated Barriers and Automated Bollards for the Years 2014, 2024 & 2030
- TABLE 209: Africa Recent Past, Current & Future Analysis for Automated Barriers and Bollards by Technology Type - Push Button, RFID, Remote Controlled, Loop Detectors and Other Technology Types - Independent Analysis of Annual Sales in US$ Thousand for the Years 2023 through 2030 and % CAGR
- TABLE 210: Africa Historic Review for Automated Barriers and Bollards by Technology Type - Push Button, RFID, Remote Controlled, Loop Detectors and Other Technology Types Markets - Independent Analysis of Annual Sales in US$ Thousand for Years 2014 through 2022 and % CAGR
- TABLE 211: Africa 16-Year Perspective for Automated Barriers and Bollards by Technology Type - Percentage Breakdown of Value Sales for Push Button, RFID, Remote Controlled, Loop Detectors and Other Technology Types for the Years 2014, 2024 & 2030