|
시장보고서
상품코드
1908496
미세유체 시장 규모, 점유율, 동향 분석 보고서 : 제품별, 용도별, 재료별, 기술별, 지역별, 부문별 예측(2026-2033년)Microfluidics Market Size, Share & Trends Analysis Report By Product (Microfluidic-based Devices, Microfluidic Components), By Application (Medical, Non-Medical), By Material (Silicon, Glass), By Technology, By Region, And Segment Forecasts, 2026 - 2033 |
||||||
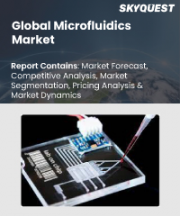
미세유체 시장 개요
세계의 미세유체 시장 규모는 2025년에 419억 2,000만 달러로 추정되며, 2033년에 1,051억 3,000만 달러에 달할 것으로 예측됩니다.
2026-2033년 12.22%의 CAGR을 기록할 것으로 예상됩니다. 이러한 성장은 주로 연구 및 진단 분야의 다양한 분야에서 미세유체 기기의 채택이 확대됨에 따라 주도되고 있습니다.
진단 의료 분야에서 미세유체 기술의 발전과 채택
병원 비용 상승과 환자의 잦은 재입원으로 인해 신뢰할 수 있는 진단 도구에 대한 수요가 증가하고 있으며, 재택 모니터링을 포함한 병원 전 및 현장 진료(POC) 솔루션을 통해 병원 방문과 입원을 최소화할 수 있습니다. Abbott, Roche, Danaher 등 주요 기업들은 질병의 조기 발견, 검사 시간 단축, 정확도 향상, 비침습적 샘플링을 동시에 실현하기 위해 미세유체 기술을 진단 플랫폼에 통합하여 IVD 시장의 성장을 주도하고 있습니다.
미세유체 기술을 적용한 PoCT 솔루션은 민감도와 특이성 향상, 신속한 결과 보고를 실현하고 있으며, 각 제조사들은 긴급한 검사 수요에 대응하기 위해 미세유체 기술을 적용한 진단키트 출시를 서두르고 있습니다. 예를 들어, 2021년 10월 LumiraDx는 인도 CDSCO로부터 COVID-19 항원 검사에 대한 긴급 사용 허가를 받았습니다. 이는 팬데믹 대응과 공중보건 진단에서 미세유체 기술의 중요한 역할을 강조합니다.
자주 묻는 질문
목차
제1장 조사 방법과 범위
제2장 주요 요약
제3장 시장 변수, 동향, 범위
- 시장 동향 전망
- 상부 시장 전망
- 관련/부수 시장 전망
- 시장 역학
- 미세유체 시장 분석 툴
- 산업 분석 : Porter's Five Forces
- PESTEL 분석
제4장 미세유체 시장 : 제품 비즈니스 분석
- 세계의 미세유체 시장의 제품 변동 분석
- 세계의 미세유체 시장 규모와 동향 분석(제품별, 2021-2033년)
- 미세유체 기술에 의한 디바이스
- 미세유체 컴포넌트
제5장 미세유체 시장 : 용도별 비즈니스 분석
- 세계의 미세유체 시장의 용도 변동 분석
- 세계의 미세유체 시장 규모와 동향 분석(용도별, 2021-2033년)
- 의료
- 비의료 부문
제6장 미세유체 시장 : 재료별 비즈니스 분석
- 세계의 미세유체 시장의 재료 변동 분석
- 세계의 미세유체 시장 규모와 동향 분석(재료별, 2021-2033년)
- 실리콘
- 유리
- 폴리머
- 폴리디메틸실록산(PDMS)
- 기타
제7장 미세유체 시장 : 기술별 비즈니스 분석
- 세계의 미세유체 시장의 기술 변동 분석
- 세계의 미세유체 시장 규모와 동향 분석(기술별, 2021-2033년)
- 랩온어칩
- 장기 칩
- 연속류 미세유체공학
- 광유체공학과 미세유체공학
- 음향유체공학과 미세유체공학
- 전기영동과 미세유체공학
제8장 지역별 미세유체 시장 : 지역별, 추정·동향 분석
- 북미
- 미국
- 캐나다
- 멕시코
- 유럽
- 영국
- 독일
- 프랑스
- 이탈리아
- 스페인
- 노르웨이
- 스웨덴
- 덴마크
- 아시아태평양
- 일본
- 중국
- 인도
- 태국
- 한국
- 호주
- 라틴아메리카
- 브라질
- 아르헨티나
- 중동 및 아프리카
- 남아프리카공화국
- 사우디아라비아
- 아랍에미리트
- 쿠웨이트
제9장 경쟁 구도
- 기업 분류
- 전략 매핑
- 2025년의 기업의 시장 포지션 분석
- 기업 개요/리스트
- Illumina, Inc.
- F. Hoffmann-La Roche Ltd.
- Revvity
- Agilent Technologies, Inc.
- Danaher
- Bio-Rad Laboratories, Inc.
- thinXXS Microtechnology GmbH
- Abbott
- Thermo Fisher Scientific, Inc.
- Standard BioTools
Microfluidics Market Summary
The global microfluidics market size was estimated at USD 41.92 billion in 2025 and is projected to reach USD 105.13 billion by 2033, growing at a CAGR of 12.22% from 2026 to 2033. This growth is primarily driven by the increasing adoption of microfluidic devices across various fields of research and diagnostics.
Advancements and Adoption of Microfluidics in Diagnostic Healthcare
The demand for reliable diagnostic tools is increasing due to the soaring hospital charges and frequent patient readmissions, while prehospital and point-of-care (POC) solutions, including at-home monitoring, are minimizing hospital visits and inpatient stays. Major players such as Abbott, Roche, and Danaher are pushing the growth of the IVD market by incorporating microfluidics into their diagnostic platforms for earlier disease detection, faster turnaround times, enhanced accuracy, and, at the same time, non-invasive sampling.
Microfluidics-enhanced PoCT solutions offer improved sensitivity, specificity, and faster turnaround times, prompting manufacturers to launch microfluidics-based diagnostic kits to address urgent testing needs. For example, in October 2021, LumiraDx received Emergency Use Authorization from India's CDSCO for its COVID-19 antigen test, underscoring the critical role of microfluidics in pandemic response and public health diagnostics.
Global Microfluidics Market Report Segmentation
This report forecasts revenue growth and provides an analysis on the latest trends in each of the sub-segments from 2021 to 2033. For this report, Grand View Research has segmented the microfluidics market report based on product, technology, material, application, and region.
- Product Outlook (Revenue, USD Million, 2021 - 2033)
- Microfluidic-based Devices
- Microfluidic Components
- Chips
- Micro-pumps
- Sensors
- Others
- Technology Outlook (Revenue, USD Million, 2021 - 2033)
- Lab-on-a-chip
- Organ-on-a-chip
- Continuous Flow Microfluidics
- Optofluidics & Microfluidics
- Acoustofluidics & Microfluidics
- Electrophoresis & Microfluidics
- Material Outlook (Revenue, USD Million, 2021 - 2033)
- Silicon
- Glass
- Polymer
- PDMS
- Others
- Application Outlook (Revenue, USD Million, 2021 - 2033)
- Medical
- Pharmaceuticals
- Medical Devices
- In-vitro Diagnostics
- Others
- Non-medical
- Regional Outlook (Revenue, USD Million, 2021 - 2033)
- North America
- U.S.
- Canada
- Mexico
- Europe
- UK
- Germany
- France
- Italy
- Spain
- Denmark
- Sweden
- Norway
- Asia Pacific
- Japan
- China
- India
- South Korea
- Australia
- Thailand
- Latin America
- Brazil
- Argentina
- Middle East & Africa
- South Africa
- Saudi Arabia
- UAE
- Kuwait
Table of Contents
Chapter 1. Methodology and Scope
- 1.1. Market Segmentation and Scope
- 1.2. Market Definitions
- 1.2.1. Product Segment
- 1.2.2. Application Segment
- 1.2.3. Material Segment
- 1.2.4. Technology Segment
- 1.3. Information analysis
- 1.4. Market formulation & data visualization
- 1.5. Data validation & publishing
- 1.6. Information Procurement
- 1.6.1. Primary Research
- 1.7. Information or Data Analysis
- 1.8. Market Formulation & Validation
- 1.9. Market Model
- 1.10. Objectives
Chapter 2. Executive Summary
- 2.1. Market Outlook
- 2.2. Segment Snapshot
- 2.3. Competitive Landscape Snapshot
Chapter 3. Market Variables, Trends, & Scope
- 3.1. Market Lineage Outlook
- 3.1.1. Parent market outlook
- 3.1.2. Related/ancillary market outlook
- 3.2. Market Dynamics
- 3.2.1. Market driver analysis
- 3.2.1.1. Advancements in 3D Printing & Digital Manufacturing
- 3.2.1.2. Rising Research & Development Investments
- 3.2.2. Market restraint analysis
- 3.2.2.1. High initial costs
- 3.2.1. Market driver analysis
- 3.3. Microfluidics Market Analysis Tools
- 3.3.1. Industry Analysis - Porter's
- 3.3.2. PESTEL Analysis
Chapter 4. Microfluidics Market: Product Business Analysis
- 4.1. Product Segment Dashboard
- 4.2. Global Microfluidics Market Product Movement Analysis
- 4.3. Global Microfluidics Market Size & Trend Analysis, by Product, 2021 to 2033 (USD Million)
- 4.4. Microfluidic-based Devices
- 4.4.1. Global Microfluidic based Devices Market, 2021 - 2033 (USD Million)
- 4.4.2. Chips
- 4.4.2.1. Global Chips Market, 2021 - 2033 (USD Million)
- 4.4.3. Micro-pumps
- 4.4.3.1. Global Micro-pumps Market, 2021 - 2033 (USD Million)
- 4.4.4. Sensors
- 4.4.4.1. Global Sensors Market, 2021 - 2033 (USD Million)
- 4.4.5. Others
- 4.4.5.1. Global Others Market, 2021 - 2033 (USD Million)
- 4.5. Microfluidic Components
- 4.5.1. Global Microfluidic Components Market, 2021 - 2033 (USD Million)
Chapter 5. Microfluidics Market: Application Business Analysis
- 5.1. Application Segment Dashboard
- 5.2. Global Microfluidics Market Application Movement Analysis
- 5.3. Global Microfluidics Market Size & Trend Analysis, by Application, 2021 to 2033 (USD Million)
- 5.4. Medical
- 5.4.1. Pharmaceuticals
- 5.4.1.1. Global Pharmaceuticals Market, 2021 - 2033 (USD Million)
- 5.4.2. Medical Devices
- 5.4.2.1. Global Medical Devices Market, 2021 - 2033 (USD Million)
- 5.4.3. In-vitro Diagnostics
- 5.4.3.1. Global In-vitro Diagnostics Market, 2021 - 2033 (USD Million)
- 5.4.4. Others
- 5.4.4.1. Global Others Market, 2021 - 2033 (USD Million)
- 5.4.1. Pharmaceuticals
- 5.5. Non-Medical
- 5.5.1. Global Non-Medical Market, 2021 - 2033 (USD Million)
Chapter 6. Microfluidics Market: Material Business Analysis
- 6.1. Material Segment Dashboard
- 6.2. Global Microfluidics Market Material Movement Analysis
- 6.3. Global Microfluidics Market Size & Trend Analysis, by Material, 2021 to 2033 (USD Million)
- 6.4. Silicon
- 6.4.1. Global Silicon Market, 2021 - 2033 (USD Million)
- 6.5. Glass
- 6.5.1. Global Glass Market, 2021 - 2033 (USD Million)
- 6.6. Polymer
- 6.6.1. Global Polymer Market, 2021 - 2033 (USD Million)
- 6.7. Polydimethylsiloxane (PDMS)
- 6.7.1. Global Polydimethylsiloxane (PDMS) Market, 2021 - 2033 (USD Million)
- 6.8. Others
- 6.8.1. Global Others Market, 2021 - 2033 (USD Million)
Chapter 7. Microfluidics Market: Technology Business Analysis
- 7.1. Technology Segment Dashboard
- 7.2. Global Microfluidics Market Technology Movement Analysis
- 7.3. Global Microfluidics Market Size & Trend Analysis, by Technology, 2021 to 2033 (USD Million)
- 7.4. Lab-on-a-chip
- 7.4.1. Global Lab-on-a-chip Market, 2021 - 2033 (USD Million)
- 7.5. Organs-on-chips
- 7.5.1. Global Organs-on-chips Market, 2021 - 2033 (USD Million)
- 7.6. Continuous flow microfluidics
- 7.6.1. Global Continuous Flow Microfluidics Market, 2021 - 2033 (USD Million)
- 7.7. Optofluidics and microfluidics
- 7.7.1. Global Optofluidics and microfluidics Market, 2021 - 2033 (USD Million)
- 7.8. Acoustofluidics and microfluidics
- 7.8.1. Global Acoustofluidics and microfluidics Market, 2021 - 2033 (USD Million)
- 7.9. Electrophoresis and microfluidics
- 7.9.1. Global Electrophoresis and microfluidics Market, 2021 - 2033 (USD Million)
Chapter 8. Regional Microfluidics Market: Region Estimates & Trend Analysis
- 8.1. North America
- 8.1.1. North America market estimates and forecasts 2021 - 2033 (USD Million)
- 8.1.2. U.S.
- 8.1.2.1. Key country dynamics
- 8.1.2.2. Competitive scenario
- 8.1.2.3. Regulatory Framework
- 8.1.2.4. U.S. market estimates and forecasts 2021 - 2033 (USD Million)
- 8.1.3. Canada
- 8.1.3.1. Key country dynamics
- 8.1.3.2. Competitive scenario
- 8.1.3.3. Regulatory Framework
- 8.1.3.4. Canada market estimates and forecasts 2021 - 2033 (USD Million)
- 8.1.4. Mexico
- 8.1.4.1. Key country dynamics
- 8.1.4.2. Competitive scenario
- 8.1.4.3. Regulatory Framework
- 8.1.4.4. Mexico market estimates and forecasts 2021 - 2033 (USD Million)
- 8.2. Europe
- 8.2.1. Europe market estimates and forecasts 2021 - 2033 (USD Million)
- 8.2.2. UK
- 8.2.2.1. Key country dynamics
- 8.2.2.2. Competitive scenario
- 8.2.2.3. Regulatory Framework
- 8.2.2.4. UK market estimates and forecasts 2021 - 2033 (USD Million)
- 8.2.3. Germany
- 8.2.3.1. Key country dynamics
- 8.2.3.2. Competitive scenario
- 8.2.3.3. Regulatory Framework
- 8.2.3.4. Germany market estimates and forecasts 2021 - 2033 (USD Million)
- 8.2.4. France
- 8.2.4.1. Key country dynamics
- 8.2.4.2. Competitive scenario
- 8.2.4.3. Regulatory Framework
- 8.2.4.4. France market estimates and forecasts 2021 - 2033 (USD Million)
- 8.2.5. Italy
- 8.2.5.1. Key country dynamics
- 8.2.5.2. Competitive scenario
- 8.2.5.3. Regulatory Framework
- 8.2.5.4. Italy market estimates and forecasts 2021 - 2033 (USD Million)
- 8.2.6. Spain
- 8.2.6.1. Key country dynamics
- 8.2.6.2. Competitive scenario
- 8.2.6.3. Regulatory Framework
- 8.2.6.4. Spain market estimates and forecasts 2021 - 2033 (USD Million)
- 8.2.7. Norway
- 8.2.7.1. Key country dynamics
- 8.2.7.2. Competitive scenario
- 8.2.7.3. Regulatory Framework
- 8.2.7.4. Norway market estimates and forecasts 2021 - 2033 (USD Million)
- 8.2.8. Sweden
- 8.2.8.1. Key country dynamics
- 8.2.8.2. Competitive scenario
- 8.2.8.3. Regulatory Framework
- 8.2.8.4. Sweden market estimates and forecasts 2021 - 2033 (USD Million)
- 8.2.9. Denmark
- 8.2.9.1. Key country dynamics
- 8.2.9.2. Competitive scenario
- 8.2.9.3. Regulatory Framework
- 8.2.9.4. Denmark market estimates and forecasts 2021 - 2033 (USD Million)
- 8.3. Asia Pacific
- 8.3.1. Asia Pacific market estimates and forecasts 2021 - 2033 (USD Million)
- 8.3.2. Japan
- 8.3.2.1. Key country dynamics
- 8.3.2.2. Competitive scenario
- 8.3.2.3. Regulatory Framework
- 8.3.2.4. Japan market estimates and forecasts 2021 - 2033 (USD Million)
- 8.3.3. China
- 8.3.3.1. Key country dynamics
- 8.3.3.2. Competitive scenario
- 8.3.3.3. Regulatory Framework
- 8.3.3.4. China market estimates and forecasts 2021 - 2033 (USD Million)
- 8.3.4. India
- 8.3.4.1. Key country dynamics
- 8.3.4.2. Competitive scenario
- 8.3.4.3. Regulatory Framework
- 8.3.4.4. India market estimates and forecasts 2021 - 2033 (USD Million)
- 8.3.5. Thailand
- 8.3.5.1. Key country dynamics
- 8.3.5.2. Competitive scenario
- 8.3.5.3. Regulatory Framework
- 8.3.5.4. Thailand market estimates and forecasts 2021 - 2033 (USD Million)
- 8.3.6. South Korea
- 8.3.6.1. Key country dynamics
- 8.3.6.2. Competitive scenario
- 8.3.6.3. Regulatory Framework
- 8.3.6.4. South Korea market estimates and forecasts 2021 - 2033 (USD Million)
- 8.3.7. Australia
- 8.3.7.1. Key country dynamics
- 8.3.7.2. Competitive scenario
- 8.3.7.3. Regulatory Framework
- 8.3.7.4. Australia market estimates and forecasts 2021 - 2033 (USD Million)
- 8.4. Latin America
- 8.4.1. Latin America market estimates and forecasts 2021 - 2033 (USD Million)
- 8.4.2. Brazil
- 8.4.2.1. Key country dynamics
- 8.4.2.2. Competitive scenario
- 8.4.2.3. Regulatory Framework
- 8.4.2.4. Brazil market estimates and forecasts 2021 - 2033 (USD Million)
- 8.4.3. Argentina
- 8.4.3.1. Key country dynamics
- 8.4.3.2. Competitive scenario
- 8.4.3.3. Regulatory Framework
- 8.4.3.4. Argentina market estimates and forecasts 2021 - 2033 (USD Million)
- 8.5. Middle East & Africa
- 8.5.1. Middle East & Africa market estimates and forecasts 2021 - 2033 (USD Million)
- 8.5.2. South Africa
- 8.5.2.1. Key country dynamics
- 8.5.2.2. Competitive scenario
- 8.5.2.3. Regulatory Framework
- 8.5.2.4. South Africa market estimates and forecasts 2021 - 2033 (USD Million)
- 8.5.3. Saudi Arabia
- 8.5.3.1. Key country dynamics
- 8.5.3.2. Competitive scenario
- 8.5.3.3. Regulatory Framework
- 8.5.3.4. Saudi Arabia market estimates and forecasts 2021 - 2033 (USD Million)
- 8.5.4. UAE
- 8.5.4.1. Key country dynamics
- 8.5.4.2. Competitive scenario
- 8.5.4.3. Regulatory Framework
- 8.5.4.4. UAE market estimates and forecasts 2021 - 2033 (USD Million)
- 8.5.5. Kuwait
- 8.5.5.1. Key country dynamics
- 8.5.5.2. Competitive scenario
- 8.5.5.3. Regulatory Framework
- 8.5.5.4. Kuwait market estimates and forecasts 2021 - 2033 (USD Million)
Chapter 9. Competitive Landscape
- 9.1. Company Categorization
- 9.2. Strategy Mapping
- 9.3. Company Market Position Analysis, 2025
- 9.4. Company Profiles/Listing
- 9.4.1. Illumina, Inc.
- 9.4.1.1. Overview
- 9.4.1.2. Financial Performance
- 9.4.1.3. Product Benchmarking
- 9.4.1.4. Strategic Initiatives
- 9.4.2. F. Hoffmann-La Roche Ltd.
- 9.4.2.1. Overview
- 9.4.2.2. Financial Performance
- 9.4.2.3. Product Benchmarking
- 9.4.2.4. Strategic Initiatives
- 9.4.3. Revvity
- 9.4.3.1. Overview
- 9.4.3.2. Financial Performance
- 9.4.3.3. Product Benchmarking
- 9.4.3.4. Strategic Initiatives
- 9.4.4. Agilent Technologies, Inc.
- 9.4.4.1. Overview
- 9.4.4.2. Financial Performance
- 9.4.4.3. Product Benchmarking
- 9.4.4.4. Strategic Initiatives
- 9.4.5. Danaher
- 9.4.5.1. Overview
- 9.4.5.2. Financial Performance
- 9.4.5.3. Product Benchmarking
- 9.4.5.4. Strategic Initiatives
- 9.4.6. Bio-Rad Laboratories, Inc.
- 9.4.6.1. Overview
- 9.4.6.2. Financial Performance
- 9.4.6.3. Product Benchmarking
- 9.4.6.4. Strategic Initiatives
- 9.4.7. thinXXS Microtechnology GmbH
- 9.4.7.1. Overview
- 9.4.7.2. Financial Performance
- 9.4.7.3. Product Benchmarking
- 9.4.7.4. Strategic Initiatives
- 9.4.8. Abbott
- 9.4.8.1. Overview
- 9.4.8.2. Financial Performance
- 9.4.8.3. Product Benchmarking
- 9.4.8.4. Strategic Initiatives
- 9.4.9. Thermo Fisher Scientific, Inc.
- 9.4.9.1. Overview
- 9.4.9.2. Financial Performance
- 9.4.9.3. Product Benchmarking
- 9.4.9.4. Strategic Initiatives
- 9.4.10. Standard BioTools
- 9.4.10.1. Overview
- 9.4.10.2. Financial Performance
- 9.4.10.3. Product Benchmarking
- 9.4.10.4. Strategic Initiatives
- 9.4.1. Illumina, Inc.