|
시장보고서
상품코드
1941826
임상 의사결정 지원 시스템 시장 규모, 점유율과 동향 분석 보고서 : 제품별, 용도별, 제공 모드별, 컴포넌트별, 지역별, 부문 예측(2026-2033년)Clinical Decision Support Systems Market Size, Share & Trends Analysis Report By Product (Standalone CDSS, Integrated EHR with CDSS), By Application (Drug-Drug Interactions), By Delivery Mode, By Component, By Region, And Segment Forecasts, 2026 - 2033 |
||||||
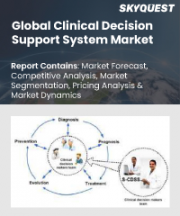
임상 의사결정 지원 시스템 시장 요약
세계의 임상 의사결정 지원 시스템 시장 규모는 2025년에 63억 6,000만 달러로 추정되며, 2033년까지 153억 2,000만 달러에 이를 것으로 예측됩니다.
또한 2026-2033년 연평균 복합 성장률(CAGR) 11.8%를 나타낼 것으로 예측됩니다. 임상 의사결정 지원 시스템은 지난 수십년동안 괄목할 만한 발전을 이루었으며, 의료진이 환자 치료에 있어 정보에 입각한 의사결정을 내릴 수 있는 중요한 도구를 제공합니다.
이러한 시스템은 환자의 치료 결과를 개선하고 전체 의료비를 절감할 수 있는 유망한 수단으로 떠오르고 있습니다. 의료 과실 감소와 환자 안전 강화에 대한 요구가 높아지면서 임상 의사결정 지원 시스템 시장의 성장을 주도하고 있으며, 의료 서비스 제공업체들은 정확하고 일관된 임상 의사결정을 지원하는 기술에 대한 의존도가 점점 더 높아지고 있습니다. CDSS 솔루션은 진료현장에서 실시간 알림, 근거에 기반한 권고사항, 약물 상호작용 및 약물 알레르기 체크, 표준화된 임상 가이드라인을 제공함으로써 진단, 투약, 치료상의 오류를 최소화할 수 있도록 돕습니다. CDSS는 임상의에게 시의적절하고 상황에 맞는 인사이트를 제공함으로써 모범 사례 준수를 촉진하고, 부작용을 줄이며, 전반적인 의료의 질을 향상시킵니다. 특히 가치 기반 의료 및 인증 요건 하에서 환자 안전이 병원과 지불자의 핵심 품질 지표가 되면서, 의료기관은 치료 결과 개선, 법적 책임 위험 감소, 안전한 임상 워크플로우를 보장하기 위해 CDSS 도입을 가속화하고 있습니다.
개인 맞춤형 의료의 도입이 진행되는 가운데, CDSS는 중요한 역할을 담당하고 있습니다. 이 시스템은 유전자 프로파일과 병력을 포함한 환자 데이터를 분석하여 개인별 맞춤 치료 계획을 수립합니다. CDSS는 개인화된 추천을 제공함으로써 치료 효과를 높이고, 부작용 위험을 줄이며, 시장 성장을 가속하고 있습니다.
세계 각국 정부는 CDSS 및 기타 의료 IT 솔루션을 촉진하기 위해 규제와 인센티브를 도입하고 있습니다. 이러한 규제는 환자 안전, 상호운용성, 의료의 질 향상에 초점을 맞추고 있으며, 의료기관은 규제 요건을 준수하고 인센티브를 얻기 위해 CDSS에 투자하고 있습니다.
자주 묻는 질문
목차
제1장 조사 방법과 범위
제2장 주요 요약
제3장 임상 의사결정 지원 시스템 시장 변수, 동향 및 범위
제4장 임상 의사결정 지원 시스템 시장 : 제품별 추정 및 동향 분석
제5장 임상 의사결정 지원 시스템 시장 : 용도별 추정 및 동향 분석
제6장 임상 의사결정 지원 시스템 시장 : 제공 형태별 추정 및 동향 분석
제7장 임상 의사결정 지원 시스템 시장 : 컴포넌트별 추정 및 동향 분석
제8장 임상 의사결정 지원 시스템 시장 : 지역별 추정 및 동향 분석, 유형별, 용도별, 제공 모드별, 컴포넌트별
제9장 경쟁 구도
LSH 26.03.17Clinical Decision Support Systems Market Summary
The global clinical decision support systems market size was estimated at USD 6.36 billion in 2025 and is estimated to reach USD 15.32 billion by 2033, growing at a CAGR of 11.8% from 2026 to 2033. Clinical decision support systems have experienced significant advancement in recent decades, providing clinicians with vital tools to make informed decisions in patient care.
These systems have emerged as a promising means to improve patient outcomes and reduce overall healthcare costs. The growing need to reduce medical errors and enhance patient safety is driving the growth of clinical decision support systems market, as healthcare providers increasingly rely on technology to support accurate and consistent clinical decision making. CDSS solutions help minimize diagnostic, medication, and treatment errors by providing real-time alerts, evidence-based recommendations, drug-drug and drug allergy interaction checks, and standardized clinical guidelines at the point of care. By supporting clinicians with timely and context-specific insights, CDSS improves adherence to best practices, reduces adverse events, and enhances overall care quality. As patient safety has become a core quality metric for hospitals and payers particularly under value-based care and accreditation requirements healthcare organizations are accelerating CDSS adoption to improve outcomes, reduce liability risks, and ensure safer clinical workflows.
The adoption of personalized medicine is increasing, with CDSSs playing a crucial role. These systems analyze patient data, including genetic profiles and medical histories, to customize treatment plans for individuals. By providing tailored recommendations, CDSSs enhance treatment effectiveness and reduce the risk of adverse reactions, driving market growth.
Governments worldwide are implementing regulations and incentives to promote CDSS and other healthcare IT solutions. These regulations focus on enhancing patient safety, interoperability, and care quality, prompting healthcare organizations to invest in CDSS to comply with regulatory requirements and qualify for incentives.
Clinical Decision Support Systems Market Segmentation
This report forecasts revenue growth at the global, regional & country levels and provides an analysis of the latest industry trends and opportunities in each of the sub-segments from 2021 to 2033. For this study, Grand View Research has segmented the global clinical decision support systems market report on the basis of product, application, delivery mode, component, and region:
- Product Outlook (Revenue, USD Million, 2021 - 2033)
- Standalone CDSS
- Integrated CPOE with CDSS
- Integrated EHR with CDSS
- Integrated CDSS with CPOE & EHR
- Application Outlook (Revenue, USD Million, 2021 - 2033)
- Drug-drug interactions
- Drug allergy alerts
- Clinical reminders
- Clinical guidelines
- Drug dosing support
- Others
- Delivery Mode Outlook (Revenue, USD Million, 2021 - 2033)
- Web-based Systems
- Cloud-based Systems
- On -premise Systems
- Component Outlook (Revenue, USD Million, 2021 - 2033)
- Hardware
- Software
- Services
- Regional Outlook (Revenue, USD Million, 2021 - 2033)
- North America
- U.S.
- Canada
- Mexico
- Europe
- Germany
- UK
- Italy
- Spain
- France
- Sweden
- Denmark
- Norway
- Asia Pacific
- China
- India
- Japan
- Thailand
- South Korea
- Australia
- Latin America
- Brazil
- Argentina
- MEA
- South Africa
- Saudi Arabia
- UAE
- Kuwait
Table of Contents
Chapter 1. Methodology and Scope
- 1.1. Market Segmentation & Scope
- 1.1.1. Product
- 1.1.2. Application
- 1.1.3. Delivery Mode
- 1.1.4. Component
- 1.1.5. Regional scope
- 1.1.6. Estimates and forecast timeline.
- 1.2. Research Methodology
- 1.3. Information Procurement
- 1.3.1. Purchased database.
- 1.3.2. GVR's internal database
- 1.3.3. Secondary sources
- 1.3.4. Primary research
- 1.3.5. Details of primary research
- 1.4. Information or Data Analysis
- 1.4.1. Data analysis models
- 1.5. Market Formulation & Validation
- 1.6. Model Details
- 1.6.1. Commodity flow analysis (Model 1)
- 1.6.2. Approach 1: Commodity flow approach
- 1.6.3. Volume price analysis (Model 2)
- 1.6.4. Approach 2: Volume price analysis
- 1.7. List of Secondary Sources
- 1.8. List of Primary Sources
- 1.9. Objectives
Chapter 2. Executive Summary
- 2.1. Market Outlook
- 2.2. Segment Outlook
- 2.2.1. Product outlook
- 2.2.2. Application outlook
- 2.2.3. Delivery mode outlook
- 2.2.4. Component outlook
- 2.2.5. Regional outlook
- 2.3. Competitive Insights
Chapter 3. Clinical Decision Support Systems Market Variables, Trends & Scope
- 3.1. Market Lineage Outlook
- 3.1.1. Parent market outlook
- 3.1.2. Related/ancillary market outlook
- 3.2. Market Dynamics
- 3.2.1. Market driver analysis
- 3.2.1.1. Rising Adoption of Electronic Health Records (EHRs)
- 3.2.1.2. Increasing Demand for Quality Care and Patient Safety
- 3.2.1.3. Advancements in AI and Machine Learning Technologies
- 3.2.1.4. Supportive Government Initiatives and Healthcare IT Policies
- 3.2.1.5. Integration of CDSS with Clinical Workflows
- 3.2.1.6. Need to Reduce Medication Errors and Diagnostic Inaccuracies
- 3.2.1.7. Emergence of Cloud-Based CDSS Solutions
- 3.2.2. Market restraint analysis
- 3.2.2.1. High Implementation and Integration Costs
- 3.2.2.2. Data Privacy and Security Concerns
- 3.2.2.3. Interoperability Challenges with Legacy Systems
- 3.2.3. Technological Advancements & AI Integration
- 3.2.3.1. AI & Machine Learning Adoption: How AI is shaping CDSS capabilities.
- 3.2.3.2. Cloud-Based vs. On-Premise Solutions: Which deployment models are gaining traction
- 3.2.3.3. Interoperability & Integration: Compatibility with existing Electronic Health Records (EHRs) and hospital systems
- 3.2.4. Regulatory & Compliance Factors
- 3.2.4.1. FDA & HIPAA Regulations: Impact of compliance on market players
- 3.2.4.2. Data Privacy & Security Risks: Investor concerns about patient data protection
- 3.2.5. Case Study Insights
- 3.2.1. Market driver analysis
- 3.3. Clinical Decision Support Systems Market Analysis Tools
- 3.3.1. Industry Analysis - Porter's
- 3.3.1.1. Supplier power
- 3.3.1.2. Buyer power
- 3.3.1.3. Substitution threat
- 3.3.1.4. Threat of new entrant
- 3.3.1.5. Competitive rivalry
- 3.3.2. PESTEL Analysis
- 3.3.2.1. Political landscape
- 3.3.2.2. Technological landscape
- 3.3.2.3. Economic landscape
- 3.3.2.4. Social landscape
- 3.3.2.5. Legal landscape
- 3.3.1. Industry Analysis - Porter's
Chapter 4. Clinical Decision Support Systems Market: Product Estimates & Trend Analysis
- 4.1. Product Market Share, 2025 & 2033
- 4.2. Segment Dashboard
- 4.3. Global Clinical Decision Support Systems Market by Product Outlook
- 4.4. Standalone CDSS
- 4.4.1. Market estimates and forecast 2021 to 2033 (USD Million)
- 4.5. Integrated CPOE with CDSS
- 4.5.1. Market estimates and forecast 2021 to 2033 (USD Million)
- 4.6. Integrated EHR with CDSS
- 4.6.1. Market estimates and forecast 2021 to 2033 (USD Million)
- 4.7. Integrated CDSS with CPOE and HER
- 4.7.1. Market estimates and forecast 2021 to 2033 (USD Million)
Chapter 5. Clinical Decision Support Systems Market: Application Estimates & Trend Analysis
- 5.1. Application Market Share, 2025 & 2033
- 5.2. Segment Dashboard
- 5.3. Global Clinical Decision Support Systems Market by Application Outlook
- 5.4. Drug-Drug Interactions
- 5.4.1. Market estimates and forecast 2021 to 2033 (USD Million)
- 5.5. Drug Allergy Alerts
- 5.5.1. Market estimates and forecast 2021 to 2033 (USD Million)
- 5.6. Clinical Reminders
- 5.6.1. Market estimates and forecast 2021 to 2033 (USD Million)
- 5.7. Clinical Guidelines
- 5.7.1. Market estimates and forecast 2021 to 2033 (USD Million)
- 5.8. Drug Dosing Support
- 5.8.1. Market estimates and forecast 2021 to 2033 (USD Million)
- 5.9. Others
- 5.9.1. Market estimates and forecast 2021 to 2033 (USD Million)
Chapter 6. Clinical Decision Support Systems Market: Delivery Mode Estimates & Trend Analysis
- 6.1. Delivery Modes Market Share, 2025 & 2033
- 6.2. Segment Dashboard
- 6.3. Clinical Decision Support Systems Market by Delivery Modes Outlook
- 6.4. Web-Based Systems
- 6.4.1. Market estimates and forecast 2021 to 2033 (USD Million)
- 6.5. Cloud-Based Systems
- 6.5.1. Market estimates and forecast 2021 to 2033 (USD Million)
- 6.6. On-Premise Systems
- 6.6.1. Market estimates and forecast 2021 to 2033 (USD Million)
Chapter 7. Clinical Decision Support Systems Market: Component Estimates & Trend Analysis
- 7.1. Component Market Share, 2025 & 2033
- 7.2. Segment Dashboard
- 7.3. Clinical Decision Support Systems Market by Component Outlook
- 7.4. Hardware
- 7.4.1. Market estimates and forecast 2021 to 2033 (USD Million)
- 7.5. Software
- 7.5.1. Market estimates and forecast 2021 to 2033 (USD Million)
- 7.6. Services
- 7.6.1. Market estimates and forecast 2021 to 2033 (USD Million)
Chapter 8. Clinical Decision Support Systems Market: Regional Estimates & Trend Analysis, By Type, By Application, By Delivery Mode, By Component
- 8.1. Regional Market Share Analysis, 2025 & 2033
- 8.2. Regional Market Dashboard
- 8.3. Global Regional Market Snapshot
- 8.4. Market Size, & Forecasts Trend Analysis, 2021 to 2033:
- 8.5. North America
- 8.5.1. U.S.
- 8.5.1.1. Key country dynamics
- 8.5.1.2. Regulatory framework
- 8.5.1.3. Competitive scenario
- 8.5.1.4. U.S. market estimates and forecasts 2021 to 2033 (USD Million)
- 8.5.2. Canada
- 8.5.2.1. Key country dynamics
- 8.5.2.2. Regulatory framework
- 8.5.2.3. Competitive scenario
- 8.5.2.4. Canada market estimates and forecasts 2021 to 2033 (USD Million)
- 8.5.3. Mexico
- 8.5.3.1. Key country dynamics
- 8.5.3.2. Regulatory framework
- 8.5.3.3. Competitive scenario
- 8.5.3.4. Canada market estimates and forecasts 2021 to 2033 (USD Million)
- 8.5.1. U.S.
- 8.6. Europe
- 8.6.1. UK
- 8.6.1.1. Key country dynamics
- 8.6.1.2. Regulatory framework
- 8.6.1.3. Competitive scenario
- 8.6.1.4. UK market estimates and forecasts 2021 to 2033 (USD Million)
- 8.6.2. Germany
- 8.6.2.1. Key country dynamics
- 8.6.2.2. Regulatory framework
- 8.6.2.3. Competitive scenario
- 8.6.2.4. Germany market estimates and forecasts 2021 to 2033 (USD Million)
- 8.6.3. France
- 8.6.3.1. Key country dynamics
- 8.6.3.2. Regulatory framework
- 8.6.3.3. Competitive scenario
- 8.6.3.4. France market estimates and forecasts 2021 to 2033 (USD Million)
- 8.6.4. Italy
- 8.6.4.1. Key country dynamics
- 8.6.4.2. Regulatory framework
- 8.6.4.3. Competitive scenario
- 8.6.4.4. Italy market estimates and forecasts 2021 to 2033 (USD Million)
- 8.6.5. Spain
- 8.6.5.1. Key country dynamics
- 8.6.5.2. Regulatory framework
- 8.6.5.3. Competitive scenario
- 8.6.5.4. Spain market estimates and forecasts 2021 to 2033 (USD Million)
- 8.6.6. Norway
- 8.6.6.1. Key country dynamics
- 8.6.6.2. Regulatory framework
- 8.6.6.3. Competitive scenario
- 8.6.6.4. Norway market estimates and forecasts 2021 to 2033 (USD Million)
- 8.6.7. Sweden
- 8.6.7.1. Key country dynamics
- 8.6.7.2. Regulatory framework
- 8.6.7.3. Competitive scenario
- 8.6.7.4. Sweden market estimates and forecasts 2021 to 2033 (USD Million)
- 8.6.8. Denmark
- 8.6.8.1. Key country dynamics
- 8.6.8.2. Regulatory framework
- 8.6.8.3. Competitive scenario
- 8.6.8.4. Denmark market estimates and forecasts 2021 to 2033 (USD Million)
- 8.6.1. UK
- 8.7. Asia Pacific
- 8.7.1. Japan
- 8.7.1.1. Key country dynamics
- 8.7.1.2. Regulatory framework
- 8.7.1.3. Competitive scenario
- 8.7.1.4. Japan market estimates and forecasts 2021 to 2033 (USD Million)
- 8.7.2. China
- 8.7.2.1. Key country dynamics
- 8.7.2.2. Regulatory framework
- 8.7.2.3. Competitive scenario
- 8.7.2.4. China market estimates and forecasts 2021 to 2033 (USD Million)
- 8.7.3. India
- 8.7.3.1. Key country dynamics
- 8.7.3.2. Regulatory framework
- 8.7.3.3. Competitive scenario
- 8.7.3.4. India market estimates and forecasts 2021 to 2033 (USD Million)
- 8.7.4. Australia
- 8.7.4.1. Key country dynamics
- 8.7.4.2. Regulatory framework
- 8.7.4.3. Competitive scenario
- 8.7.4.4. Australia market estimates and forecasts 2021 to 2033 (USD Million)
- 8.7.5. South Korea
- 8.7.5.1. Key country dynamics
- 8.7.5.2. Regulatory framework
- 8.7.5.3. Competitive scenario
- 8.7.5.4. South Korea market estimates and forecasts 2021 to 2033 (USD Million)
- 8.7.6. Singapore
- 8.7.6.1. Key country dynamics
- 8.7.6.2. Regulatory framework
- 8.7.6.3. Competitive scenario
- 8.7.6.4. Singapore market estimates and forecasts 2021 to 2033 (USD Million)
- 8.7.1. Japan
- 8.8. Latin America
- 8.8.1. Brazil
- 8.8.1.1. Key country dynamics
- 8.8.1.2. Regulatory framework
- 8.8.1.3. Competitive scenario
- 8.8.1.4. Brazil market estimates and forecasts 2021 to 2033 (USD Million)
- 8.8.2. Argentina
- 8.8.2.1. Key country dynamics
- 8.8.2.2. Regulatory framework
- 8.8.2.3. Competitive scenario
- 8.8.2.4. Argentina market estimates and forecasts 2021 to 2033 (USD Million)
- 8.8.1. Brazil
- 8.9. MEA
- 8.9.1. South Africa
- 8.9.1.1. Key country dynamics
- 8.9.1.2. Regulatory framework
- 8.9.1.3. Competitive scenario
- 8.9.1.4. South Africa market estimates and forecasts 2021 to 2033 (USD Million)
- 8.9.2. Saudi Arabia
- 8.9.2.1. Key country dynamics
- 8.9.2.2. Regulatory framework
- 8.9.2.3. Competitive scenario
- 8.9.2.4. Saudi Arabia market estimates and forecasts 2021 to 2033 (USD Million)
- 8.9.3. UAE
- 8.9.3.1. Key country dynamics
- 8.9.3.2. Regulatory framework
- 8.9.3.3. Competitive scenario
- 8.9.3.4. UAE market estimates and forecasts 2021 to 2033 (USD Million)
- 8.9.4. Kuwait
- 8.9.4.1. Key country dynamics
- 8.9.4.2. Regulatory framework
- 8.9.4.3. Competitive scenario
- 8.9.4.4. Kuwait market estimates and forecasts 2021 to 2033 (USD Million)
- 8.9.1. South Africa
Chapter 9. Competitive Landscape
- 9.1. Recent Developments & Impact Analysis, By Key Market Participants
- 9.2. Company/Competition Categorization
- 9.3. Company Market Position Analysis, 2025
- 9.4. Company Market Share Analysis, 2025
- 9.5. Company Profiles/Listing
- 9.5.1. McKesson Corporation
- 9.5.1.1. Company overview
- 9.5.1.2. Financial performance
- 9.5.1.3. Product benchmarking
- 9.5.1.4. Strategic initiatives
- 9.5.2. Oracle
- 9.5.2.1. Company overview
- 9.5.2.2. Financial performance
- 9.5.2.3. Product benchmarking
- 9.5.2.4. Strategic initiatives
- 9.5.3. Siemens Healthineers AG
- 9.5.3.1. Company overview
- 9.5.3.2. Financial performance
- 9.5.3.3. Product benchmarking
- 9.5.3.4. Strategic initiatives
- 9.5.4. Allscripts Healthcare, LLC
- 9.5.4.1. Company overview
- 9.5.4.2. Financial performance
- 9.5.4.3. Product benchmarking
- 9.5.4.4. Strategic initiatives
- 9.5.5. athenahealth, Inc.
- 9.5.5.1. Company overview
- 9.5.5.2. Financial performance
- 9.5.5.3. Product benchmarking
- 9.5.5.4. Strategic initiatives
- 9.5.6. NextGen Healthcare Inc.
- 9.5.6.1. Company overview
- 9.5.6.2. Financial performance
- 9.5.6.3. Product benchmarking
- 9.5.6.4. Strategic initiatives
- 9.5.7. Koninklijke Philips N.V.
- 9.5.7.1. Company overview
- 9.5.7.2. Financial performance
- 9.5.7.3. Product benchmarking
- 9.5.7.4. Strategic initiatives
- 9.5.8. IBM
- 9.5.8.1. Company overview
- 9.5.8.2. Financial performance
- 9.5.8.3. Product benchmarking
- 9.5.8.4. Strategic initiatives
- 9.5.9. Agfa-Gevaert Group
- 9.5.9.1. Company overview
- 9.5.9.2. Financial performance
- 9.5.9.3. Product benchmarking
- 9.5.9.4. Strategic initiatives
- 9.5.10. Wolters Kluwer N.V.
- 9.5.10.1. Company overview
- 9.5.10.2. Financial performance
- 9.5.10.3. Product benchmarking
- 9.5.10.4. Strategic initiatives
- 9.5.11. Becton, Dickinson and Company
- 9.5.11.1. Company overview
- 9.5.11.2. Financial performance
- 9.5.11.3. Product benchmarking
- 9.5.11.4. Strategic initiatives
- 9.5.12. Cabot Technology Solutions
- 9.5.12.1. Company overview
- 9.5.12.2. Financial performance
- 9.5.12.3. Product benchmarking
- 9.5.12.4. Strategic initiatives
- 9.5.13. GE HealthCare
- 9.5.13.1. Company overview
- 9.5.13.2. Financial performance
- 9.5.13.3. Product benchmarking
- 9.5.13.4. Strategic initiatives
- 9.5.14. Nordic
- 9.5.14.1. Company overview
- 9.5.14.2. Financial performance
- 9.5.14.3. Product benchmarking
- 9.5.14.4. Strategic initiatives
- 9.5.15. BeeKeeperAI
- 9.5.15.1. Company overview
- 9.5.15.2. Financial performance
- 9.5.15.3. Product benchmarking
- 9.5.15.4. Strategic initiatives
- 9.5.16. BSCO Industries, Inc.
- 9.5.16.1. Company overview
- 9.5.16.2. Financial performance
- 9.5.16.3. Product benchmarking
- 9.5.16.4. Strategic initiatives
- 9.5.17. Epic Systems Corporation
- 9.5.17.1. Company overview
- 9.5.17.2. Financial performance
- 9.5.17.3. Product benchmarking
- 9.5.17.4. Strategic initiatives
- 9.5.1. McKesson Corporation