|
시장보고서
상품코드
1678539
액티그래프 장치 시장 규모, 점유율, 동향 분석 : 용도별, 최종 용도별, 지역별, 부문별 예측(2025-2030년)Actigraphy Device Market Size, Share & Trends Analysis Report By Application (Sleep Disorders, Physical Activity Monitoring, Chronic Disease Management), By End Use, By Region, And Segment Forecasts, 2025 - 2030 |
||||||
액티그래프 장치 시장 성장과 동향:
Grand View Research, Inc.의 최신 보고서에 따르면, 액티그래프 장치 세계 시장 규모는 2025년부터 2030년까지 26.09%의 CAGR로 성장하여 2030년까지 106억 7,000만 달러에 달할 것으로 예상됩니다. 이 시장은 전 세계 수면장애 유병률 증가, 웨어러블 헬스케어 기술 도입 증가, 노인 인구 증가로 인해 크게 성장하고 있습니다. 2024년 2월 NIH가 발표한 논문에 따르면 불면증은 전 세계 성인 인구의 상당 부분이 불면증에 시달리고 있고, 성인의 30-35%가 불면증 증상을 호소하고 있으며, 노년층에서는 75%에 달합니다. 선진국에서는 성인 3명 중 1명이 적어도 매주 한 번 이상 잠들거나 잠을 유지하는 데 어려움을 겪고 있으며, 성인의 6-15%가 불면증으로 진단받고 있습니다.
고령화는 액티그래프 장치 산업의 확대에 기여하는 중요한 요인으로, 2023년 1월 유엔에 따르면 65세 이상 세계 인구는 2021년 7억 6,100만 명에서 2050년 16억 명에 육박할 것으로 예상됩니다. 노인들은 수면 장애를 겪기 쉽기 때문에 액티그래프 장치와 같은 첨단 수면 모니터링 솔루션에 대한 수요가 증가할 것입니다. 또한, 노인 인구의 증가와 함께 수면 관련 장애의 발생률도 증가하여 시장 수요를 더욱 증가시킬 것입니다.
웨어러블 기술의 발전도 시장 확대에 중요한 역할을 하고 있습니다. 피트니스 트래커, 스마트 워치 등 액티그래프와 다른 건강 지표를 결합한 기기는 편리함과 다기능성으로 인해 인기를 끌고 있습니다. 이러한 추세는 소비자 보급을 촉진할 뿐만 아니라 임상과 비임상 모두에서 액티그래프 기기의 적용 범위를 확장하고 있습니다.
소비자 시장에서의 수요 증가와 더불어 의료 서비스 제공자가 임상 목적으로 액티그래피를 채택하는 사례도 증가하고 있습니다. 수면 패턴에 대한 지속적이고 상세한 데이터를 제공하는 액티그래피의 능력은 다양한 수면 장애를 진단하고 관리하는 데 있어 중요한 도구가 되고 있습니다. 특히 원격의료 및 재택의료 솔루션의 확대로 인해 임상 현장에서의 사용은 더욱 확대될 것으로 예상됩니다.
액티그래프 장치 시장 보고서 하이라이트
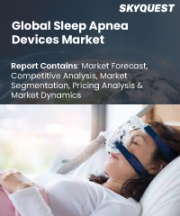
- 용도별로는 불면증, 수면무호흡증, 하지불안증후군, 수면무호흡증 등 수면장애의 유병률이 증가함에 따라 수면장애가 가장 큰 매출 비중을 차지하고 있습니다.
- 최종 용도별로는 의료 서비스 제공자가 환자 치료 및 진단에 있어 핵심적인 역할을 담당하며 가장 큰 매출 비중을 차지했습니다.
- 북미는 2024년 35.76%의 매출 점유율로 액티그래프 장치 산업을 지배했습니다. 이는 높은 수면장애 유병률, 고령화, 잘 구축된 의료 인프라 등의 복합적인 요인에 기인합니다.
목차
제1장 분석 방법·범위
제2장 주요 요약
제3장 액티그래프 장치 시장 : 변수, 동향, 범위
- 시장 연관 전망
- 부수 시장 전망
- 시장 역학
- 시장 성장 촉진요인 분석
- 시장 성장 억제요인 분석
- 액티그래프 장치 시장 : 분석 툴
- 업계 분석 : Porter's Five Forces 분석
- PESTEL 분석
제4장 액티그래프 장치 시장 : 용도별 추정·동향 분석
- 부문 대시보드
- 액티그래프 장치 시장 : 용도별 변동 분석
- 액티그래프 장치 시장 : 시장 규모 예측과 동향 분석, 용도별(2018-2030년)
- 수면장애
- 신체 활동 모니터링
- 만성질환 관리
제5장 액티그래프 장치 시장 : 최종 용도별 추정·동향 분석
- 부문 대시보드
- 액티그래프 장치 시장 : 최종 용도별 변동 분석
- 액티그래프 장치 시장 : 시장 규모 예측과 동향 분석, 최종 용도별(2018-2030년)
- 의료 제공자
- 연구기관
- 재택의료
- 피트니스·스포츠 센터
제6장 액티그래프 장치 시장 : 지역별 추정·동향 분석
- 지역별 대시보드
- 시장 규모 예측과 동향 분석(2018-2030년)
- 북미
- 미국
- 캐나다
- 멕시코
- 유럽
- 영국
- 독일
- 프랑스
- 이탈리아
- 스페인
- 덴마크
- 스웨덴
- 노르웨이
- 아시아태평양
- 일본
- 중국
- 인도
- 한국
- 호주
- 태국
- 라틴아메리카
- 브라질
- 아르헨티나
- 중동 및 아프리카
- 남아프리카공화국
- 사우디아라비아
- 아랍에미리트
- 쿠웨이트
제7장 경쟁 구도
- 시장 진출 기업 분류
- 주요 기업 개요
- ActiGraph, LLC.
- Fibion Inc.
- Koninklijke Philips NV
- CamNtech Ltd
- Empatica Inc.
- ActivInsights Ltd
- neurocare group AG
Actigraphy Device Market Growth & Trends:
The global actigraphy device market size is anticipated to reach USD 10.67 billion by 2030, growing at a CAGR of 26.09% from 2025 to 2030, according to a new report by Grand View Research, Inc. The market is experiencing significant growth due to the rising prevalence of sleep disorders worldwide, coupled with the increasing adoption of wearable health technologies and the growing geriatric population. According to an article published by the NIH in February 2024, insomnia affects a significant portion of the global adult population, with symptoms reported by 30-35% of adults, and a much higher rate of up to 75% among older adults. In developed countries, around one in three adults struggle with falling asleep or staying asleep at least weekly, and 6-15% of adults are diagnosed with insomnia disorder.
The aging population is a key factor contributing to the expansion of the actigraphy device industry. According to the United Nations in January 2023, the global population of individuals aged 65 years and above is expected to increase from 761 million in 2021 to nearly 1.6 billion by 2050. Older adults are more prone to sleep disturbances, which increases the demand for advanced sleep monitoring solutions like actigraphy devices. Furthermore, as the elderly population grows, so does the incidence of sleep-related disorders, further boosting market demand
Advancements in wearable technology are also playing a crucial role in the market's expansion. Devices that combine actigraphy with other health metrics, such as fitness trackers and smartwatches, have gained popularity due to their convenience and multifunctionality. This trend is not only enhancing consumer adoption but also increasing the range of applications for actigraphy devices in both clinical and non-clinical settings.
In addition to the growing demand in the consumer market, healthcare providers are increasingly adopting actigraphy devices for clinical purposes. Actigraphy's ability to provide continuous, detailed data on sleep patterns is making it an important tool in the diagnosis and management of various sleep disorders. The use of these devices in clinical settings is expected to grow, especially with the expansion of telemedicine and home healthcare solutions.
Actigraphy Device Market Report Highlights:
- Based on application, the sleep disorders dominated the industry with the largest revenue share owing to the rising prevalence of sleep disorders such as insomnia, sleep apnea, and restless legs syndrome.
- Based on end use, the healthcare providers dominated the industry with the largest revenue share owing to their central role in patient care and diagnosis.
- North America dominated the actigraphy device industry with a revenue share of 35.76% in 2024. This can be attributed to the combination of factors including the high prevalence of sleep disorders, an aging population, and well-established healthcare infrastructure.
Table of Contents
Chapter 1. Methodology and Scope
- 1.1. Market Segmentation and Scope
- 1.2. Research Methodology
- 1.3. Information Procurement
- 1.4. Information or Data Analysis
- 1.5. Market Formulation & Validation
- 1.6. Model Details
- 1.7. List of Data Sources
Chapter 2. Executive Summary
- 2.1. Market Outlook
- 2.2. Segment Outlook
- 2.3. Competitive Insights
Chapter 3. Actigraphy Device Market Variables, Trends, & Scope
- 3.1. Market Lineage Outlook
- 3.1.1. Ancillary Market Outlook
- 3.2. Market Dynamics
- 3.2.1. Market Driver Analysis
- 3.2.1.1. Growing Prevalence of Sleep Disorders
- 3.2.1.2. Rising Health Consciousness
- 3.2.1.3. Advancements in Wearable Technology
- 3.2.2. Market Restraint Analysis
- 3.2.2.1. High Cost of Actigraphy Device
- 3.2.2.2. Less accurate for people with limited mobility
- 3.2.1. Market Driver Analysis
- 3.3. Actigraphy Device Market Analysis Tools
- 3.3.1. Industry Analysis - Porter's Five Forces
- 3.3.1.1. Bargaining power of suppliers
- 3.3.1.2. Bargaining power of buyers
- 3.3.1.3. Threat of substitutes
- 3.3.1.4. Threat of new entrants
- 3.3.1.5. Competitive rivalry
- 3.3.2. PESTEL Analysis
- 3.3.2.1. Political & Legal Landscape
- 3.3.2.2. Economic and Social Landscape
- 3.3.2.3. Technological landscape
- 3.3.1. Industry Analysis - Porter's Five Forces
Chapter 4. Actigraphy Device Market: Application Estimates & Trend Analysis
- 4.1. Segment Dashboard
- 4.2. Actigraphy Device Market Application Movement Analysis
- 4.3. Actigraphy Device Market Size & Trend Analysis, by Application, 2018 to 2030 (USD Million)
- 4.4. Sleep Disorders
- 4.4.1. Sleep Disorders Market Revenue Estimates and Forecasts, 2018 - 2030 (USD Million)
- 4.5. Physical Activity Monitoring
- 4.5.1. Physical Activity Monitoring Market Revenue Estimates and Forecasts, 2018 - 2030 (USD Million)
- 4.6. Chronic Disease Management
- 4.6.1. Chronic Disease Management Market Revenue Estimates and Forecasts, 2018 - 2030 (USD Million)
Chapter 5. Actigraphy Device Market: End Use Estimates & Trend Analysis
- 5.1. Segment Dashboard
- 5.2. Actigraphy Device Market End Use Movement Analysis
- 5.3. Actigraphy Device Market Size & Trend Analysis, by End Use, 2018 to 2030 (USD Million)
- 5.4. Healthcare Providers
- 5.4.1. Healthcare Providers Market Revenue Estimates and Forecasts, 2018 - 2030 (USD Million)
- 5.5. Research Institutions
- 5.5.1. Research Institutions Market Revenue Estimates and Forecasts, 2018 - 2030 (USD Million)
- 5.6. Homecare Settings
- 5.6.1. Homecare Settings Market Revenue Estimates and Forecasts, 2018 - 2030 (USD Million)
- 5.7. Fitness and Sports Centers
- 5.7.1. Fitness and Sports Centers Market Revenue Estimates and Forecasts, 2018 - 2030 (USD Million)
Chapter 6. Actigraphy Device Market: Regional Estimates & Trend Analysis By Type, By End Use
- 6.1. Regional Dashboard
- 6.2. Market Size & Forecasts and Trend Analysis, 2018 to 2030
- 6.3. North America
- 6.3.1. North America Actigraphy Device Market Estimates and Forecasts, 2018 - 2030 (USD Million)
- 6.3.2. U.S.
- 6.3.2.1. Key Country Dynamics
- 6.3.2.2. Competitive Scenario
- 6.3.2.3. Regulatory Scenario
- 6.3.2.4. Reimbursement Scenario
- 6.3.2.5. U.S. Actigraphy Device Market Estimates and Forecasts, 2018 - 2030 (USD Million)
- 6.3.3. Canada
- 6.3.3.1. Key Country Dynamics
- 6.3.3.2. Competitive Scenario
- 6.3.3.3. Regulatory Scenario
- 6.3.3.4. Reimbursement Scenario
- 6.3.3.5. Canada Actigraphy Device Market Estimates and Forecasts, 2018 - 2030 (USD Million)
- 6.3.4. Mexico
- 6.3.4.1. Key Country Dynamics
- 6.3.4.2. Competitive Scenario
- 6.3.4.3. Regulatory Scenario
- 6.3.4.4. Reimbursement Scenario
- 6.3.4.5. Mexico Actigraphy Device Market Estimates and Forecasts, 2018 - 2030 (USD Million)
- 6.4. Europe
- 6.4.1. Europe Actigraphy Device Market Estimates and Forecasts, 2018 - 2030 (USD Million)
- 6.4.2. UK
- 6.4.2.1. Key Country Dynamics
- 6.4.2.2. Competitive Scenario
- 6.4.2.3. Regulatory Scenario
- 6.4.2.4. Reimbursement Scenario
- 6.4.2.5. UK Actigraphy Device Market Estimates and Forecasts, 2018 - 2030 (USD Million)
- 6.4.3. Germany
- 6.4.3.1. Key Country Dynamics
- 6.4.3.2. Competitive Scenario
- 6.4.3.3. Regulatory Scenario
- 6.4.3.4. Reimbursement Scenario
- 6.4.3.5. Germany Actigraphy Device Market Estimates and Forecasts, 2018 - 2030 (USD Million)
- 6.4.4. France
- 6.4.4.1. Key Country Dynamics
- 6.4.4.2. Competitive Scenario
- 6.4.4.3. Regulatory Scenario
- 6.4.4.4. Reimbursement Scenario
- 6.4.4.5. France Actigraphy Device Market Estimates and Forecasts, 2018 - 2030 (USD Million)
- 6.4.5. Italy
- 6.4.5.1. Key Country Dynamics
- 6.4.5.2. Competitive Scenario
- 6.4.5.3. Regulatory Scenario
- 6.4.5.4. Reimbursement Scenario
- 6.4.5.5. Italy Actigraphy Device Market Estimates and Forecasts, 2018 - 2030 (USD Million)
- 6.4.6. Spain
- 6.4.6.1. Key Country Dynamics
- 6.4.6.2. Competitive Scenario
- 6.4.6.3. Regulatory Scenario
- 6.4.6.4. Reimbursement Scenario
- 6.4.6.5. Spain Actigraphy Device Market Estimates and Forecasts, 2018 - 2030 (USD Million)
- 6.4.7. Denmark
- 6.4.7.1. Key Country Dynamics
- 6.4.7.2. Competitive Scenario
- 6.4.7.3. Regulatory Scenario
- 6.4.7.4. Reimbursement Scenario
- 6.4.7.5. Denmark Actigraphy Device Market Estimates and Forecasts, 2018 - 2030 (USD Million)
- 6.4.8. Sweden
- 6.4.8.1. Key Country Dynamics
- 6.4.8.2. Competitive Scenario
- 6.4.8.3. Regulatory Scenario
- 6.4.8.4. Reimbursement Scenario
- 6.4.8.5. Sweden Actigraphy Device Market Estimates and Forecasts, 2018 - 2030 (USD Million)
- 6.4.9. Norway
- 6.4.9.1. Key Country Dynamics
- 6.4.9.2. Competitive Scenario
- 6.4.9.3. Regulatory Scenario
- 6.4.9.4. Reimbursement Scenario
- 6.4.9.5. Norway Actigraphy Device Market Estimates and Forecasts, 2018 - 2030 (USD Million)
- 6.5. Asia Pacific
- 6.5.1. Asia Pacific Actigraphy Device Market Estimates and Forecasts, 2018 - 2030 (USD Million)
- 6.5.2. Japan
- 6.5.2.1. Key Country Dynamics
- 6.5.2.2. Competitive Scenario
- 6.5.2.3. Regulatory Scenario
- 6.5.2.4. Reimbursement Scenario
- 6.5.2.5. Japan Actigraphy Device Market Estimates and Forecasts, 2018 - 2030 (USD Million)
- 6.5.3. China
- 6.5.3.1. Key Country Dynamics
- 6.5.3.2. Competitive Scenario
- 6.5.3.3. Regulatory Scenario
- 6.5.3.4. Reimbursement Scenario
- 6.5.3.5. China Actigraphy Device Market Estimates and Forecasts, 2018 - 2030 (USD Million)
- 6.5.4. India
- 6.5.4.1. Key Country Dynamics
- 6.5.4.2. Competitive Scenario
- 6.5.4.3. Regulatory Scenario
- 6.5.4.4. Reimbursement Scenario
- 6.5.4.5. India Actigraphy Device Market Estimates and Forecasts, 2018 - 2030 (USD Million)
- 6.5.5. South Korea
- 6.5.5.1. Key Country Dynamics
- 6.5.5.2. Competitive Scenario
- 6.5.5.3. Regulatory Scenario
- 6.5.5.4. Reimbursement Scenario
- 6.5.5.5. South Korea Actigraphy Device Market Estimates and Forecasts, 2018 - 2030 (USD Million)
- 6.5.6. Australia
- 6.5.6.1. Key Country Dynamics
- 6.5.6.2. Competitive Scenario
- 6.5.6.3. Regulatory Scenario
- 6.5.6.4. Reimbursement Scenario
- 6.5.6.5. Australia Actigraphy Device Market Estimates and Forecasts, 2018 - 2030 (USD Million)
- 6.5.7. Thailand
- 6.5.7.1. Key Country Dynamics
- 6.5.7.2. Competitive Scenario
- 6.5.7.3. Regulatory Scenario
- 6.5.7.4. Reimbursement Scenario
- 6.5.7.5. Thailand Actigraphy Device Market Estimates and Forecasts, 2018 - 2030 (USD Million)
- 6.6. Latin America
- 6.6.1. Latin America Actigraphy Device Market Estimates and Forecasts, 2018 - 2030 (USD Million)
- 6.6.2. Brazil
- 6.6.2.1. Key Country Dynamics
- 6.6.2.2. Competitive Scenario
- 6.6.2.3. Regulatory Scenario
- 6.6.2.4. Reimbursement Scenario
- 6.6.2.5. Brazil Actigraphy Device Market Estimates and Forecasts, 2018 - 2030 (USD Million)
- 6.6.3. Argentina
- 6.6.3.1. Key Country Dynamics
- 6.6.3.2. Competitive Scenario
- 6.6.3.3. Regulatory Scenario
- 6.6.3.4. Reimbursement Scenario
- 6.6.3.5. Argentina Actigraphy Device Market Estimates and Forecasts, 2018 - 2030 (USD Million)
- 6.7. Middle East & Africa
- 6.7.1. Middle East & Africa Actigraphy Device Market Estimates and Forecasts, 2018 - 2030 (USD Million)
- 6.7.2. South Africa
- 6.7.2.1. Key Country Dynamics
- 6.7.2.2. Competitive Scenario
- 6.7.2.3. Regulatory Scenario
- 6.7.2.4. Reimbursement Scenario
- 6.7.2.5. South Africa Actigraphy Device Market Estimates and Forecasts, 2018 - 2030 (USD Million)
- 6.7.3. Saudi Arabia
- 6.7.3.1. Key Country Dynamics
- 6.7.3.2. Competitive Scenario
- 6.7.3.3. Regulatory Scenario
- 6.7.3.4. Reimbursement Scenario
- 6.7.3.5. Saudi Arabia Actigraphy Device Market Estimates and Forecasts, 2018 - 2030 (USD Million)
- 6.7.4. UAE
- 6.7.4.1. Key Country Dynamics
- 6.7.4.2. Competitive Scenario
- 6.7.4.3. Regulatory Scenario
- 6.7.4.4. Reimbursement Scenario
- 6.7.4.5. UAE Actigraphy Device Market Estimates and Forecasts, 2018 - 2030 (USD Million)
- 6.7.5. Kuwait
- 6.7.5.1. Key Country Dynamics
- 6.7.5.2. Competitive Scenario
- 6.7.5.3. Regulatory Scenario
- 6.7.5.4. Reimbursement Scenario
- 6.7.5.5. Kuwait Actigraphy Device Market Estimates and Forecasts, 2018 - 2030 (USD Million)
Chapter 7. Competitive Landscape
- 7.1. Market Participant Categorization
- 7.2. Key Company Profiles
- 7.2.1. ActiGraph, LLC.
- 7.2.1.1. Company Overview
- 7.2.1.2. Financial Performance
- 7.2.1.3. Service Benchmarking
- 7.2.1.4. Strategic Initiatives
- 7.2.2. Fibion Inc.
- 7.2.2.1. Company Overview
- 7.2.2.2. Financial Performance
- 7.2.2.3. Service Benchmarking
- 7.2.2.4. Strategic Initiatives
- 7.2.3. Koninklijke Philips N.V.
- 7.2.3.1. Company Overview
- 7.2.3.2. Financial Performance
- 7.2.3.3. Service Benchmarking
- 7.2.3.4. Strategic Initiatives
- 7.2.4. CamNtech Ltd
- 7.2.4.1. Company Overview
- 7.2.4.2. Financial Performance
- 7.2.4.3. Service Benchmarking
- 7.2.4.4. Strategic Initiatives
- 7.2.5. Empatica Inc.
- 7.2.5.1. Company Overview
- 7.2.5.2. Financial Performance
- 7.2.5.3. Service Benchmarking
- 7.2.5.4. Strategic Initiatives
- 7.2.6. ActivInsights Ltd
- 7.2.6.1. Company Overview
- 7.2.6.2. Financial Performance
- 7.2.6.3. Service Benchmarking
- 7.2.6.4. Strategic Initiatives
- 7.2.7. neurocare group AG
- 7.2.7.1. Company Overview
- 7.2.7.2. Financial Performance
- 7.2.7.3. Service Benchmarking
- 7.2.7.4. Strategic Initiatives
- 7.2.1. ActiGraph, LLC.