|
시장보고서
상품코드
1772343
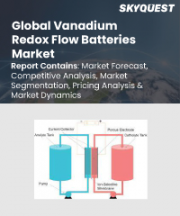
플로우 배터리 시장 - 규모, 점유율, 동향 분석 보고서 : 유형별, 재료별, 축전지별, 용도별, 지역별, 부문 예측(2025-2030년)Flow Battery Market Size, Share & Trends Analysis Report By Type (Redox, Hybrid), By Material (Vanadium, Zinc Bromine), By Storage (Large-scale, Small-scale), By Application, By Region, And Segment Forecasts, 2025 - 2030 |
||||||
세계의 플로우 배터리 시장 성장과 동향
Grand View Research, Inc.의 최신 보고서에 따르면 세계의 플로우 배터리 시장 규모는 2030년까지 16억 7,554만 달러에 달할 것으로 예측되고 있습니다. 플로우 배터리는 확장성이 높기 때문에 주거용 및 산업용 에너지 저장부터 유틸리티 규모의 프로젝트에 이르기까지 다양한 용도에 적합합니다.
신재생 에너지 저장은 플로우 배터리의 주요 용도를 구성하고 있습니다. 국제 에너지 기관(IEA)에 따르면, 2023년 에너지 부문에 대한 세계 투자액은 약 2조 8,000억 달러로 예측되고 있으며, 이 중 1조 7,000억 달러 이상이 재생가능 에너지, 전기자동차(EV), 원자력, 그리드 인프라, 에너지 저장, 저배출 연료, 에너지 효율 향상, 히트펌프 시스템 등의 클린 기술로 향할 것으로 예상되고 있습니다.
플로우 배터리 시장 보고서 하이라이트
- 산화환원 부문이 2024년에 85.6%의 최대 수익 점유율로 시장을 독점했습니다.
- 바나듐 부문은 견고한 성능, 화학적 신뢰성, 시스템 효율성에 힘입어 2024년 가장 큰 수익 점유율을 차지했습니다.
- 2024년 최대 매출 점유율을 차지한 것은 대규모 부문였습니다.
- 그리드/유틸리티 부문은 2024년 가장 큰 시장 점유율을 차지했습니다.
- 아시아태평양의 플로우 배터리 시장은 2024년에 47.7%의 최대 수익 점유율로 시장을 독점했으며, 이것은 중국, 호주, 일본 등의 주요 경제국에서의 플로우 배터리의 높은 채용에 기인합니다.
목차
제1장 조사 방법과 범위
제2장 주요 요약
제3장 플로우 배터리 시장의 변수, 동향, 범위
- 시장 계통의 전망
- 모 시장 전망
- 관련 시장 전망
- 산업 밸류체인 분석
- 규제 프레임워크
- 시장 역학
- 시장 성장 촉진요인 분석
- 시장 성장 억제요인 분석
- 산업의 과제
- 산업의 기회
- 산업 분석도구
- Porter's Five Forces 분석
- 거시적 환경 분석
제4장 플로우 배터리 시장 : 유형별, 추정 및 동향 분석
- 유형 부문 대시보드
- 플로우 배터리 시장 : 유형 변동 분석과 시장 점유율, 2024년 및 2030년
- 산화환원
- 하이브리드
제5장 플로우 배터리 시장 : 재료별, 추정 및 동향 분석
- 재료 부문 대시보드
- 플로우 배터리 시장 : 재료 변동 분석과 시장 점유율, 2024년 및 2030년
- 바나듐
- 아연 브롬
- 철
- 기타
제6장 플로우 배터리 시장 : 저장별, 추정 및 동향 분석
- 저장 부문 대시보드
- 플로우 배터리 시장 : 저장 변동 분석과 시장 점유율, 2024년 및 2030년
- 대규모
- 소규모
제7장 플로우 배터리 시장 : 용도별, 추정 및 동향 분석
- 용도 부문 대시보드
- 플로우 배터리 시장 : 용도 변동 분석과 시장 점유율, 2024년 및 2030년
- 그리드 및 유틸리티
- 상업 및 공업
- EV 충전소
- 주택용
제8장 플로우 배터리 시장 : 지역별, 추정 및 동향 분석
- 지역변동 분석과 시장 점유율, 2024년 및 2030년
- 북미
- 미국
- 캐나다
- 멕시코
- 유럽
- 영국
- 독일
- 프랑스
- 이탈리아
- 스페인
- 노르웨이
- 네덜란드
- 아시아태평양
- 중국
- 일본
- 인도
- 호주
- 태국
- 한국
- 인도네시아
- 말레이시아
- 라틴아메리카
- 브라질
- 아르헨티나
- 중동 및 아프리카
- 사우디아라비아
- 남아프리카
- 아랍에미리트(UAE)
제1장 플로우 배터리 시장-경쟁 구도
- 주요 시장 진출기업에 의한 최근의 동향과 영향 분석
- 기업 분류
- 기업 히트맵
- 포지션 분석, 2024년
- 전략 매핑
- 확대
- 합병과 인수
- 파트너십 및 협업
- 신제품 발매
- 연구개발
- 기업 프로파일
- ESS Tech, Inc.
- Redox One
- WattJoule Corporation
- Invinity Energy Systems
- Largo Inc.
- Primus Power
- Sumitomo Electric Industries, Ltd.
- CellCube Energy Storage GmbH
- Redflow Ltd.
- VRB ENERGY
- Elestor
- Jena Flow Batteries GmbH
- Lockheed Martin Corporation
- EverFlow
- Stryten Energy
- ViZn Energy Systems
Flow Battery Market Growth & Trends:
The global flow battery market size is anticipated to reach USD 1,675.54 million by 2030, according to a new report by Grand View Research, Inc. It is projected to grow at a CAGR of 22.8% from 2025 to 2030. Advantages of flow batteries, such as scalability, over conventional batteries are expected to drive the market growth during the forecast period. Flow batteries are highly scalable, making them suitable for a variety of applications, from residential and industrial energy storage to utility-scale projects. This scalability allows them to be customized to match the specific energy storage needs of different users and applications. Increasing investments in renewable energy are one of the primary factors driving the market growth.
Renewable energy storage constitutes a major application of flow batteries. Many countries, including the U.S., China, India, Australia, and Japan, are actively revising their energy policies to adopt a substantial share of energy generation from renewable resources, such as wind and solar. As per the International Energy Agency (IEA), there is a projected global investment of approximately USD 2.8 trillion in the energy sector for the year 2023. Out of this total, over USD 1.7 trillion is anticipated to be directed toward clean technologies, such as renewables, electric vehicles (EVs), nuclear power, grid infrastructure, energy storage, low-emission fuels, enhancements in energy efficiency, and heat pump systems.
Flow Battery Market Report Highlights:
- The redox segment dominated the market with the largest revenue share of 85.6% in 2024.
- The vanadium segment held the largest revenue share in 2024, propelled by its robust performance, chemical reliability, and system efficiency.
- The large-scale segment accounted for the largest revenue share in 2024. This can be attributed to the scalability of large-scale batteries over their smaller counterparts.
- The grid/utility segment held the largest market share in 2024. This dominance can be attributed to various factors, including the flow battery's pivotal role in grid integration, supporting grid resilience, reducing energy transmission expenses, realizing environmental advantages, and offering remarkable scalability.
- Asia Pacific flow battery market dominated the market with the largest revenue share of 47.7% in 2024, attributed to the high adoption of flow batteries in major economies such as China, Australia, and Japan.
Table of Contents
Chapter 1. Methodology and Scope
- 1.1. Market Segmentation & Scope
- 1.2. Market Definition
- 1.3. Information Procurement
- 1.3.1. Purchased Database
- 1.3.2. GVR's Internal Database
- 1.3.3. Secondary Sources & Third-Party Perspectives
- 1.3.4. Primary Research
- 1.4. Information Analysis
- 1.4.1. Data Analysis Models
- 1.5. Market Formulation & Data Visualization
- 1.6. Data Validation & Publishing
Chapter 2. Executive Summary
- 2.1. Market Snapshot
- 2.2. Segment Snapshot
- 2.3. Competitive Landscape Snapshot
Chapter 3. Flow Battery Market Variables, Trends & Scope
- 3.1. Market Lineage Outlook
- 3.1.1. Parent Market Outlook
- 3.1.2. Related Market Outlook
- 3.2. Industry Value Chain Analysis
- 3.3. Regulatory Framework
- 3.4. Market Dynamics
- 3.4.1. Market Driver Analysis
- 3.4.2. Market Restraint Analysis
- 3.4.3. Industry Challenges
- 3.4.4. Industry Opportunities
- 3.5. Industry Analysis Tools
- 3.5.1. Porter's Five Forces Analysis
- 3.5.2. Macro-environmental Analysis
Chapter 4. Flow Battery Market: Type Estimates & Trend Analysis
- 4.1. Type Segment Dashboard
- 4.2. Flow Battery Market: Type Movement Analysis & Market Share, 2024 & 2030
- 4.3. Redox
- 4.3.1. Redox Market Revenue Estimates and Forecasts, 2018 - 2030 (USD Million) (KWh)
- 4.4. Hybrid
- 4.4.1. Hybrid Market Revenue Estimates and Forecasts, 2018 - 2030 (USD Million) (KWh)
Chapter 5. Flow Battery Market: Material Estimates & Trend Analysis
- 5.1. Material Segment Dashboard
- 5.2. Flow Battery Market: Material Movement Analysis & Market Share, 2024 & 2030
- 5.3. Vanadium
- 5.3.1. Vanadium Market Revenue Estimates and Forecasts, 2018 - 2030 (USD Million) (KWh)
- 5.4. Zinc Bromine
- 5.4.1. Zinc Bromine Market Revenue Estimates and Forecasts, 2018 - 2030 (USD Million) (KWh)
- 5.5. Iron
- 5.5.1. Iron Market Revenue Estimates and Forecasts, 2018 - 2030 (USD Million) (KWh)
- 5.6. Others
- 5.6.1. Iron Market Revenue Estimates and Forecasts, 2018 - 2030 (USD Million) (KWh)
Chapter 6. Flow Battery Market: Storage Estimates & Trend Analysis
- 6.1. Storage Segment Dashboard
- 6.2. Flow Battery Market: Storage Movement Analysis & Market Share, 2024 & 2030
- 6.3. Large-scale
- 6.3.1. Large-scale Market Revenue Estimates and Forecasts, 2018 - 2030 (USD Million) (KWh)
- 6.4. Small-scale
- 6.4.1. Small-scale Market Revenue Estimates and Forecasts, 2018 - 2030 (USD Million) (KWh)
Chapter 7. Flow Battery Market: Application Estimates & Trend Analysis
- 7.1. Application Segment Dashboard
- 7.2. Flow Battery Market: Application Movement Analysis & Market Share, 2024 & 2030
- 7.3. Grid/utility
- 7.3.1. Grid/utility Market Revenue Estimates and Forecasts, 2018 - 2030 (USD Million) (KWh)
- 7.4. Commercial & Industrial
- 7.4.1. Commercial & Industrial Market Revenue Estimates and Forecasts, 2018 - 2030 (USD Million) (KWh)
- 7.5. EV Charging Stations
- 7.5.1. EV Charging Stations Market Revenue Estimates and Forecasts, 2018 - 2030 (USD Million) (KWh)
- 7.6. Residential
- 7.6.1. Residential Market Revenue Estimates and Forecasts, 2018 - 2030 (USD Million) (KWh)
Chapter 8. Flow Battery Market: Regional Estimates & Trend Analysis
- 8.1. Regional Movement Analysis & Market Share, 2024 & 2030
- 8.2. North America
- 8.2.1. North America Flow Battery Market Estimates & Forecasts, 2018 - 2030 (USD Million) (KWh)
- 8.2.2. U.S.
- 8.2.2.1. Key Country Dynamics
- 8.2.2.2. U.S. Flow Battery Market Estimates & Forecasts, 2018 - 2030 (USD Million) (KWh)
- 8.2.3. Canada
- 8.2.3.1. Key Country Dynamics
- 8.2.3.2. Canada Flow Battery Market Estimates & Forecasts, 2018 - 2030 (USD Million) (KWh)
- 8.2.4. Mexico
- 8.2.4.1. Key Country Dynamics
- 8.2.4.2. Mexico Flow Battery Market Estimates & Forecasts, 2018 - 2030 (USD Million) (KWh)
- 8.3. Europe
- 8.3.1. Europe Flow Battery Market Estimates & Forecasts, 2018 - 2030 (USD Million) (KWh)
- 8.3.2. U.K.
- 8.3.2.1. Key Country Dynamics
- 8.3.2.2. U.K. Flow Battery Market Estimates & Forecasts, 2018 - 2030 (USD Million) (KWh)
- 8.3.3. Germany
- 8.3.3.1. Key Country Dynamics
- 8.3.3.2. Germany Flow Battery Market Estimates & Forecasts, 2018 - 2030 (USD Million) (KWh)
- 8.3.4. France
- 8.3.4.1. Key Country Dynamics
- 8.3.4.2. France Flow Battery Market Estimates & Forecasts, 2018 - 2030 (USD Million) (KWh)
- 8.3.5. Italy
- 8.3.5.1. Key Country Dynamics
- 8.3.5.2. Italy Flow Battery Market Estimates & Forecasts, 2018 - 2030 (USD Million) (KWh)
- 8.3.6. Spain
- 8.3.6.1. Key Country Dynamics
- 8.3.6.2. Spain Flow Battery Market Estimates & Forecasts, 2018 - 2030 (USD Million) (KWh)
- 8.3.7. Norway
- 8.3.7.1. Key Country Dynamics
- 8.3.7.2. Norway Flow Battery Market Estimates & Forecasts, 2018 - 2030 (USD Million) (KWh)
- 8.3.8. The Netherlands
- 8.3.8.1. Key Country Dynamics
- 8.3.8.2. The Netherlands Flow Battery Market Estimates & Forecasts, 2018 - 2030 (USD Million) (KWh)
- 8.4. Asia Pacific
- 8.4.1. Asia Pacific Flow Battery Market Estimates & Forecasts, 2018 - 2030 (USD Million) (KWh)
- 8.4.2. China
- 8.4.2.1. Key Country Dynamics
- 8.4.2.2. China Flow Battery Market Estimates & Forecasts, 2018 - 2030 (USD Million) (KWh)
- 8.4.3. Japan
- 8.4.3.1. Key Country Dynamics
- 8.4.3.2. Japan Flow Battery Market Estimates & Forecasts, 2018 - 2030 (USD Million) (KWh)
- 8.4.4. India
- 8.4.4.1. Key Country Dynamics
- 8.4.4.2. India Flow Battery Market Estimates & Forecasts, 2018 - 2030 (USD Million) (KWh)
- 8.4.5. Australia
- 8.4.5.1. Key Country Dynamics
- 8.4.5.2. Australia Flow Battery Market Estimates & Forecasts, 2018 - 2030 (USD Million) (KWh)
- 8.4.6. Thailand
- 8.4.6.1. Key Country Dynamics
- 8.4.6.2. Thailand Flow Battery Market Estimates & Forecasts, 2018 - 2030 (USD Million) (KWh)
- 8.4.7. South Korea
- 8.4.7.1. Key Country Dynamics
- 8.4.7.2. South Korea Flow Battery Market Estimates & Forecasts, 2018 - 2030 (USD Million) (KWh)
- 8.4.8. Indonesia
- 8.4.8.1. Key Country Dynamics
- 8.4.8.2. Indonesia Flow Battery Market Estimates & Forecasts, 2018 - 2030 (USD Million) (KWh)
- 8.4.9. Malaysia
- 8.4.9.1. Key Country Dynamics
- 8.4.9.2. Malaysia Flow Battery Market Estimates & Forecasts, 2018 - 2030 (USD Million) (KWh)
- 8.5. Latin America
- 8.5.1. Latin America Flow Battery Market Estimates & Forecasts, 2018 - 2030 (USD Million) (KWh)
- 8.5.2. Brazil
- 8.5.2.1. Key Country Dynamics
- 8.5.2.2. Brazil Flow Battery Market Estimates & Forecasts, 2018 - 2030 (USD Million) (KWh)
- 8.5.3. Argentina
- 8.5.3.1. Key Country Dynamics
- 8.5.3.2. Argentina Flow Battery Market Estimates & Forecasts, 2018 - 2030 (USD Million) (KWh)
- 8.6. Middle East & Africa
- 8.6.1. Middle East & Africa Flow Battery Market Estimates & Forecasts, 2018 - 2030 (USD Million) (KWh)
- 8.6.2. Saudi Arabia
- 8.6.2.1. Key Country Dynamics
- 8.6.2.2. Saudi Arabia Flow Battery Market Estimates & Forecasts, 2018 - 2030 (USD Million) (KWh)
- 8.6.3. South Africa
- 8.6.3.1. Key Country Dynamics
- 8.6.3.2. South Africa Flow Battery Market Estimates & Forecasts, 2018 - 2030 (USD Million) (KWh)
- 8.6.4. UAE
- 8.6.4.1. Key Country Dynamics
- 8.6.4.2. UAE Flow Battery Market Estimates & Forecasts, 2018 - 2030 (USD Million) (KWh)
Chapter 1. Flow Battery Market - Competitive Landscape
- 1.1. Recent Developments & Impact Analysis, By Key Market Participants
- 1.2. Company Categorization
- 1.3. Company Heat Map
- 1.4. Position Analysis, 2024
- 1.5. Strategy Mapping
- 1.5.1. Expansion
- 1.5.2. Mergers & Acquisition
- 1.5.3. Partnerships & Collaborations
- 1.5.4. New Product Launches
- 1.5.5. Research and Development
- 1.6. Company Profiles
- 1.6.1. ESS Tech, Inc.
- 1.6.1.1. Participant's Overview
- 1.6.1.2. Financial Performance
- 1.6.1.3. Product Benchmarking
- 1.6.1.4. Recent Developments
- 1.6.2. Redox One
- 1.6.2.1. Participant's Overview
- 1.6.2.2. Financial Performance
- 1.6.2.3. Product Benchmarking
- 1.6.2.4. Recent Developments
- 1.6.3. WattJoule Corporation
- 1.6.3.1. Participant's Overview
- 1.6.3.2. Financial Performance
- 1.6.3.3. Product Benchmarking
- 1.6.3.4. Recent Developments
- 1.6.4. Invinity Energy Systems
- 1.6.4.1. Participant's Overview
- 1.6.4.2. Financial Performance
- 1.6.4.3. Product Benchmarking
- 1.6.4.4. Recent Developments
- 1.6.5. Largo Inc.
- 1.6.5.1. Participant's Overview
- 1.6.5.2. Financial Performance
- 1.6.5.3. Product Benchmarking
- 1.6.5.4. Recent Developments
- 1.6.6. Primus Power
- 1.6.6.1. Participant's Overview
- 1.6.6.2. Financial Performance
- 1.6.6.3. Product Benchmarking
- 1.6.6.4. Recent Developments
- 1.6.7. Sumitomo Electric Industries, Ltd.
- 1.6.7.1. Participant's Overview
- 1.6.7.2. Financial Performance
- 1.6.7.3. Product Benchmarking
- 1.6.7.4. Recent Developments
- 1.6.8. CellCube Energy Storage GmbH
- 1.6.8.1. Participant's Overview
- 1.6.8.2. Financial Performance
- 1.6.8.3. Product Benchmarking
- 1.6.8.4. Recent Developments
- 1.6.9. Redflow Ltd.
- 1.6.9.1. Participant's Overview
- 1.6.9.2. Financial Performance
- 1.6.9.3. Product Benchmarking
- 1.6.9.4. Recent Developments
- 1.6.10. VRB ENERGY
- 1.6.10.1. Participant's Overview
- 1.6.10.2. Financial Performance
- 1.6.10.3. Product Benchmarking
- 1.6.10.4. Recent Developments
- 1.6.11. Elestor
- 1.6.11.1. Participant's Overview
- 1.6.11.2. Financial Performance
- 1.6.11.3. Product Benchmarking
- 1.6.11.4. Recent Developments
- 1.6.12. Jena Flow Batteries GmbH
- 1.6.12.1. Participant's Overview
- 1.6.12.2. Financial Performance
- 1.6.12.3. Product Benchmarking
- 1.6.12.4. Recent Developments
- 1.6.13. Lockheed Martin Corporation
- 1.6.13.1. Participant's Overview
- 1.6.13.2. Financial Performance
- 1.6.13.3. Product Benchmarking
- 1.6.13.4. Recent Developments
- 1.6.14. EverFlow
- 1.6.14.1. Participant's Overview
- 1.6.14.2. Financial Performance
- 1.6.14.3. Product Benchmarking
- 1.6.14.4. Recent Developments
- 1.6.15. Stryten Energy
- 1.6.15.1. Participant's Overview
- 1.6.15.2. Financial Performance
- 1.6.15.3. Product Benchmarking
- 1.6.15.4. Recent Developments
- 1.6.16. ViZn Energy Systems
- 1.6.16.1. Participant's Overview
- 1.6.16.2. Financial Performance
- 1.6.16.3. Product Benchmarking
- 1.6.16.4. Recent Developments
- 1.6.1. ESS Tech, Inc.