|
시장보고서
상품코드
1908256
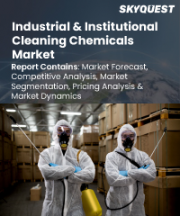
산업용 및 시설용 세정제 시장 규모, 점유율, 동향 분석 보고서 : 원료별, 제품별, 최종 용도별, 지역별, 부문별 예측(2026-2033년)Industrial And Institutional Cleaning Chemicals Market Size, Share & Trends Analysis Report By Raw Material, By Product, By End-use, By Region, And Segment Forecasts, 2026 - 2033 |
||||||
산업용 및 시설용 세정제 시장 개요
세계의 산업용 및 시설용 세정제 시장 규모는 2025년에 864억 6,000만 달러로 추정되며, 2033년에 1,569억 9,000만 달러에 달할 것으로 예측됩니다.
2026-2033년에는 CAGR 8.0%로 성장할 것으로 예상됩니다. 시장 성장은 위생 기준의 향상, 엄격한 건강 및 안전 규정, 의료 식품 서비스 부문의 수요 증가, 지속가능한 세척 솔루션에 대한 인식 증가, 전 세계적으로 효과적이고 환경 친화적이며 전문적인 세척 화학제품 배합을 가능하게 하는 기술 발전으로 인해 주도되고 있습니다.
팬데믹 이후 위생과 안전에 대한 관심이 높아지면서 산업용 및 시설용 세정제의 세계 소비가 크게 증가했습니다. 의료 및 식품 가공과 같은 부문에서 엄격한 건강 규제로 인해 효과적인 세정제, 소독제 및 살균제에 대한 수요가 더욱 증가하고 있습니다. 미국과 같은 국가에서는 대규모 산업 기반과 공공 공간의 광범위한 유지 관리가 시장의 지속적인 성장에 기여하고 있습니다. 제조업체들은 첨단적이고 효율적인 세척 솔루션으로 제품 포트폴리오를 다양화하기 위해 연구개발을 우선순위로 두고 있습니다.
소비자들이 탄소발자국을 줄이기 위해 노력하는 가운데, 지속가능하고 친환경적인 세정 제품은 큰 잠재력을 가지고 있습니다. 특히 미국 등 선진 시장에서는 식물 유래, 무독성, 생분해성 화학제품에 대한 수요가 증가하고 있으며, 이는 제조업체에게 수익성 높은 기회를 제공하고 있습니다. 녹색 혁신과 투명성 표시에 투자하는 기업은 지속가능성 목표를 지원하면서 시장에서의 입지를 강화할 수 있습니다.
견조한 성장에도 불구하고, 시장은 지속가능한 세정 솔루션의 높은 개발 비용과 새로운 화학 성분에 필요한 복잡한 규제 승인과 같은 도전에 직면해 있습니다. 강력한 화학 세정제의 과도한 사용과 오용은 환경적 위험을 초래할 수 있으며, 제조업체는 성능 표준을 손상시키지 않고 효과와 안전 및 지속가능성의 균형을 유지해야 한다는 압력을 받고 있습니다.
자주 묻는 질문
목차
제1장 조사 방법과 범위
제2장 주요 요약
제3장 세계의 산업용 및 시설용 세정제 시장 변수, 동향, 범위
- 시장 계보 전망
- 산업 밸류체인 분석
- 원료 동향
- 원료 동향
- 유통 채널 분석
- 규제 프레임워크
- 시장 역학
- 사업 환경 분석
- Porter's Five Forces 분석
- PESTEL 분석
제4장 세계의 산업용 및 시설용 세정제 시장 : 원료별, 추정·동향 분석
- 원료별 변동 분석과 시장 점유율(2025년과 2033년)
- 염소 알칼리
- 계면활성제
- 용제
- 인산염
- 살균제
- 기타
제5장 세계의 산업용 및 시설용 세정제 시장 : 제품별, 추정·동향 분석
- 제품별 변동 분석과 시장 점유율(2025년과 2033년)
- 범용 세제
- 소독제와 제균제
- 세탁용 세제
- 세차 제품
- 기타
제6장 세계의 산업용 및 시설용 세정제 시장 : 최종 용도별, 추정·동향 분석
- 최종 용도별 변동 분석과 시장 점유율(2025년과 2033년)
- 상업
- 제조업
제7장 세계의 산업용 및 시설용 세정제 시장 : 지역별, 추정·동향 분석
- 지역별 변동 분석과 시장 점유율(2025년과 2033년)
- 북미
- 미국
- 캐나다
- 멕시코
- 유럽
- 독일
- 영국
- 프랑스
- 이탈리아
- 아시아태평양
- 중국
- 인도
- 일본
- 한국
- 라틴아메리카
- 브라질
- 아르헨티나
- 중동 및 아프리카
- 사우디아라비아
- 남아프리카공화국
제8장 경쟁 구도
- 주요 세계의 기업과 최근 동향, 산업에 대한 영향
- 기업/경쟁 분류
- 기업별 시장 상황 분석(2024년)
- 기업 히트맵 분석
- 전략 매핑
- 사업 확대
- 인수합병
- 제휴 파트너십·계약
- 신제품 발매
- 기타
제9장 기업 리스트(개요, 재무 실적, 제품 개요)
- Procter & Gamble
- BASF SE
- Clariant
- The Clorox Company, Inc.
- Henkel AG & Co. KGaA
- 3M
- Kimberly-Clark Corporation
- Reckitt Benckiser Group plc
- Croda International PLC
- Albemarle Corporation
- Eastman Chemical Corporation
- Huntsman International LLC
- STEPAN Company
- Westlake Chemicals Corporation
- SOLVAY
- Dow
- Sasol
Industrial And Institutional Cleaning Chemicals Market Summary
The global industrial and institutional cleaning chemicals marketsize was estimated at USD 86.46 billion in 2025 and is projected to reach USD 156.99 billion by 2033, growing at a CAGR of 8.0% from 2026 to 2033. The market's growth is driven by rising hygiene standards, stringent health and safety regulations, increased demand from the healthcare and food service sectors, growing awareness of sustainable cleaning solutions, and technological advancements enabling more effective, eco-friendly, and specialized cleaning chemical formulations worldwide.
Heightened hygiene and safety concerns following the pandemic have significantly boosted global consumption of industrial and institutional cleaning chemicals. Strict health regulations in sectors like healthcare and food processing further drive demand for effective cleaners, disinfectants, and sanitizers. In countries like the U.S., a large industrial base and widespread maintenance of public spaces contribute to consistent market growth. Manufacturers are prioritizing R&D to diversify product portfolios with advanced and more efficient cleaning solutions.
There is immense potential for sustainable and eco-friendly cleaning products as consumers increasingly seek ways to lower their carbon footprint. Growing demand for plant-based, non-toxic, and biodegradable chemicals, particularly in developed markets like the U.S., presents lucrative opportunities for manufacturers. Companies investing in green innovation and transparent labeling can strengthen their market presence while supporting sustainability goals.
Despite robust growth, the market faces challenges such as the high cost of developing sustainable cleaning solutions and the complex regulatory approvals required for new chemical formulations. Overuse or misuse of harsh chemical cleaners can pose environmental risks, creating pressure on manufacturers to balance efficacy with safety and sustainability without compromising performance standards.
Global Industrial And Institutional Cleaning Chemicals Market Report Segmentation
This report forecasts volume & revenue growth at a global level and provides an analysis of the latest industry trends in each of the sub-segments from 2021 to 2033. For this study, Grand View Research has segmented the global industrial and institutional cleaning chemicals market report based on raw material, product, end-use, and region:
- Raw material Outlook (Revenue, USD Million, 2021 - 2033)
- Chlor-alkali
- Caustic Soda
- Soda Ash
- Chlorine
- Surfactant
- Nonionic
- Anionic
- Cationic
- Amphoteric
- Solvents
- Alcohols
- Hydrocarbons
- Chlorinated
- Ethers
- Others
- Phosphates
- Biocides
- Others
- Product Outlook (Revenue, USD Million, 2021 - 2033)
- General Purpose Cleaners
- Disinfectants And Sanitizers
- Laundry Care Products
- Vehicle Wash Products
- Others
- End-use Outlook (Revenue, USD Million, 2021 - 2033)
- Commercial
- Food Service
- Retail
- Healthcare
- Laundry Care
- Institutional Buildings
- Others
- Manufacturing
- Food & Beverage Processing
- Metal Manufacturing & Fabrication
- Electronic Components
- Others
- Region Outlook (Revenue, USD Million, 2021 - 2033)
- North America
- U.S.
- Canada
- Mexico
- Europe
- Germany
- UK
- France
- Italy
- Asia Pacific
- China
- India
- Japan
- South Korea
- Latin America
- Brazil
- Argentina
- Middle East & Africa
- Saudi Arabia
- South Africa
Table of Contents
Chapter 1. Methodology and Scope
- 1.1. Research Methodology
- 1.1.1. Market Segmentation
- 1.1.2. Market Definition
- 1.2. Research Scope & Assumptions
- 1.3. Information Procurement
- 1.3.1. Purchased Database
- 1.3.2. GVR's Internal Database
- 1.3.3. Secondary Sources & Third-Party Perspectives
- 1.3.4. Primary Research
- 1.4. Information Analysis
- 1.4.1. Data Analysis Models
- 1.5. Market Formulation & Data Visualization
- 1.6. Data Validation & Publishing
- 1.7. List of Abbreviations
Chapter 2. Executive Summary
- 2.1. Market Snapshot, 2024 (USD Million)
- 2.2. Segmental Snapshot
- 2.3. Competitive Landscape Snapshot
Chapter 3. Global Industrial And Institutional Cleaning Chemicals Market Variables, Trends, and Scope
- 3.1. Market Lineage Outlook
- 3.2. Industry Value Chain Analysis
- 3.2.1. Raw Material Trends
- 3.2.2. Raw material Trends
- 3.2.3. Sales Channel Analysis
- 3.3. Regulatory Framework
- 3.4. Market Dynamics
- 3.4.1. Market Driver Analysis
- 3.4.2. Market Restraint Analysis
- 3.4.3. Market Opportunity Analysis
- 3.4.4. Market Challenge Analysis
- 3.5. Business Environment Analysis
- 3.5.1. Porter's Five Forces Analysis
- 3.5.2. PESTEL Analysis
Chapter 4. Global Industrial And Institutional Cleaning Chemicals Market: Raw material Estimates & Trend Analysis
- 4.1. Key Takeaways
- 4.2. Raw material Movement Analysis & Market Share, 2025 & 2033
- 4.2.1. Chlor-alkali
- 4.2.1.1. Market estimates and forecasts, 2021 - 2033 (USD Million)
- 4.2.1.2. Caustic Soda
- 4.2.1.2.1. Market estimates and forecasts, 2021 - 2033 (USD Million)
- 4.2.1.3. Soda Ash
- 4.2.1.3.1. Market estimates and forecasts, 2021 - 2033 (USD Million)
- 4.2.1.4. Chlorine
- 4.2.1.4.1. Market estimates and forecasts, 2021 - 2033 (USD Million)
- 4.2.2. Surfactant
- 4.2.2.1. Market estimates and forecasts, 2021 - 2033 (USD Million)
- 4.2.2.2. Nonionic
- 4.2.2.2.1. Market estimates and forecasts, 2021 - 2033 (USD Million)
- 4.2.2.3. Anionic
- 4.2.2.3.1. Market estimates and forecasts, 2021 - 2033 (USD Million)
- 4.2.2.4. Cationic
- 4.2.2.4.1. Market estimates and forecasts, 2021 - 2033 (USD Million)
- 4.2.2.5. Amphoteric
- 4.2.2.5.1. Market estimates and forecasts, 2021 - 2033 (USD Million)
- 4.2.3. Solvents
- 4.2.3.1. Market estimates and forecasts, 2021 - 2033 (USD Million)
- 4.2.3.2. Alcohols
- 4.2.3.2.1. Market estimates and forecasts, 2021 - 2033 (USD Million)
- 4.2.3.3. Hydrocarbons
- 4.2.3.3.1. Market estimates and forecasts, 2021 - 2033 (USD Million)
- 4.2.3.4. Chlorinated
- 4.2.3.4.1. Market estimates and forecasts, 2021 - 2033 (USD Million)
- 4.2.3.5. Ethers
- 4.2.3.5.1. Market estimates and forecasts, 2021 - 2033 (USD Million)
- 4.2.3.6. Others
- 4.2.3.6.1. Market estimates and forecasts, 2021 - 2033 (USD Million)
- 4.2.4. Phosphates
- 4.2.4.1. Market estimates and forecasts, 2021 - 2033 (USD Million)
- 4.2.5. Biocides
- 4.2.5.1. Market estimates and forecasts, 2021 - 2033 (USD Million)
- 4.2.6. Others
- 4.2.6.1. Market estimates and forecasts, 2021 - 2033 (USD Million)
- 4.2.1. Chlor-alkali
Chapter 5. Global Industrial And Institutional Cleaning Chemicals Market: Product Estimates & Trend Analysis
- 5.1. Key Takeaways
- 5.2. Product Movement Analysis & Market Share, 2025 & 2033
- 5.2.1. General Purpose Cleaners
- 5.2.1.1. Market estimates and forecasts, 2021 - 2033 (USD Million)
- 5.2.2. Disinfectants And Sanitizers
- 5.2.2.1. Market estimates and forecasts, 2021 - 2033 (USD Million)
- 5.2.3. Laundry Care Products
- 5.2.3.1. Market estimates and forecasts, 2021 - 2033 (USD Million)
- 5.2.4. Vehicle Wash Products
- 5.2.4.1. Market estimates and forecasts, 2021 - 2033 (USD Million)
- 5.2.5. Others
- 5.2.5.1. Market estimates and forecasts, 2021 - 2033 (USD Million)
- 5.2.1. General Purpose Cleaners
Chapter 6. Global Industrial And Institutional Cleaning Chemicals Market: End Use Estimates & Trend Analysis
- 6.1. Key Takeaways
- 6.2. End Use Movement Analysis & Market Share, 2025 & 2033
- 6.2.1. Commercial
- 6.2.1.1. Market estimates and forecasts, 2021 - 2033 (USD Million)
- 6.2.1.2. Food Service
- 6.2.1.2.1. Market estimates and forecasts, 2021 - 2033 (USD Million)
- 6.2.1.3. Retail
- 6.2.1.3.1. Market estimates and forecasts, 2021 - 2033 (USD Million)
- 6.2.1.4. Healthcare
- 6.2.1.4.1. Market estimates and forecasts, 2021 - 2033 (USD Million)
- 6.2.1.5. Laundry Care
- 6.2.1.5.1. Market estimates and forecasts, 2021 - 2033 (USD Million)
- 6.2.1.6. Institutional Buildings
- 6.2.1.6.1. Market estimates and forecasts, 2021 - 2033 (USD Million)
- 6.2.1.7. Others
- 6.2.1.7.1. Market estimates and forecasts, 2021 - 2033 (USD Million)
- 6.2.2. Manufacturing
- 6.2.2.1. Market estimates and forecasts, 2021 - 2033 (USD Million)
- 6.2.2.2. Food & Beverage Processing
- 6.2.2.2.1. Market estimates and forecasts, 2021 - 2033 (USD Million)
- 6.2.2.3. Metal Manufacturing & Fabrication
- 6.2.2.3.1. Market estimates and forecasts, 2021 - 2033 (USD Million)
- 6.2.2.4. Electronic Components
- 6.2.2.4.1. Market estimates and forecasts, 2021 - 2033 (USD Million)
- 6.2.2.5. Others
- 6.2.2.5.1. Market estimates and forecasts, 2021 - 2033 (USD Million)
- 6.2.1. Commercial
Chapter 7. Global Industrial And Institutional Cleaning Chemicals Market: Region Estimates & Trend Analysis
- 7.1. Key Takeaways
- 7.2. Regional Movement Analysis & Market Share, 2025 & 2033
- 7.3. North America
- 7.3.1. North America Industrial And Institutional Cleaning Chemicals Market Estimates & Forecasts, 2021 - 2033 (USD Million)
- 7.3.2. Market estimates and forecasts, By Raw material, 2021 - 2033 (USD Million)
- 7.3.3. Market estimates and forecasts, By Product, 2021 - 2033 (USD Million)
- 7.3.4. Market estimates and forecasts, By End Use, 2021 - 2033 (USD Million)
- 7.3.5. U.S.
- 7.3.5.1. U.S. Industrial And Institutional Cleaning Chemicals Market Estimates & Forecasts, 2021 - 2033 (USD Million)
- 7.3.5.2. Market estimates and forecasts, By Raw material, 2021 - 2033 (USD Million)
- 7.3.5.3. Market estimates and forecasts, By Product, 2021 - 2033 (USD Million)
- 7.3.5.4. Market estimates and forecasts, By End Use, 2021 - 2033 (USD Million)
- 7.3.6. Canada
- 7.3.6.1. Canada Industrial And Institutional Cleaning Chemicals Market Estimates & Forecasts, 2021 - 2033 (USD Million)
- 7.3.6.2. Market estimates and forecasts, By Raw material, 2021 - 2033 (USD Million)
- 7.3.6.3. Market estimates and forecasts, By Product, 2021 - 2033 (USD Million)
- 7.3.6.4. Market estimates and forecasts, By End Use, 2021 - 2033 (USD Million)
- 7.3.7. Mexico
- 7.3.7.1. Mexico Industrial And Institutional Cleaning Chemicals Market Estimates & Forecasts, 2021 - 2033 (USD Million)
- 7.3.7.2. Market estimates and forecasts, By Raw material, 2021 - 2033 (USD Million)
- 7.3.7.3. Market estimates and forecasts, By Product, 2021 - 2033 (USD Million)
- 7.3.7.4. Market estimates and forecasts, By End Use, 2021 - 2033 (USD Million)
- 7.4. Europe
- 7.4.1. Europe Industrial And Institutional Cleaning Chemicals Market Estimates & Forecasts, 2021 - 2033 (USD Million)
- 7.4.2. Market estimates and forecasts, By Raw material, 2021 - 2033 (USD Million)
- 7.4.3. Market estimates and forecasts, By Product, 2021 - 2033 (USD Million)
- 7.4.4. Market estimates and forecasts, By End Use, 2021 - 2033 (USD Million)
- 7.4.5. Germany
- 7.4.5.1. Germany Industrial And Institutional Cleaning Chemicals Market Estimates & Forecasts, 2021 - 2033 (USD Million)
- 7.4.5.2. Market estimates and forecasts, By Raw material, 2021 - 2033 (USD Million)
- 7.4.5.3. Market estimates and forecasts, By Product, 2021 - 2033 (USD Million)
- 7.4.5.4. Market estimates and forecasts, By End Use, 2021 - 2033 (USD Million)
- 7.4.6. UK
- 7.4.6.1. UK Industrial And Institutional Cleaning Chemicals Market Estimates & Forecasts, 2021 - 2033 (USD Million)
- 7.4.6.2. Market estimates and forecasts, By Raw material, 2021 - 2033 (USD Million)
- 7.4.6.3. Market estimates and forecasts, By Product, 2021 - 2033 (USD Million)
- 7.4.6.4. Market estimates and forecasts, By End Use, 2021 - 2033 (USD Million)
- 7.4.7. France
- 7.4.7.1. France Industrial And Institutional Cleaning Chemicals Market Estimates & Forecasts, 2021 - 2033 (USD Million)
- 7.4.7.2. Market estimates and forecasts, By Raw material, 2021 - 2033 (USD Million)
- 7.4.7.3. Market estimates and forecasts, By Product, 2021 - 2033 (USD Million)
- 7.4.7.4. Market estimates and forecasts, By End Use, 2021 - 2033 (USD Million)
- 7.4.8. Italy
- 7.4.8.1. Italy Industrial And Institutional Cleaning Chemicals Market Estimates & Forecasts, 2021 - 2033 (USD Million)
- 7.4.8.2. Market estimates and forecasts, By Raw material, 2021 - 2033 (USD Million)
- 7.4.8.3. Market estimates and forecasts, By Product, 2021 - 2033 (USD Million)
- 7.4.8.4. Market estimates and forecasts, By End Use, 2021 - 2033 (USD Million)
- 7.5. Asia Pacific
- 7.5.1. Asia Pacific Industrial And Institutional Cleaning Chemicals Market Estimates & Forecasts, 2021 - 2033 (USD Million)
- 7.5.2. Market estimates and forecasts, By Raw material, 2021 - 2033 (USD Million)
- 7.5.3. Market estimates and forecasts, By Product, 2021 - 2033 (USD Million)
- 7.5.4. Market estimates and forecasts, By End Use, 2021 - 2033 (USD Million)
- 7.5.5. China
- 7.5.5.1. China Industrial And Institutional Cleaning Chemicals Market Estimates & Forecasts, 2021 - 2033 (USD Million)
- 7.5.5.2. Market estimates and forecasts, By Raw material, 2021 - 2033 (USD Million)
- 7.5.5.3. Market estimates and forecasts, By Product, 2021 - 2033 (USD Million)
- 7.5.5.4. Market estimates and forecasts, By End Use, 2021 - 2033 (USD Million)
- 7.5.6. India
- 7.5.6.1. India Industrial And Institutional Cleaning Chemicals Market Estimates & Forecasts, 2021 - 2033 (USD Million)
- 7.5.6.2. Market estimates and forecasts, By Raw material, 2021 - 2033 (USD Million)
- 7.5.6.3. Market estimates and forecasts, By Product, 2021 - 2033 (USD Million)
- 7.5.6.4. Market estimates and forecasts, By End Use, 2021 - 2033 (USD Million)
- 7.5.7. Japan
- 7.5.7.1. Japan Industrial And Institutional Cleaning Chemicals Market Estimates & Forecasts, 2021 - 2033 (USD Million)
- 7.5.7.2. Market estimates and forecasts, By Raw material, 2021 - 2033 (USD Million)
- 7.5.7.3. Market estimates and forecasts, By Product, 2021 - 2033 (USD Million)
- 7.5.7.4. Market estimates and forecasts, By End Use, 2021 - 2033 (USD Million)
- 7.5.8. South Korea
- 7.5.8.1. South Korea Industrial And Institutional Cleaning Chemicals Market Estimates & Forecasts, 2021 - 2033 (USD Million)
- 7.5.8.2. Market estimates and forecasts, By Raw material, 2021 - 2033 (USD Million)
- 7.5.8.3. Market estimates and forecasts, By Product, 2021 - 2033 (USD Million)
- 7.5.8.4. Market estimates and forecasts, By End Use, 2021 - 2033 (USD Million)
- 7.6. Latin America
- 7.6.1. Latin America Industrial And Institutional Cleaning Chemicals Market Estimates & Forecasts, 2021 - 2033 (USD Million)
- 7.6.2. Market estimates and forecasts, By Raw material, 2021 - 2033 (USD Million)
- 7.6.3. Market estimates and forecasts, By Product, 2021 - 2033 (USD Million)
- 7.6.4. Market estimates and forecasts, By End Use, 2021 - 2033 (USD Million)
- 7.6.5. Brazil
- 7.6.5.1. Brazil Industrial And Institutional Cleaning Chemicals Market Estimates & Forecasts, 2021 - 2033 (USD Million)
- 7.6.5.2. Market estimates and forecasts, By Raw material, 2021 - 2033 (USD Million)
- 7.6.5.3. Market estimates and forecasts, By Product, 2021 - 2033 (USD Million)
- 7.6.5.4. Market estimates and forecasts, By End Use, 2021 - 2033 (USD Million)
- 7.6.6. Argentina
- 7.6.6.1. Argentina Industrial And Institutional Cleaning Chemicals Market Estimates & Forecasts, 2021 - 2033 (USD Million)
- 7.6.6.2. Market estimates and forecasts, By Raw material, 2021 - 2033 (USD Million)
- 7.6.6.3. Market estimates and forecasts, By Product, 2021 - 2033 (USD Million)
- 7.6.6.4. Market estimates and forecasts, By End Use, 2021 - 2033 (USD Million)
- 7.7. Middle East & Africa
- 7.7.1. Middle East & Africa Industrial And Institutional Cleaning Chemicals Market Estimates & Forecasts, 2021 - 2033 (USD Million)
- 7.7.2. Market estimates and forecasts, By Raw material, 2021 - 2033 (USD Million)
- 7.7.3. Market estimates and forecasts, By Product, 2021 - 2033 (USD Million)
- 7.7.4. Market estimates and forecasts, By End Use, 2021 - 2033 (USD Million)
- 7.7.5. Saudi Arabia
- 7.7.5.1. Saudi Arabia Industrial And Institutional Cleaning Chemicals Market Estimates & Forecasts, 2021 - 2033 (USD Million)
- 7.7.5.2. Market estimates and forecasts, By Raw material, 2021 - 2033 (USD Million)
- 7.7.5.3. Market estimates and forecasts, By Product, 2021 - 2033 (USD Million)
- 7.7.5.4. Market estimates and forecasts, By End Use, 2021 - 2033 (USD Million)
- 7.7.6. South Africa
- 7.7.6.1. South Africa Industrial And Institutional Cleaning Chemicals Market Estimates & Forecasts, 2021 - 2033 (USD Million)
- 7.7.6.2. Market estimates and forecasts, By Raw material, 2021 - 2033 (USD Million)
- 7.7.6.3. Market estimates and forecasts, By Product, 2021 - 2033 (USD Million)
- 7.7.6.4. Market estimates and forecasts, By End Use, 2021 - 2033 (USD Million)
Chapter 8. Competitive Landscape
- 8.1. Key Global Players & Recent Developments & Their Impact on the Industry
- 8.2. Company/Competition Categorization
- 8.3. Company Market Position Analysis, 2024
- 8.4. Company Heat Map Analysis
- 8.5. Strategy Mapping
- 8.5.1. Expansions
- 8.5.2. Mergers & Acquisitions
- 8.5.3. Collaborations/Partnerships/Agreements
- 8.5.4. New Product Launches
- 8.5.5. Others
Chapter 9. Company Listing (Overview, Financial Performance, Products Overview)
- 9.1. Procter & Gamble
- 9.1.1. Company Overview
- 9.1.2. Financial Performance
- 9.1.3. Product Benchmarking
- 9.2. BASF SE
- 9.2.1. Company Overview
- 9.2.2. Financial Performance
- 9.2.3. Product Benchmarking
- 9.3. Clariant
- 9.3.1. Company Overview
- 9.3.2. Financial Performance
- 9.3.3. Product Benchmarking
- 9.4. The Clorox Company, Inc.
- 9.4.1. Company Overview
- 9.4.2. Financial Performance
- 9.4.3. Product Benchmarking
- 9.5. Henkel AG & Co. KGaA
- 9.5.1. Company Overview
- 9.5.2. Financial Performance
- 9.5.3. Product Benchmarking
- 9.6. 3M
- 9.6.1. Company Overview
- 9.6.2. Financial Performance
- 9.6.3. Product Benchmarking
- 9.7. Kimberly-Clark Corporation
- 9.7.1. Company Overview
- 9.7.2. Financial Performance
- 9.7.3. Product Benchmarking
- 9.8. Reckitt Benckiser Group plc
- 9.8.1. Company Overview
- 9.8.2. Financial Performance
- 9.8.3. Product Benchmarking
- 9.9. Croda International PLC
- 9.9.1. Company Overview
- 9.9.2. Financial Performance
- 9.9.3. Product Benchmarking
- 9.10. Albemarle Corporation
- 9.10.1. Company Overview
- 9.10.2. Financial Performance
- 9.10.3. Product Benchmarking
- 9.11. Eastman Chemical Corporation
- 9.11.1. Company Overview
- 9.11.2. Financial Performance
- 9.11.3. Product Benchmarking
- 9.12. Huntsman International LLC
- 9.12.1. Company Overview
- 9.12.2. Financial Performance
- 9.12.3. Product Benchmarking
- 9.13. STEPAN Company
- 9.13.1. Company Overview
- 9.13.2. Financial Performance
- 9.13.3. Product Benchmarking
- 9.14. Westlake Chemicals Corporation
- 9.14.1. Company Overview
- 9.14.2. Financial Performance
- 9.14.3. Product Benchmarking
- 9.15. SOLVAY
- 9.15.1. Company Overview
- 9.15.2. Financial Performance
- 9.15.3. Product Benchmarking
- 9.16. Dow
- 9.16.1. Company Overview
- 9.16.2. Financial Performance
- 9.16.3. Product Benchmarking
- 9.17. Sasol
- 9.17.1. Company Overview
- 9.17.2. Financial Performance
- 9.17.3. Product Benchmarking
(주말 및 공휴일 제외)


