|
시장보고서
상품코드
1515750
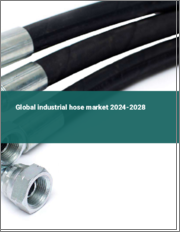
산업용 호스 시장(2024-2028년)Global industrial hose market 2024-2028 |
||||||
산업용 호스 시장은 2023-20281년에 26억 5,080만 달러, 예측 기간 중 CAGR은 4.36%로 성장할 것으로 예측됩니다.
산업용 호스 시장의 전체적인 분석, 시장 규모·예측, 동향, 성장 촉진요인, 과제, 약 25개 벤더를 다룬 벤더 분석 등을 제공합니다.
현재의 시장 시나리오, 최신 동향과 촉진요인, 시장 환경 전체에 관한 최신 분석을 제공하고 있습니다. PVC 수요의 증가, 세계의 건설 프로젝트의 증가, 자동차 수요의 증가 등이 시장을 촉진하고 있습니다.
| 시장 범위 | |
|---|---|
| 기준년 | 2024 |
| 종료년 | 2028 |
| 예측 기간 | 2024-2028 |
| 성장 모멘텀 | 가속 |
| 전년대비 2024년 | 4.11% |
| CAGR | 4.36% |
| 증분액 | 26억 5,080만 달러 |
본 조사에서는 향후 수년간 산업용 호스 시장 성장을 촉진하는 주요 요인의 하나로 농업 분야에서 유압 고무 호스 수요의 증가를 들고 있습니다. 또한 중국에서 산업용 호스의 수요 증가 및 정기적인 제품 발매가 시장의 큰 수요로 연결됩니다.
목차
제1장 주요 요약
- 시장 개요
제2장 시장 구도
- 시장 에코시스템
- 시장의 특징
- 밸류체인 분석
제3장 시장 규모의 평가
- 시장의 정의
- 시장 부문 분석
- 시장 규모 2023
- 시장 전망 2023-2028
제4장 시장 규모 실적
- 세계의 산업용 호스 시장 2018-2022
- 용도별 부문 분석 2018-2022
- 재료별 부문 분석 2018-2022
- 지역별 부문 분석 2018-2022
- 국가별 부문 분석 2018-2022
제5장 Five forces 분석
- Five Forces 요약
- 구매자의 교섭력
- 공급 기업의 교섭력
- 신규 진출업체의 위협
- 대체품의 위협
- 경쟁의 위협
- 시장 현황
제6장 시장 세분화 : 용도별
- 시장 세분화
- 비교 : 용도별
- 석유 및 가스 : 시장 규모와 예측 2023-2028
- 화학제품 : 시장 규모와 예측 2023-2028
- 식품 및 음료 : 시장 규모와 예측 2023-2028
- 자동차 : 시장 규모와 예측 2023-2028
- 기타 : 시장 규모와 예측 2023-2028
- 시장 기회 : 용도별
제7장 시장 세분화 : 소재별
- 시장 세분화
- 비교 : 소재별
- 폴리우레탄 : 시장 규모와 예측 2023-2028
- 폴리염화비닐 : 시장 규모와 예측 2023-2028
- 실리콘 : 시장 규모와 예측 2023-2028
- 고무 : 시장 규모와 예측 2023-2028
- 기타 : 시장 규모와 예측 2023-2028
- 시장 기회 : 소재별
제8장 고객 상황
- 고객 상황의 개요
제9장 지역별 상황
- 지역별 세분화
- 지역별 비교
- 아시아태평양 : 시장 규모와 예측 2023-2028
- 북미 : 시장 규모와 예측 2023-2028
- 유럽 : 시장 규모와 예측 2023-2028
- 중동 및 아프리카 : 시장 규모와 예측 2023-2028
- 남미 : 시장 규모와 예측 2023-2028
- 미국 : 시장 규모와 예측 2023-2028
- 중국 : 시장 규모와 예측 2023-2028
- 일본 : 시장 규모와 예측 2023-2028
- 독일 : 시장 규모와 예측 2023-2028
- 인도 : 시장 규모와 예측 2023-2028
- 시장 기회 : 지역 상황별
제10장 촉진요인·과제·기회·억제요인
- 시장 촉진요인
- 시장이 해결해야 할 과제
- 촉진요인과 과제의 영향
- 시장의 기회·억제요인
제11장 경쟁 구도
- 개요
- 경쟁 구도
- 혼란의 상황
- 업계의 리스크
제12장 경쟁 분석
- 기업 개요
- 기업의 시장 포지셔닝
- Bridgestone Corp.
- Continental AG
- Eaton Corp. Plc
- Flexaust Inc.
- Gates Industrial Corp. Plc
- Kanaflex Corp. Co. Ltd.
- Kuriyama of America Inc.
- Kurt Manufacturing
- NORRES Schlauchtechnik GmbH
- Pacific Echo Inc.
- Parker Hannifin Corp.
- RYCO Hydraulics Pty Ltd.
- Semperit AG Holding
- Smiths Group Plc
- Trelleborg AB
제13장 부록
KSA 24.07.24The industrial hose market is forecasted to grow by USD 2650.8 mn during 2023-2028, accelerating at a CAGR of 4.36% during the forecast period. The report on the industrial hose market provides a holistic analysis, market size and forecast, trends, growth drivers, and challenges, as well as vendor analysis covering around 25 vendors.
The report offers an up-to-date analysis regarding the current market scenario, the latest trends and drivers, and the overall market environment. The market is driven by increasing demand for PVC, rising construction projects globally, and rising demand for vehicles.
Technavio's industrial hose market is segmented as below:
| Market Scope | |
|---|---|
| Base Year | 2024 |
| End Year | 2028 |
| Series Year | 2024-2028 |
| Growth Momentum | Accelerate |
| YOY 2024 | 4.11% |
| CAGR | 4.36% |
| Incremental Value | $2650.8mn |
ByApplication
- Oil and gas
- Chemicals
- Food and beverages
- Automotive
- Others
ByMaterial
- Polyurethane
- Polyvinyl chloride
- Silicone
- Rubber
- Others
ByGeography
- APAC
- North America
- Europe
- Middle East and Africa
- South America
This study identifies the rising demand for hydraulic rubber hoses in agriculture sector as one of the prime reasons driving the industrial hose market growth during the next few years. Also, increasing demand for industrial hose in China and regular product launches will lead to sizable demand in the market.
The report on the industrial hose market covers the following areas:
- Industrial hose market sizing
- Industrial hose market forecast
- Industrial hose market industry analysis
The robust vendor analysis is designed to help clients improve their market position, and in line with this, this report provides a detailed analysis of several leading industrial hose market vendors that include Bridgestone Corp., Continental AG, Eaton Corp. Plc, Flexaust Inc., Gates Industrial Corp. Plc, Hose Master LLC, Kanaflex Corp. Co. Ltd., Kuriyama of America Inc., Kurt Manufacturing, NORRES Schlauchtechnik GmbH, Pacific Echo Inc., Parker Hannifin Corp., RYCO Hydraulics Pty Ltd., Salem Republic Rubber Co., Semperit AG Holding, Smiths Group Plc, Sun Flow Inc., Transfer Oil Spa, Trelleborg AB, and UIP International Inc.. Also, the industrial hose market analysis report includes information on upcoming trends and challenges that will influence market growth. This is to help companies strategize and leverage all forthcoming growth opportunities.
The study was conducted using an objective combination of primary and secondary information including inputs from key participants in the industry. The report contains a comprehensive market and vendor landscape in addition to an analysis of the key vendors.
The publisher presents a detailed picture of the market by the way of study, synthesis, and summation of data from multiple sources by an analysis of key parameters such as profit, pricing, competition, and promotions. It presents various market facets by identifying the key industry influencers. The data presented is comprehensive, reliable, and a result of extensive research - both primary and secondary. The market research reports provide a complete competitive landscape and an in-depth vendor selection methodology and analysis using qualitative and quantitative research to forecast the accurate market growth.
Table of Contents
1 Executive Summary
- 1.1 Market overview
- Executive Summary - Chart on Market Overview
- Executive Summary - Data Table on Market Overview
- Executive Summary - Chart on Global Market Characteristics
- Executive Summary - Chart on Market By Geographical Landscape
- Executive Summary - Chart on Market Segmentation by Application
- Executive Summary - Chart on Market Segmentation by Material
- Executive Summary - Chart on Incremental Growth
- Executive Summary - Data Table on Incremental Growth
- Executive Summary - Chart on Company Market Positioning
2 Market Landscape
- 2.1 Market ecosystem
- Parent Market
- Data Table on - Parent Market
- 2.2 Market characteristics
- Market characteristics analysis
- 2.3 Value chain analysis
- Value Chain Analysis
3 Market Sizing
- 3.1 Market definition
- Offerings of companies included in the market definition
- 3.2 Market segment analysis
- Market segments
- 3.3 Market size 2023
- 3.4 Market outlook: Forecast for 2023-2028
- Chart on Global - Market size and forecast 2023-2028 ($ million)
- Data Table on Global - Market size and forecast 2023-2028 ($ million)
- Chart on Global Market: Year-over-year growth 2023-2028 (%)
- Data Table on Global Market: Year-over-year growth 2023-2028 (%)
4 Historic Market Size
- 4.1 Global Industrial Hose Market 2018 - 2022
- Historic Market Size - Data Table on Global Industrial Hose Market 2018 - 2022 ($ million)
- 4.2 Application segment analysis 2018 - 2022
- Historic Market Size - Application Segment 2018 - 2022 ($ million)
- 4.3 Material segment analysis 2018 - 2022
- Historic Market Size - Material Segment 2018 - 2022 ($ million)
- 4.4 Geography segment analysis 2018 - 2022
- Historic Market Size - Geography Segment 2018 - 2022 ($ million)
- 4.5 Country segment analysis 2018 - 2022
- Historic Market Size - Country Segment 2018 - 2022 ($ million)
5 Five Forces Analysis
- 5.1 Five forces summary
- Five forces analysis - Comparison between 2023 and 2028
- 5.2 Bargaining power of buyers
- Bargaining power of buyers - Impact of key factors 2023 and 2028
- 5.3 Bargaining power of suppliers
- Bargaining power of suppliers - Impact of key factors in 2023 and 2028
- 5.4 Threat of new entrants
- Threat of new entrants - Impact of key factors in 2023 and 2028
- 5.5 Threat of substitutes
- Threat of substitutes - Impact of key factors in 2023 and 2028
- 5.6 Threat of rivalry
- Threat of rivalry - Impact of key factors in 2023 and 2028
- 5.7 Market condition
- Chart on Market condition - Five forces 2023 and 2028
6 Market Segmentation by Application
- 6.1 Market segments
- Chart on Application - Market share 2023-2028 (%)
- Data Table on Application - Market share 2023-2028 (%)
- 6.2 Comparison by Application
- Chart on Comparison by Application
- Data Table on Comparison by Application
- 6.3 Oil and gas - Market size and forecast 2023-2028
- Chart on Oil and gas - Market size and forecast 2023-2028 ($ million)
- Data Table on Oil and gas - Market size and forecast 2023-2028 ($ million)
- Chart on Oil and gas - Year-over-year growth 2023-2028 (%)
- Data Table on Oil and gas - Year-over-year growth 2023-2028 (%)
- 6.4 Chemicals - Market size and forecast 2023-2028
- Chart on Chemicals - Market size and forecast 2023-2028 ($ million)
- Data Table on Chemicals - Market size and forecast 2023-2028 ($ million)
- Chart on Chemicals - Year-over-year growth 2023-2028 (%)
- Data Table on Chemicals - Year-over-year growth 2023-2028 (%)
- 6.5 Food and beverages - Market size and forecast 2023-2028
- Chart on Food and beverages - Market size and forecast 2023-2028 ($ million)
- Data Table on Food and beverages - Market size and forecast 2023-2028 ($ million)
- Chart on Food and beverages - Year-over-year growth 2023-2028 (%)
- Data Table on Food and beverages - Year-over-year growth 2023-2028 (%)
- 6.6 Automotive - Market size and forecast 2023-2028
- Chart on Automotive - Market size and forecast 2023-2028 ($ million)
- Data Table on Automotive - Market size and forecast 2023-2028 ($ million)
- Chart on Automotive - Year-over-year growth 2023-2028 (%)
- Data Table on Automotive - Year-over-year growth 2023-2028 (%)
- 6.7 Others - Market size and forecast 2023-2028
- Chart on Others - Market size and forecast 2023-2028 ($ million)
- Data Table on Others - Market size and forecast 2023-2028 ($ million)
- Chart on Others - Year-over-year growth 2023-2028 (%)
- Data Table on Others - Year-over-year growth 2023-2028 (%)
- 6.8 Market opportunity by Application
- Market opportunity by Application ($ million)
- Data Table on Market opportunity by Application ($ million)
7 Market Segmentation by Material
- 7.1 Market segments
- Chart on Material - Market share 2023-2028 (%)
- Data Table on Material - Market share 2023-2028 (%)
- 7.2 Comparison by Material
- Chart on Comparison by Material
- Data Table on Comparison by Material
- 7.3 Polyurethane - Market size and forecast 2023-2028
- Chart on Polyurethane - Market size and forecast 2023-2028 ($ million)
- Data Table on Polyurethane - Market size and forecast 2023-2028 ($ million)
- Chart on Polyurethane - Year-over-year growth 2023-2028 (%)
- Data Table on Polyurethane - Year-over-year growth 2023-2028 (%)
- 7.4 Polyvinyl chloride - Market size and forecast 2023-2028
- Chart on Polyvinyl chloride - Market size and forecast 2023-2028 ($ million)
- Data Table on Polyvinyl chloride - Market size and forecast 2023-2028 ($ million)
- Chart on Polyvinyl chloride - Year-over-year growth 2023-2028 (%)
- Data Table on Polyvinyl chloride - Year-over-year growth 2023-2028 (%)
- 7.5 Silicone - Market size and forecast 2023-2028
- Chart on Silicone - Market size and forecast 2023-2028 ($ million)
- Data Table on Silicone - Market size and forecast 2023-2028 ($ million)
- Chart on Silicone - Year-over-year growth 2023-2028 (%)
- Data Table on Silicone - Year-over-year growth 2023-2028 (%)
- 7.6 Rubber - Market size and forecast 2023-2028
- Chart on Rubber - Market size and forecast 2023-2028 ($ million)
- Data Table on Rubber - Market size and forecast 2023-2028 ($ million)
- Chart on Rubber - Year-over-year growth 2023-2028 (%)
- Data Table on Rubber - Year-over-year growth 2023-2028 (%)
- 7.7 Others - Market size and forecast 2023-2028
- Chart on Others - Market size and forecast 2023-2028 ($ million)
- Data Table on Others - Market size and forecast 2023-2028 ($ million)
- Chart on Others - Year-over-year growth 2023-2028 (%)
- Data Table on Others - Year-over-year growth 2023-2028 (%)
- 7.8 Market opportunity by Material
- Market opportunity by Material ($ million)
- Data Table on Market opportunity by Material ($ million)
8 Customer Landscape
- 8.1 Customer landscape overview
- Analysis of price sensitivity, lifecycle, customer purchase basket, adoption rates, and purchase criteria
9 Geographic Landscape
- 9.1 Geographic segmentation
- Chart on Market share By Geographical Landscape 2023-2028 (%)
- Data Table on Market share By Geographical Landscape 2023-2028 (%)
- 9.2 Geographic comparison
- Chart on Geographic comparison
- Data Table on Geographic comparison
- 9.3 APAC - Market size and forecast 2023-2028
- Chart on APAC - Market size and forecast 2023-2028 ($ million)
- Data Table on APAC - Market size and forecast 2023-2028 ($ million)
- Chart on APAC - Year-over-year growth 2023-2028 (%)
- Data Table on APAC - Year-over-year growth 2023-2028 (%)
- 9.4 North America - Market size and forecast 2023-2028
- Chart on North America - Market size and forecast 2023-2028 ($ million)
- Data Table on North America - Market size and forecast 2023-2028 ($ million)
- Chart on North America - Year-over-year growth 2023-2028 (%)
- Data Table on North America - Year-over-year growth 2023-2028 (%)
- 9.5 Europe - Market size and forecast 2023-2028
- Chart on Europe - Market size and forecast 2023-2028 ($ million)
- Data Table on Europe - Market size and forecast 2023-2028 ($ million)
- Chart on Europe - Year-over-year growth 2023-2028 (%)
- Data Table on Europe - Year-over-year growth 2023-2028 (%)
- 9.6 Middle East and Africa - Market size and forecast 2023-2028
- Chart on Middle East and Africa - Market size and forecast 2023-2028 ($ million)
- Data Table on Middle East and Africa - Market size and forecast 2023-2028 ($ million)
- Chart on Middle East and Africa - Year-over-year growth 2023-2028 (%)
- Data Table on Middle East and Africa - Year-over-year growth 2023-2028 (%)
- 9.7 South America - Market size and forecast 2023-2028
- Chart on South America - Market size and forecast 2023-2028 ($ million)
- Data Table on South America - Market size and forecast 2023-2028 ($ million)
- Chart on South America - Year-over-year growth 2023-2028 (%)
- Data Table on South America - Year-over-year growth 2023-2028 (%)
- 9.8 US - Market size and forecast 2023-2028
- Chart on US - Market size and forecast 2023-2028 ($ million)
- Data Table on US - Market size and forecast 2023-2028 ($ million)
- Chart on US - Year-over-year growth 2023-2028 (%)
- Data Table on US - Year-over-year growth 2023-2028 (%)
- 9.9 China - Market size and forecast 2023-2028
- Chart on China - Market size and forecast 2023-2028 ($ million)
- Data Table on China - Market size and forecast 2023-2028 ($ million)
- Chart on China - Year-over-year growth 2023-2028 (%)
- Data Table on China - Year-over-year growth 2023-2028 (%)
- 9.10 Japan - Market size and forecast 2023-2028
- Chart on Japan - Market size and forecast 2023-2028 ($ million)
- Data Table on Japan - Market size and forecast 2023-2028 ($ million)
- Chart on Japan - Year-over-year growth 2023-2028 (%)
- Data Table on Japan - Year-over-year growth 2023-2028 (%)
- 9.11 Germany - Market size and forecast 2023-2028
- Chart on Germany - Market size and forecast 2023-2028 ($ million)
- Data Table on Germany - Market size and forecast 2023-2028 ($ million)
- Chart on Germany - Year-over-year growth 2023-2028 (%)
- Data Table on Germany - Year-over-year growth 2023-2028 (%)
- 9.12 India - Market size and forecast 2023-2028
- Chart on India - Market size and forecast 2023-2028 ($ million)
- Data Table on India - Market size and forecast 2023-2028 ($ million)
- Chart on India - Year-over-year growth 2023-2028 (%)
- Data Table on India - Year-over-year growth 2023-2028 (%)
- 9.13 Market opportunity By Geographical Landscape
- Market opportunity By Geographical Landscape ($ million)
- Data Tables on Market opportunity By Geographical Landscape ($ million)
10 Drivers, Challenges, and Opportunity/Restraints
- 10.1 Market drivers
- 10.2 Market challenges
- 10.3 Impact of drivers and challenges
- Impact of drivers and challenges in 2023 and 2028
- 10.4 Market opportunities/restraints
11 Competitive Landscape
- 11.1 Overview
- 11.2 Competitive Landscape
- Overview on criticality of inputs and factors of differentiation
- 11.3 Landscape disruption
- Overview on factors of disruption
- 11.4 Industry risks
- Impact of key risks on business
12 Competitive Analysis
- 12.1 Companies profiled
- Companies covered
- 12.2 Market positioning of companies
- Matrix on companies position and classification
- 12.3 Bridgestone Corp.
- Bridgestone Corp. - Overview
- Bridgestone Corp. - Business segments
- Bridgestone Corp. - Key news
- Bridgestone Corp. - Key offerings
- Bridgestone Corp. - Segment focus
- 12.4 Continental AG
- Continental AG - Overview
- Continental AG - Business segments
- Continental AG - Key news
- Continental AG - Key offerings
- Continental AG - Segment focus
- 12.5 Eaton Corp. Plc
- Eaton Corp. Plc - Overview
- Eaton Corp. Plc - Business segments
- Eaton Corp. Plc - Key news
- Eaton Corp. Plc - Key offerings
- Eaton Corp. Plc - Segment focus
- 12.6 Flexaust Inc.
- Flexaust Inc. - Overview
- Flexaust Inc. - Product / Service
- Flexaust Inc. - Key offerings
- 12.7 Gates Industrial Corp. Plc
- Gates Industrial Corp. Plc - Overview
- Gates Industrial Corp. Plc - Business segments
- Gates Industrial Corp. Plc - Key offerings
- Gates Industrial Corp. Plc - Segment focus
- 12.8 Kanaflex Corp. Co. Ltd.
- Kanaflex Corp. Co. Ltd. - Overview
- Kanaflex Corp. Co. Ltd. - Product / Service
- Kanaflex Corp. Co. Ltd. - Key offerings
- 12.9 Kuriyama of America Inc.
- Kuriyama of America Inc. - Overview
- Kuriyama of America Inc. - Product / Service
- Kuriyama of America Inc. - Key offerings
- 12.10 Kurt Manufacturing
- Kurt Manufacturing - Overview
- Kurt Manufacturing - Product / Service
- Kurt Manufacturing - Key offerings
- 12.11 NORRES Schlauchtechnik GmbH
- NORRES Schlauchtechnik GmbH - Overview
- NORRES Schlauchtechnik GmbH - Product / Service
- NORRES Schlauchtechnik GmbH - Key offerings
- 12.12 Pacific Echo Inc.
- Pacific Echo Inc. - Overview
- Pacific Echo Inc. - Product / Service
- Pacific Echo Inc. - Key offerings
- 12.13 Parker Hannifin Corp.
- Parker Hannifin Corp. - Overview
- Parker Hannifin Corp. - Business segments
- Parker Hannifin Corp. - Key news
- Parker Hannifin Corp. - Key offerings
- Parker Hannifin Corp. - Segment focus
- 12.14 RYCO Hydraulics Pty Ltd.
- RYCO Hydraulics Pty Ltd. - Overview
- RYCO Hydraulics Pty Ltd. - Product / Service
- RYCO Hydraulics Pty Ltd. - Key offerings
- 12.15 Semperit AG Holding
- Semperit AG Holding - Overview
- Semperit AG Holding - Business segments
- Semperit AG Holding - Key news
- Semperit AG Holding - Key offerings
- Semperit AG Holding - Segment focus
- 12.16 Smiths Group Plc
- Smiths Group Plc - Overview
- Smiths Group Plc - Business segments
- Smiths Group Plc - Key news
- Smiths Group Plc - Key offerings
- Smiths Group Plc - Segment focus
- 12.17 Trelleborg AB
- Trelleborg AB - Overview
- Trelleborg AB - Business segments
- Trelleborg AB - Key news
- Trelleborg AB - Key offerings
- Trelleborg AB - Segment focus
13 Appendix
- 13.1 Scope of the report
- 13.2 Inclusions and exclusions checklist
- Inclusions checklist
- Exclusions checklist
- 13.3 Currency conversion rates for US$
- Currency conversion rates for US$
- 13.4 Research methodology
- Research methodology
- 13.5 Data procurement
- Information sources
- 13.6 Data validation
- Data validation
- 13.7 Validation techniques employed for market sizing
- Validation techniques employed for market sizing
- 13.8 Data synthesis
- Data synthesis
- 13.9 360 degree market analysis
- 360 degree market analysis
- 13.10 List of abbreviations
- List of abbreviations