|
시장보고서
상품코드
1544372
주입 펌프 시장(2024-2028년)Global Infusion Pump Market 2024-2028 |
||||||
주입 펌프 시장(2024-2028년)
주입 펌프 시장은 2023-2028년 49억 9,020만 달러로 예측되며 예측 기간 동안 6.78%의 CAGR로 성장할 것으로 예상됩니다. 이 보고서는 주입 펌프 시장의 전체 분석, 시장 규모와 예측, 동향, 성장 촉진요인, 과제, 약 25개 벤더에 대한 벤더 분석 등의 정보를 전해드립니다.
현재 시장 시나리오, 최신 동향 및 촉진요인, 전체 시장 환경에 대한 최신 분석을 제공합니다. 이 시장은 만성질환의 증가, 기업 간 인수합병, 벤더들의 R&D 투자 증가에 힘입어 성장하고 있습니다.
| 시장 범위 | |
|---|---|
| 기준 연도 | 2024년 |
| 종료 연도 | 2028년 |
| 예측 기간 | 2024-2028년 |
| 성장 모멘텀 | 가속 |
| 전년 대비[2024년] | 6.23% |
| CAGR | 6.78% |
| 증분 금액 | 49억 9,020만 달러 |
이 보고서는 향후 몇 년 동안 주입 펌프 시장 성장을 주도할 주요 요인 중 하나로 고급 주입 펌프에 대한 높은 수요를 꼽았습니다. 또한 의료 산업의 견조한 성장과 재택 의료 환경의 수요 증가는 시장의 큰 수요로 이어질 것입니다.
목차
제1장 주요 요약
- 시장 개요
제2장 시장 상황
- 시장 생태계
- 시장의 특징
- 밸류체인 분석
제3장 시장 규모 평가
- 시장 정의
- 시장 부문 분석
- 시장 규모 2023년
- 시장 전망 2023-2028년
제4장 시장 규모 실적
- 주입 펌프 세계 시장 2018-2022년
- 유형별 부문 분석 2018-2022년
- 최종사용자별 부문 분석 2018-2022년
- 지역별 부문 분석 2018-2022년
- 국가별 부문 분석 2018-2022년
제5장 Five Forces 분석
- Five Forces 요약
- 구매자의 교섭력
- 공급 기업의 교섭력
- 신규 참여업체의 위협
- 대체품의 위협
- 경쟁의 위협
- 시장 상황
제6장 시장 세분화 : 유형별
- 시장 세분화
- 비교 : 유형별
- 인슐린 펌프 : 시장 규모와 예측 2023-2028년
- 용적식 펌프 : 시장 규모와 예측 2023-2028년
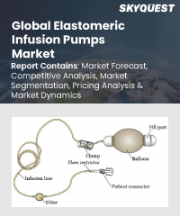
- 엘라스토머 펌프 : 시장 규모와 예측 2023-2028년
- 경장 펌프 : 시장 규모와 예측 2023-2028년
- 기타 : 시장 규모와 예측 2023-2028년
- 시장 기회 : 유형별
제7장 시장 세분화 : 최종사용자별
- 시장 세분화
- 비교 : 최종사용자별
- 병원 : 시장 규모와 예측 2023-2028년
- 외래 서비스 센터 : 시장 규모와 예측 2023-2028년
- 클리닉 : 시장 규모와 예측 2023-2028년
- 기타 : 시장 규모와 예측 2023-2028년
- 시장 기회 : 최종사용자별
제8장 고객 상황
- 고객 상황 개요
제9장 지역별 상황
- 지역별 세분화
- 비교 : 지역별
- 북미 : 시장 규모와 예측 2023-2028년
- 유럽 : 시장 규모와 예측 2023-2028년
- 아시아 : 시장 규모와 예측 2023-2028년
- 기타 : 시장 규모와 예측 2023-2028년
- 미국 : 시장 규모와 예측 2023-2028년
- 독일 : 시장 규모와 예측 2023-2028년
- 중국 : 시장 규모와 예측 2023-2028년
- 프랑스 : 시장 규모와 예측 2023-2028년
- 일본 : 시장 규모와 예측 2023-2028년
- 시장 기회 : 지역 상황별
제10장 촉진요인, 과제, 기회, 억제요인
- 시장 성장 촉진요인
- 시장 과제
- 성장 촉진요인과 과제의 영향
- 시장 기회·억제요인
제11장 경쟁 상황
- 개요
- 경쟁 상황
- 혼란 상황
- 업계 리스크
제12장 경쟁 분석
- 기업 개요
- 기업의 시장 포지셔닝
- ADOX SA
- Arcomed AG
- B.Braun SE
- Baxter International Inc.
- Becton Dickinson and Co.
- Beijing KellyMed Co. Ltd.
- CODAN ARGUS AG
- Digicare Biomedical Technology Inc.
- Eitan Medical Ltd.
- Flowonix Medical Inc.
- Fresenius SE and Co. KGaA
- ICU Medical Inc.
- IRadimed Corp.
- Medtronic Plc
- Nipro Corp.
제13장 부록
ksm 24.09.09Infusion Pump Market 2024-2028
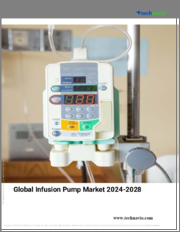
The infusion pump market is forecasted to grow by USD 4990.2 mn during 2023-2028, accelerating at a CAGR of 6.78% during the forecast period. The report on the infusion pump market provides a holistic analysis, market size and forecast, trends, growth drivers, and challenges, as well as vendor analysis covering around 25 vendors.
The report offers an up-to-date analysis regarding the current market scenario, the latest trends and drivers, and the overall market environment. The market is driven by increasing prevalence of chronic diseases, mergers and acquisitions among players, and increased investment by vendors in R and D.
| Market Scope | |
|---|---|
| Base Year | 2024 |
| End Year | 2028 |
| Series Year | 2024-2028 |
| Growth Momentum | Accelerate |
| YOY 2024 | 6.23% |
| CAGR | 6.78% |
| Incremental Value | $4990.2 mn |
Technavio's infusion pump market is segmented as below:
By Type
- Insulin pumps
- Volumetric pumps
- Elastomeric pumps
- Enteral pumps
- Others
By End-user
- Hospitals
- Ambulatory service centers
- Clinics
- Others
By Geographical Landscape
- North America
- Europe
- Asia
- Rest of World (ROW)
This study identifies the high demand for advanced infusion pump as one of the prime reasons driving the infusion pump market growth during the next few years. Also, robust growth of healthcare industry and increased home healthcare setting demand will lead to sizable demand in the market.
The report on the infusion pump market covers the following areas:
- Infusion pump market sizing
- Infusion pump market forecast
- Infusion pump market industry analysis
The robust vendor analysis is designed to help clients improve their market position, and in line with this, this report provides a detailed analysis of several leading infusion pump market vendors that include ADOX SA, Arcomed AG, B.Braun SE, Baxter International Inc., Becton Dickinson and Co., Beijing KellyMed Co. Ltd., CODAN ARGUS AG, Digicare Biomedical Technology Inc., Eitan Medical Ltd., Flowonix Medical Inc., Fresenius SE and Co. KGaA, ICU Medical Inc., IRadimed Corp., Medtronic PLC, Nipro Corp., Shenzhen Mindray BioMedical Electronics Co. Ltd, Silverline meditech Pvt. Ltd., Terumo Corp., vTitan Corp. Pvt Ltd., and Zyno Medical. Also, the infusion pump market analysis report includes information on upcoming trends and challenges that will influence market growth. This is to help companies strategize and leverage all forthcoming growth opportunities.
The study was conducted using an objective combination of primary and secondary information including inputs from key participants in the industry. The report contains a comprehensive market and vendor landscape in addition to an analysis of the key vendors.
The publisher presents a detailed picture of the market by the way of study, synthesis, and summation of data from multiple sources by an analysis of key parameters such as profit, pricing, competition, and promotions. It presents various market facets by identifying the key industry influencers. The data presented is comprehensive, reliable, and a result of extensive research - both primary and secondary. The market research reports provide a complete competitive landscape and an in-depth vendor selection methodology and analysis using qualitative and quantitative research to forecast the accurate market growth.
Table of Contents
1 Executive Summary
- 1.1 Market overview
- Executive Summary - Chart on Market Overview
- Executive Summary - Data Table on Market Overview
- Executive Summary - Chart on Global Market Characteristics
- Executive Summary - Chart on Market By Geographical Landscape
- Executive Summary - Chart on Market Segmentation by Type
- Executive Summary - Chart on Market Segmentation by End-user
- Executive Summary - Chart on Incremental Growth
- Executive Summary - Data Table on Incremental Growth
- Executive Summary - Chart on Company Market Positioning
2 Market Landscape
- 2.1 Market ecosystem
- Parent Market
- Data Table on - Parent Market
- 2.2 Market characteristics
- Market characteristics analysis
- 2.3 Value chain analysis
- Value Chain Analysis
3 Market Sizing
- 3.1 Market definition
- Offerings of companies included in the market definition
- 3.2 Market segment analysis
- Market segments
- 3.3 Market size 2023
- 3.4 Market outlook: Forecast for 2023-2028
- Chart on Global - Market size and forecast 2023-2028 ($ million)
- Data Table on Global - Market size and forecast 2023-2028 ($ million)
- Chart on Global Market: Year-over-year growth 2023-2028 (%)
- Data Table on Global Market: Year-over-year growth 2023-2028 (%)
4 Historic Market Size
- 4.1 Global Infusion Pump Market 2018 - 2022
- Historic Market Size - Data Table on Global Infusion Pump Market 2018 - 2022 ($ million)
- 4.2 Type segment analysis 2018 - 2022
- Historic Market Size - Type Segment 2018 - 2022 ($ million)
- 4.3 End-user segment analysis 2018 - 2022
- Historic Market Size - End-user Segment 2018 - 2022 ($ million)
- 4.4 Geography segment analysis 2018 - 2022
- Historic Market Size - Geography Segment 2018 - 2022 ($ million)
- 4.5 Country segment analysis 2018 - 2022
- Historic Market Size - Country Segment 2018 - 2022 ($ million)
5 Five Forces Analysis
- 5.1 Five forces summary
- Five forces analysis - Comparison between 2023 and 2028
- 5.2 Bargaining power of buyers
- Bargaining power of buyers - Impact of key factors 2023 and 2028
- 5.3 Bargaining power of suppliers
- Bargaining power of suppliers - Impact of key factors in 2023 and 2028
- 5.4 Threat of new entrants
- Threat of new entrants - Impact of key factors in 2023 and 2028
- 5.5 Threat of substitutes
- Threat of substitutes - Impact of key factors in 2023 and 2028
- 5.6 Threat of rivalry
- Threat of rivalry - Impact of key factors in 2023 and 2028
- 5.7 Market condition
- Chart on Market condition - Five forces 2023 and 2028
6 Market Segmentation by Type
- 6.1 Market segments
- Chart on Type - Market share 2023-2028 (%)
- Data Table on Type - Market share 2023-2028 (%)
- 6.2 Comparison by Type
- Chart on Comparison by Type
- Data Table on Comparison by Type
- 6.3 Insulin pumps - Market size and forecast 2023-2028
- Chart on Insulin pumps - Market size and forecast 2023-2028 ($ million)
- Data Table on Insulin pumps - Market size and forecast 2023-2028 ($ million)
- Chart on Insulin pumps - Year-over-year growth 2023-2028 (%)
- Data Table on Insulin pumps - Year-over-year growth 2023-2028 (%)
- 6.4 Volumetric pumps - Market size and forecast 2023-2028
- Chart on Volumetric pumps - Market size and forecast 2023-2028 ($ million)
- Data Table on Volumetric pumps - Market size and forecast 2023-2028 ($ million)
- Chart on Volumetric pumps - Year-over-year growth 2023-2028 (%)
- Data Table on Volumetric pumps - Year-over-year growth 2023-2028 (%)
- 6.5 Elastomeric pumps - Market size and forecast 2023-2028
- Chart on Elastomeric pumps - Market size and forecast 2023-2028 ($ million)
- Data Table on Elastomeric pumps - Market size and forecast 2023-2028 ($ million)
- Chart on Elastomeric pumps - Year-over-year growth 2023-2028 (%)
- Data Table on Elastomeric pumps - Year-over-year growth 2023-2028 (%)
- 6.6 Enteral pumps - Market size and forecast 2023-2028
- Chart on Enteral pumps - Market size and forecast 2023-2028 ($ million)
- Data Table on Enteral pumps - Market size and forecast 2023-2028 ($ million)
- Chart on Enteral pumps - Year-over-year growth 2023-2028 (%)
- Data Table on Enteral pumps - Year-over-year growth 2023-2028 (%)
- 6.7 Others - Market size and forecast 2023-2028
- Chart on Others - Market size and forecast 2023-2028 ($ million)
- Data Table on Others - Market size and forecast 2023-2028 ($ million)
- Chart on Others - Year-over-year growth 2023-2028 (%)
- Data Table on Others - Year-over-year growth 2023-2028 (%)
- 6.8 Market opportunity by Type
- Market opportunity by Type ($ million)
- Data Table on Market opportunity by Type ($ million)
7 Market Segmentation by End-user
- 7.1 Market segments
- Chart on End-user - Market share 2023-2028 (%)
- Data Table on End-user - Market share 2023-2028 (%)
- 7.2 Comparison by End-user
- Chart on Comparison by End-user
- Data Table on Comparison by End-user
- 7.3 Hospitals - Market size and forecast 2023-2028
- Chart on Hospitals - Market size and forecast 2023-2028 ($ million)
- Data Table on Hospitals - Market size and forecast 2023-2028 ($ million)
- Chart on Hospitals - Year-over-year growth 2023-2028 (%)
- Data Table on Hospitals - Year-over-year growth 2023-2028 (%)
- 7.4 Ambulatory service centers - Market size and forecast 2023-2028
- Chart on Ambulatory service centers - Market size and forecast 2023-2028 ($ million)
- Data Table on Ambulatory service centers - Market size and forecast 2023-2028 ($ million)
- Chart on Ambulatory service centers - Year-over-year growth 2023-2028 (%)
- Data Table on Ambulatory service centers - Year-over-year growth 2023-2028 (%)
- 7.5 Clinics - Market size and forecast 2023-2028
- Chart on Clinics - Market size and forecast 2023-2028 ($ million)
- Data Table on Clinics - Market size and forecast 2023-2028 ($ million)
- Chart on Clinics - Year-over-year growth 2023-2028 (%)
- Data Table on Clinics - Year-over-year growth 2023-2028 (%)
- 7.6 Others - Market size and forecast 2023-2028
- Chart on Others - Market size and forecast 2023-2028 ($ million)
- Data Table on Others - Market size and forecast 2023-2028 ($ million)
- Chart on Others - Year-over-year growth 2023-2028 (%)
- Data Table on Others - Year-over-year growth 2023-2028 (%)
- 7.7 Market opportunity by End-user
- Market opportunity by End-user ($ million)
- Data Table on Market opportunity by End-user ($ million)
8 Customer Landscape
- 8.1 Customer landscape overview
- Analysis of price sensitivity, lifecycle, customer purchase basket, adoption rates, and purchase criteria
9 Geographic Landscape
- 9.1 Geographic segmentation
- Chart on Market share By Geographical Landscape 2023-2028 (%)
- Data Table on Market share By Geographical Landscape 2023-2028 (%)
- 9.2 Geographic comparison
- Chart on Geographic comparison
- Data Table on Geographic comparison
- 9.3 North America - Market size and forecast 2023-2028
- Chart on North America - Market size and forecast 2023-2028 ($ million)
- Data Table on North America - Market size and forecast 2023-2028 ($ million)
- Chart on North America - Year-over-year growth 2023-2028 (%)
- Data Table on North America - Year-over-year growth 2023-2028 (%)
- 9.4 Europe - Market size and forecast 2023-2028
- Chart on Europe - Market size and forecast 2023-2028 ($ million)
- Data Table on Europe - Market size and forecast 2023-2028 ($ million)
- Chart on Europe - Year-over-year growth 2023-2028 (%)
- Data Table on Europe - Year-over-year growth 2023-2028 (%)
- 9.5 Asia - Market size and forecast 2023-2028
- Chart on Asia - Market size and forecast 2023-2028 ($ million)
- Data Table on Asia - Market size and forecast 2023-2028 ($ million)
- Chart on Asia - Year-over-year growth 2023-2028 (%)
- Data Table on Asia - Year-over-year growth 2023-2028 (%)
- 9.6 Rest of World (ROW) - Market size and forecast 2023-2028
- Chart on Rest of World (ROW) - Market size and forecast 2023-2028 ($ million)
- Data Table on Rest of World (ROW) - Market size and forecast 2023-2028 ($ million)
- Chart on Rest of World (ROW) - Year-over-year growth 2023-2028 (%)
- Data Table on Rest of World (ROW) - Year-over-year growth 2023-2028 (%)
- 9.7 US - Market size and forecast 2023-2028
- Chart on US - Market size and forecast 2023-2028 ($ million)
- Data Table on US - Market size and forecast 2023-2028 ($ million)
- Chart on US - Year-over-year growth 2023-2028 (%)
- Data Table on US - Year-over-year growth 2023-2028 (%)
- 9.8 Germany - Market size and forecast 2023-2028
- Chart on Germany - Market size and forecast 2023-2028 ($ million)
- Data Table on Germany - Market size and forecast 2023-2028 ($ million)
- Chart on Germany - Year-over-year growth 2023-2028 (%)
- Data Table on Germany - Year-over-year growth 2023-2028 (%)
- 9.9 China - Market size and forecast 2023-2028
- Chart on China - Market size and forecast 2023-2028 ($ million)
- Data Table on China - Market size and forecast 2023-2028 ($ million)
- Chart on China - Year-over-year growth 2023-2028 (%)
- Data Table on China - Year-over-year growth 2023-2028 (%)
- 9.10 France - Market size and forecast 2023-2028
- Chart on France - Market size and forecast 2023-2028 ($ million)
- Data Table on France - Market size and forecast 2023-2028 ($ million)
- Chart on France - Year-over-year growth 2023-2028 (%)
- Data Table on France - Year-over-year growth 2023-2028 (%)
- 9.11 Japan - Market size and forecast 2023-2028
- Chart on Japan - Market size and forecast 2023-2028 ($ million)
- Data Table on Japan - Market size and forecast 2023-2028 ($ million)
- Chart on Japan - Year-over-year growth 2023-2028 (%)
- Data Table on Japan - Year-over-year growth 2023-2028 (%)
- 9.12 Market opportunity By Geographical Landscape
- Market opportunity By Geographical Landscape ($ million)
- Data Tables on Market opportunity By Geographical Landscape ($ million)
10 Drivers, Challenges, and Opportunity/Restraints
- 10.1 Market drivers
- 10.2 Market challenges
- 10.3 Impact of drivers and challenges
- Impact of drivers and challenges in 2023 and 2028
- 10.4 Market opportunities/restraints
11 Competitive Landscape
- 11.1 Overview
- 11.2 Competitive Landscape
- Overview on criticality of inputs and factors of differentiation
- 11.3 Landscape disruption
- Overview on factors of disruption
- 11.4 Industry risks
- Impact of key risks on business
12 Competitive Analysis
- 12.1 Companies profiled
- Companies covered
- 12.2 Market positioning of companies
- Matrix on companies position and classification
- 12.3 ADOX SA
- ADOX SA - Overview
- ADOX SA - Product / Service
- ADOX SA - Key offerings
- 12.4 Arcomed AG
- Arcomed AG - Overview
- Arcomed AG - Product / Service
- Arcomed AG - Key offerings
- 12.5 B.Braun SE
- B.Braun SE - Overview
- B.Braun SE - Business segments
- B.Braun SE - Key news
- B.Braun SE - Key offerings
- B.Braun SE - Segment focus
- 12.6 Baxter International Inc.
- Baxter International Inc. - Overview
- Baxter International Inc. - Business segments
- Baxter International Inc. - Key news
- Baxter International Inc. - Key offerings
- Baxter International Inc. - Segment focus
- 12.7 Becton Dickinson and Co.
- Becton Dickinson and Co. - Overview
- Becton Dickinson and Co. - Business segments
- Becton Dickinson and Co. - Key news
- Becton Dickinson and Co. - Key offerings
- Becton Dickinson and Co. - Segment focus
- 12.8 Beijing KellyMed Co. Ltd.
- Beijing KellyMed Co. Ltd. - Overview
- Beijing KellyMed Co. Ltd. - Product / Service
- Beijing KellyMed Co. Ltd. - Key offerings
- 12.9 CODAN ARGUS AG
- CODAN ARGUS AG - Overview
- CODAN ARGUS AG - Product / Service
- CODAN ARGUS AG - Key offerings
- 12.10 Digicare Biomedical Technology Inc.
- Digicare Biomedical Technology Inc. - Overview
- Digicare Biomedical Technology Inc. - Product / Service
- Digicare Biomedical Technology Inc. - Key offerings
- 12.11 Eitan Medical Ltd.
- Eitan Medical Ltd. - Overview
- Eitan Medical Ltd. - Product / Service
- Eitan Medical Ltd. - Key offerings
- 12.12 Flowonix Medical Inc.
- Flowonix Medical Inc. - Overview
- Flowonix Medical Inc. - Product / Service
- Flowonix Medical Inc. - Key offerings
- 12.13 Fresenius SE and Co. KGaA
- Fresenius SE and Co. KGaA - Overview
- Fresenius SE and Co. KGaA - Business segments
- Fresenius SE and Co. KGaA - Key news
- Fresenius SE and Co. KGaA - Key offerings
- Fresenius SE and Co. KGaA - Segment focus
- 12.14 ICU Medical Inc.
- ICU Medical Inc. - Overview
- ICU Medical Inc. - Product / Service
- ICU Medical Inc. - Key offerings
- 12.15 IRadimed Corp.
- IRadimed Corp. - Overview
- IRadimed Corp. - Product / Service
- IRadimed Corp. - Key offerings
- 12.16 Medtronic Plc
- Medtronic Plc - Overview
- Medtronic Plc - Business segments
- Medtronic Plc - Key news
- Medtronic Plc - Key offerings
- Medtronic Plc - Segment focus
- 12.17 Nipro Corp.
- Nipro Corp. - Overview
- Nipro Corp. - Business segments
- Nipro Corp. - Key offerings
- Nipro Corp. - Segment focus
13 Appendix
- 13.1 Scope of the report
- 13.2 Inclusions and exclusions checklist
- Inclusions checklist
- Exclusions checklist
- 13.3 Currency conversion rates for US$
- Currency conversion rates for US$
- 13.4 Research methodology
- Research methodology
- 13.5 Data procurement
- Information sources
- 13.6 Data validation
- Data validation
- 13.7 Validation techniques employed for market sizing
- Validation techniques employed for market sizing
- 13.8 Data synthesis
- Data synthesis
- 360 degree market analysis
- 360 degree market analysis
- 13.10 List of abbreviations
- List of abbreviations