|
시장보고서
상품코드
1580800
퓨어 플레이 소프트웨어 테스트 서비스 시장(2024-2028년)Global Pure Play Software Testing Services Market 2024-2028 |
||||||
퓨어 플레이 소프트웨어 테스트 서비스 시장, 2024-2028년
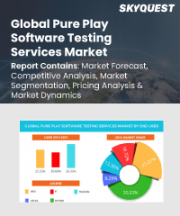
퓨어 플레이 소프트웨어 테스트 서비스 시장은 2023-2028년에 135억 1,060만 달러, 예측 기간 중 CAGR은 14.8%로 성장할 것으로 예측됩니다. 퓨어 플레이 소프트웨어 테스트 서비스 시장의 전체적인 분석, 시장 규모·예측, 동향, 성장 촉진요인, 과제, 약 25개 벤더를 다룬 벤더 분석 등을 게재하고 있습니다.
현재 시장 시나리오, 최신 동향과 촉진요인, 시장 환경 전체에 관한 최신 분석을 제공하고 있습니다. 업계 특화형 테스트 서비스 제공의 이용 증가, 애자일 테스트와 테스트 자동화 서비스의 급속한 도입, 모바일 애플리케이션 테스트의 채택 증가 등이 시장을 촉진하고 있습니다.
| 시장 범위 | |
|---|---|
| 기준년 | 2024년 |
| 종료년 | 2028년 |
| 예측 기간 | 2024-2028년 |
| 성장 모멘텀 | 가속 |
| 전년대비[2024년] | 12.6% |
| CAGR | 14.8% |
| 증분액 | 135억 1,060만 달러 |
본 조사에서는 향후 수년간 퓨어 플레이 소프트웨어 테스트 서비스 시장의 성장을 촉진하는 주요 이유의 하나로 빅데이터와 IoT 대응 기술 테스트의 보급을 들고 있습니다. 또한 byod 컨셉의 채택 증가와 Devops의 출현은 시장의 큰 수요로 연결됩니다.
목차
제1장 개요
- 시장 개요
제2장 시장 구도
- 시장 에코시스템
- 시장의 특징
- 밸류체인 분석
제3장 시장 규모의 평가
- 시장의 정의
- 시장 부문 분석
- 시장 규모 2023년
- 시장의 전망 2023-2028년
제4장 시장 규모 실적
- 세계의 퓨어 플레이 소프트웨어 테스트 서비스 시장 2018-2022년
- 최종사용자별 부문 분석 2018-2022년
- 지역별 부문 분석 2018-2022년
- 국가별 부문 분석 2018-2022년
제5장 Five Forces 분석
- Five Forces 요약
- 바이어의 교섭력
- 공급 기업의 교섭력
- 신규 진출업체의 위협
- 대체품의 위협
- 경쟁의 위협
- 시장 현황
제6장 시장 세분화 : 최종사용자별
- 시장 세분화
- 비교 : 최종사용자별
- BFSI : 시장 규모와 예측 2023-2028년
- 그것 : 시장 규모와 예측 2023-2028년
- 통신 : 시장 규모와 예측 2023-2028년
- 소매 : 시장 규모와 예측 2023-2028년
- 기타 : 시장 규모와 예측 2023-2028년
- 최종사용자별 시장 기회
제7장 고객 상황
- 고객 상황 개요
제8장 지역별 상황
- 지역별 세분화
- 비교 : 지역별
- 북미 : 시장 규모와 예측 2023-2028년
- 유럽 : 시장 규모와 예측 2023-2028년
- 아시아태평양 : 시장 규모와 예측 2023-2028년
- 남미 : 시장 규모와 예측 2023-2028년
- 중동 및 아프리카 : 시장 규모와 예측 2023-2028년
- 미국 : 시장 규모와 예측 2023-2028년
- 인도 : 시장 규모와 예측 2023-2028년
- 중국 : 시장 규모와 예측 2023-2028년
- 영국 : 시장 규모와 예측 2023-2028년
- 독일 : 시장 규모와 예측 2023-2028년
- 지역 상황별 시장 기회
제9장 촉진요인·과제·기회·억제요인
- 시장 성장 촉진요인
- 시장이 해결해야 할 과제
- 촉진요인과 과제의 영향
- 시장의 기회·억제요인
제10장 경쟁 구도
- 개요
- 경쟁 구도
- 혼란 상황
- 업계의 리스크
제11장 경쟁 분석
- 기업 개요
- 기업의 시장 포지셔닝
- a1qa software testing co.
- Acial
- Cigniti Technologies Ltd.
- Expleo Group SAS
- imbus AG
- Methods and Technology of Systems and Processes SL
- Nomura Research Institute
- QualiTest Group
- Trigent Software Inc.
- ZenQ
제12장 부록
KSA 24.11.04Pure Play Software Testing Services Market 2024-2028
The pure play software testing services market is forecasted to grow by USD 13510.6 mn during 2023-2028, accelerating at a CAGR of 14.8% during the forecast period. The report on the pure play software testing services market provides a holistic analysis, market size and forecast, trends, growth drivers, and challenges, as well as vendor analysis covering around 25 vendors.
The report offers an up-to-date analysis regarding the current market scenario, the latest trends and drivers, and the overall market environment. The market is driven by increased use of industry-specific testing service offerings, rapid implementation of agile testing and test automation services, and increasing adoption of mobile application testing.
| Market Scope | |
|---|---|
| Base Year | 2024 |
| End Year | 2028 |
| Series Year | 2024-2028 |
| Growth Momentum | Accelerate |
| YOY 2024 | 12.6% |
| CAGR | 14.8% |
| Incremental Value | $13510.6 mn |
Technavio's pure play software testing services market is segmented as below:
By End-user
- BFSI
- IT
- Telecom
- Retail
- Others
By Geographical Landscape
- North America
- Europe
- APAC
- South America
- Middle East and Africa
This study identifies the proliferation of big data- and iot-enabled technology testing as one of the prime reasons driving the pure play software testing services market growth during the next few years. Also, increased adoption of byod concept and emergence of devops will lead to sizable demand in the market.
The report on the pure play software testing services market covers the following areas:
- Pure Play Software Testing Services Market sizing
- Pure Play Software Testing Services Market forecast
- Pure Play Software Testing Services Market industry analysis
The robust vendor analysis is designed to help clients improve their market position, and in line with this, this report provides a detailed analysis of several leading pure play software testing services market vendors that include a1qa software testing co., Acial, Astegic Inc., Cigniti Technologies Ltd., Expleo Group SAS, Fraunhofer Institute for Experimental Software Engineering IESE, imbus AG, Methods and Technology of Systems and Processes SL, Nomura Research Institute, QualiTest Group, QualiTlabs LLC, Quality Area Ltd., Real Time Technology Solutions Inc., ScienceSoft USA Corp., tapQA, Tesnet Group, TestingXperts, Trigent Software Inc., and ZenQ. Also, the pure play software testing services market analysis report includes information on upcoming trends and challenges that will influence market growth. This is to help companies strategize and leverage all forthcoming growth opportunities.
The study was conducted using an objective combination of primary and secondary information including inputs from key participants in the industry. The report contains a comprehensive market and vendor landscape in addition to an analysis of the key vendors.
The publisher presents a detailed picture of the market by the way of study, synthesis, and summation of data from multiple sources by an analysis of key parameters such as profit, pricing, competition, and promotions. It presents various market facets by identifying the key industry influencers. The data presented is comprehensive, reliable, and a result of extensive primary and secondary research. The market research reports provide a complete competitive landscape and an in-depth vendor selection methodology and analysis using qualitative and quantitative research to forecast accurate market growth.
Table of Contents
1 Executive Summary
- 1.1 Market overview
- Executive Summary - Chart on Market Overview
- Executive Summary - Data Table on Market Overview
- Executive Summary - Chart on Global Market Characteristics
- Executive Summary - Chart on Market By Geographical Landscape
- Executive Summary - Chart on Market Segmentation by End-user
- Executive Summary - Chart on Incremental Growth
- Executive Summary - Data Table on Incremental Growth
- Executive Summary - Chart on Company Market Positioning
2 Market Landscape
- 2.1 Market ecosystem
- Parent Market
- Data Table on - Parent Market
- 2.2 Market characteristics
- Market characteristics analysis
- 2.3 Value chain analysis
- Value Chain Analysis
3 Market Sizing
- 3.1 Market definition
- Offerings of companies included in the market definition
- 3.2 Market segment analysis
- Market segments
- 3.3 Market size 2023
- 3.4 Market outlook: Forecast for 2023-2028
- Chart on Global - Market size and forecast 2023-2028 ($ million)
- Data Table on Global - Market size and forecast 2023-2028 ($ million)
- Chart on Global Market: Year-over-year growth 2023-2028 (%)
- Data Table on Global Market: Year-over-year growth 2023-2028 (%)
4 Historic Market Size
- 4.1 Global Pure Play Software Testing Services Market 2018 - 2022
- Historic Market Size - Data Table on Global Pure Play Software Testing Services Market 2018 - 2022 ($ million)
- 4.2 End-user segment analysis 2018 - 2022
- Historic Market Size - End-user Segment 2018 - 2022 ($ million)
- 4.3 Geography segment analysis 2018 - 2022
- Historic Market Size - Geography Segment 2018 - 2022 ($ million)
- 4.4 Country segment analysis 2018 - 2022
- Historic Market Size - Country Segment 2018 - 2022 ($ million)
5 Five Forces Analysis
- 5.1 Five forces summary
- Five forces analysis - Comparison between 2023 and 2028
- 5.2 Bargaining power of buyers
- Bargaining power of buyers - Impact of key factors 2023 and 2028
- 5.3 Bargaining power of suppliers
- Bargaining power of suppliers - Impact of key factors in 2023 and 2028
- 5.4 Threat of new entrants
- Threat of new entrants - Impact of key factors in 2023 and 2028
- 5.5 Threat of substitutes
- Threat of substitutes - Impact of key factors in 2023 and 2028
- 5.6 Threat of rivalry
- Threat of rivalry - Impact of key factors in 2023 and 2028
- 5.7 Market condition
- Chart on Market condition - Five forces 2023 and 2028
6 Market Segmentation by End-user
- 6.1 Market segments
- Chart on End-user - Market share 2023-2028 (%)
- Data Table on End-user - Market share 2023-2028 (%)
- 6.2 Comparison by End-user
- Chart on Comparison by End-user
- Data Table on Comparison by End-user
- 6.3 BFSI - Market size and forecast 2023-2028
- Chart on BFSI - Market size and forecast 2023-2028 ($ million)
- Data Table on BFSI - Market size and forecast 2023-2028 ($ million)
- Chart on BFSI - Year-over-year growth 2023-2028 (%)
- Data Table on BFSI - Year-over-year growth 2023-2028 (%)
- 6.4 IT - Market size and forecast 2023-2028
- Chart on IT - Market size and forecast 2023-2028 ($ million)
- Data Table on IT - Market size and forecast 2023-2028 ($ million)
- Chart on IT - Year-over-year growth 2023-2028 (%)
- Data Table on IT - Year-over-year growth 2023-2028 (%)
- 6.5 Telecom - Market size and forecast 2023-2028
- Chart on Telecom - Market size and forecast 2023-2028 ($ million)
- Data Table on Telecom - Market size and forecast 2023-2028 ($ million)
- Chart on Telecom - Year-over-year growth 2023-2028 (%)
- Data Table on Telecom - Year-over-year growth 2023-2028 (%)
- 6.6 Retail - Market size and forecast 2023-2028
- Chart on Retail - Market size and forecast 2023-2028 ($ million)
- Data Table on Retail - Market size and forecast 2023-2028 ($ million)
- Chart on Retail - Year-over-year growth 2023-2028 (%)
- Data Table on Retail - Year-over-year growth 2023-2028 (%)
- 6.7 Others - Market size and forecast 2023-2028
- Chart on Others - Market size and forecast 2023-2028 ($ million)
- Data Table on Others - Market size and forecast 2023-2028 ($ million)
- Chart on Others - Year-over-year growth 2023-2028 (%)
- Data Table on Others - Year-over-year growth 2023-2028 (%)
- 6.8 Market opportunity by End-user
- Market opportunity by End-user ($ million)
- Data Table on Market opportunity by End-user ($ million)
7 Customer Landscape
- 7.1 Customer landscape overview
- Analysis of price sensitivity, lifecycle, customer purchase basket, adoption rates, and purchase criteria
8 Geographic Landscape
- 8.1 Geographic segmentation
- Chart on Market share By Geographical Landscape 2023-2028 (%)
- Data Table on Market share By Geographical Landscape 2023-2028 (%)
- 8.2 Geographic comparison
- Chart on Geographic comparison
- Data Table on Geographic comparison
- 8.3 North America - Market size and forecast 2023-2028
- Chart on North America - Market size and forecast 2023-2028 ($ million)
- Data Table on North America - Market size and forecast 2023-2028 ($ million)
- Chart on North America - Year-over-year growth 2023-2028 (%)
- Data Table on North America - Year-over-year growth 2023-2028 (%)
- 8.4 Europe - Market size and forecast 2023-2028
- Chart on Europe - Market size and forecast 2023-2028 ($ million)
- Data Table on Europe - Market size and forecast 2023-2028 ($ million)
- Chart on Europe - Year-over-year growth 2023-2028 (%)
- Data Table on Europe - Year-over-year growth 2023-2028 (%)
- 8.5 APAC - Market size and forecast 2023-2028
- Chart on APAC - Market size and forecast 2023-2028 ($ million)
- Data Table on APAC - Market size and forecast 2023-2028 ($ million)
- Chart on APAC - Year-over-year growth 2023-2028 (%)
- Data Table on APAC - Year-over-year growth 2023-2028 (%)
- 8.6 South America - Market size and forecast 2023-2028
- Chart on South America - Market size and forecast 2023-2028 ($ million)
- Data Table on South America - Market size and forecast 2023-2028 ($ million)
- Chart on South America - Year-over-year growth 2023-2028 (%)
- Data Table on South America - Year-over-year growth 2023-2028 (%)
- 8.7 Middle East and Africa - Market size and forecast 2023-2028
- Chart on Middle East and Africa - Market size and forecast 2023-2028 ($ million)
- Data Table on Middle East and Africa - Market size and forecast 2023-2028 ($ million)
- Chart on Middle East and Africa - Year-over-year growth 2023-2028 (%)
- Data Table on Middle East and Africa - Year-over-year growth 2023-2028 (%)
- 8.8 US - Market size and forecast 2023-2028
- Chart on US - Market size and forecast 2023-2028 ($ million)
- Data Table on US - Market size and forecast 2023-2028 ($ million)
- Chart on US - Year-over-year growth 2023-2028 (%)
- Data Table on US - Year-over-year growth 2023-2028 (%)
- 8.9 India - Market size and forecast 2023-2028
- Chart on India - Market size and forecast 2023-2028 ($ million)
- Data Table on India - Market size and forecast 2023-2028 ($ million)
- Chart on India - Year-over-year growth 2023-2028 (%)
- Data Table on India - Year-over-year growth 2023-2028 (%)
- 8.10 China - Market size and forecast 2023-2028
- Chart on China - Market size and forecast 2023-2028 ($ million)
- Data Table on China - Market size and forecast 2023-2028 ($ million)
- Chart on China - Year-over-year growth 2023-2028 (%)
- Data Table on China - Year-over-year growth 2023-2028 (%)
- 8.11 UK - Market size and forecast 2023-2028
- Chart on UK - Market size and forecast 2023-2028 ($ million)
- Data Table on UK - Market size and forecast 2023-2028 ($ million)
- Chart on UK - Year-over-year growth 2023-2028 (%)
- Data Table on UK - Year-over-year growth 2023-2028 (%)
- 8.12 Germany - Market size and forecast 2023-2028
- Chart on Germany - Market size and forecast 2023-2028 ($ million)
- Data Table on Germany - Market size and forecast 2023-2028 ($ million)
- Chart on Germany - Year-over-year growth 2023-2028 (%)
- Data Table on Germany - Year-over-year growth 2023-2028 (%)
- 8.13 Market opportunity By Geographical Landscape
- Market opportunity By Geographical Landscape ($ million)
- Data Tables on Market opportunity By Geographical Landscape ($ million)
9 Drivers, Challenges, and Opportunity/Restraints
- 9.1 Market drivers
- 9.2 Market challenges
- 9.3 Impact of drivers and challenges
- Impact of drivers and challenges in 2023 and 2028
- 9.4 Market opportunities/restraints
10 Competitive Landscape
- 10.1 Overview
- 10.2 Competitive Landscape
- Overview on criticality of inputs and factors of differentiation
- 10.3 Landscape disruption
- Overview on factors of disruption
- 10.4 Industry risks
- Impact of key risks on business
11 Competitive Analysis
- 11.1 Companies profiled
- Companies covered
- 11.2 Market positioning of companies
- Matrix on companies position and classification
- 11.3 a1qa software testing co.
- a1qa software testing co. - Overview
- a1qa software testing co. - Product / Service
- a1qa software testing co. - Key offerings
- 11.4 Acial
- Acial - Overview
- Acial - Product / Service
- Acial - Key offerings
- 11.5 Cigniti Technologies Ltd.
- Cigniti Technologies Ltd. - Overview
- Cigniti Technologies Ltd. - Product / Service
- Cigniti Technologies Ltd. - Key offerings
- 11.6 Expleo Group SAS
- Expleo Group SAS - Overview
- Expleo Group SAS - Product / Service
- Expleo Group SAS - Key offerings
- 11.7 imbus AG
- imbus AG - Overview
- imbus AG - Product / Service
- imbus AG - Key offerings
- 11.8 Methods and Technology of Systems and Processes SL
- Methods and Technology of Systems and Processes SL - Overview
- Methods and Technology of Systems and Processes SL - Product / Service
- Methods and Technology of Systems and Processes SL - Key offerings
- 11.9 Nomura Research Institute
- Nomura Research Institute - Overview
- Nomura Research Institute - Product / Service
- Nomura Research Institute - Key offerings
- 11.10 QualiTest Group
- QualiTest Group - Overview
- QualiTest Group - Product / Service
- QualiTest Group - Key offerings
- 11.11 Trigent Software Inc.
- Trigent Software Inc. - Overview
- Trigent Software Inc. - Product / Service
- Trigent Software Inc. - Key offerings
- 11.12 ZenQ
- ZenQ - Overview
- ZenQ - Product / Service
- ZenQ - Key offerings
12 Appendix
- 12.1 Scope of the report
- 12.2 Inclusions and exclusions checklist
- Inclusions checklist
- Exclusions checklist
- 12.3 Currency conversion rates for US$
- Currency conversion rates for US$
- 12.4 Research methodology
- Research methodology
- 12.5 Data procurement
- Information sources
- 12.6 Data validation
- Data validation
- 12.7 Validation techniques employed for market sizing
- Validation techniques employed for market sizing
- 12.8 Data synthesis
- Data synthesis
- 12.9 360 degree market analysis
- 360 degree market analysis
- 12.10 List of abbreviations
- List of abbreviations