|
시장보고서
상품코드
1911000
백내장 수술 기기 시장(2026-2030년)Global Cataract Surgery Devices Market 2026-2030 |
||||||
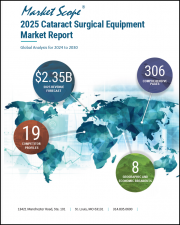
세계의 백내장 수술 기기 시장은 2025년부터 2030년까지 26억 3,790만 달러 증가하고, 예측 기간 동안 CAGR은 6.5%로 예측됩니다.
세계의 백내장 수술 기기 시장에 관한 종합적인 분석, 시장 규모와 예측, 동향, 성장 촉진요인, 과제 및 약 25개 벤더 분석을 제공합니다.
본 보고서는 현재 시장 상황, 최신 동향 및 촉진요인, 시장 환경 전반에 대한 최신 분석을 제공합니다. 시장은 백내장 유병률 증가와 고령 인구 증가, 백내장 수술 기기의 기술 발전, 백내장 수술 건수 증가에 의해 주도되고 있습니다.
이번 조사는 업계 주요 관계자들의 정보를 포함한 1차 정보와 2차 정보의 객관적인 조합을 통해 이루어졌습니다. 이 보고서에는 주요 기업 분석과 함께 종합적인 시장 규모 데이터, 지역별 분석과 함께 부문 및 공급업체 현황이 포함되어 있습니다. 보고서에는 과거 데이터와 예측 데이터가 수록되어 있습니다.
| 시장 범위 | |
|---|---|
| 기준 연도 | 2026년 |
| 종료 연도 | 2030년 |
| 예측 기간 | 2026-2030년 |
| 성장 모멘텀 | 가속 |
| 전년비 2026년 | 6.1% |
| CAGR | 6.5% |
| 증가액 | 26억 3,790만 달러 |
이 보고서는 저비용 백내장 수술을 목적으로 하는 의료관광의 증가가 향후 몇 년 동안 세계 백내장 수술 기기 시장의 성장을 견인하는 주요 요인 중 하나로 꼽고 있습니다. 또한, 신흥 시장에서의 백내장 수술에 대한 접근성 확대와 첨단 고품질 인공수정체 보급은 시장에서 상당한 수요를 창출할 것으로 예상됩니다.
목차
제1장 주요 요약
- 시장 개요
제2장 Technavio 분석
- 가격·수명주기·고객 구입 바스켓·채용률·구입 기준 분석
- 인풋의 중요성과 차별화 요인
- 혼란 요인
- 성장 촉진요인과 과제의 영향
제3장 시장 구도
- 시장 생태계
- 시장 특징
- 밸류체인 분석
제4장 시장 규모
- 시장 정의
- 시장 부문 분석
- 시장 규모 2025
- 시장 전망 2025-2030
제5장 시장 규모 실적
- 세계의 백내장 수술 기기 시장 2020-2024
- 제품별 부문 분석 2020-2024
- 최종사용자별 부문 분석 2020-2024
- 용도별 부문 분석 2020-2024
- 지역별 부문 분석 2020-2024
- 국가별 부문 분석 2020-2024
제6장 정성 분석
- AI의 영향 : 세계의 백내장 수술 기기 시장
제7장 Five Forces 분석
- Five Forces 요약
- 구매자의 교섭력
- 공급 기업의 교섭력
- 신규 참여업체의 위협
- 대체품의 위협
- 경쟁의 위협
- 시장 상황
제8장 시장 세분화 : 제품별
- 시장 부문
- 비교 : 제품별
- 안내 렌즈(IOL) : 시장 규모와 예측 2025-2030
- 수정체유화 기기 : 시장 규모와 예측 2025-2030
- 안과용 점탄제(OVDs) : 시장 규모와 예측 2025-2030
- 펨토초 레이저 : 시장 규모와 예측 2025-2030
- 시장 기회 : 제품별
제9장 시장 세분화 : 최종사용자별
- 시장 부문
- 비교 : 최종사용자별
- 병원 및 진료소 : 시장 규모와 예측 2025-2030
- 안과 센터 : 시장 규모와 예측 2025-2030
- 시장 기회 : 최종사용자별
제10장 시장 세분화 : 용도별
- 시장 부문
- 비교 : 용도별
- 핵경화성 백내장 : 시장 규모와 예측 2025-2030
- 후낭하 백내장 : 시장 규모와 예측 2025-2030
- 피질 백내장 : 시장 규모와 예측 2025-2030
- 기타 : 시장 규모와 예측 2025-2030
- 시장 기회 : 용도별
제11장 고객 상황
- 고객 상황 개요
제12장 지역별 상황
- 지역별 세분화
- 지역별 비교
- 북미 : 시장 규모와 예측 2025-2030
- 유럽 : 시장 규모와 예측 2025-2030
- 아시아 : 시장 규모와 예측 2025-2030
- 세계 기타 지역 : 시장 규모와 예측 2025-2030
- 시장 기회 : 지역별
제13장 촉진요인, 과제 및 기회
- 시장 성장 촉진요인
- 시장 과제
- 성장 촉진요인과 과제의 영향
- 시장 기회
제14장 경쟁 구도
- 개요
- 경쟁 구도
- 혼란 상황
- 업계 리스크
제15장 경쟁 분석
- 기업 개요
- 기업 순위 지수
- 기업의 시장 포지셔닝
- Alcon Inc.
- Bausch Health Companies Inc.
- Carl Zeiss AG
- EssilorLuxottica
- HOYA CORP.
- Johnson and Johnson Services
- Lenstec Inc.
- Metall Zug AG
- Mitsui Chemicals Inc.
- NIDEK Co. Ltd.
- Oertli Instrumente AG
- Rayner
- SIFI SPA
- STAAR Surgical Co.
- Topcon Corp.
제16장 부록
KSM 26.01.28The global cataract surgery devices market is forecasted to grow by USD 2637.9 mn during 2025-2030, accelerating at a CAGR of 6.5% during the forecast period. The report on the global cataract surgery devices market provides a holistic analysis, market size and forecast, trends, growth drivers, and challenges, as well as vendor analysis covering around 25 vendors.
The report offers an up-to-date analysis regarding the current market scenario, the latest trends and drivers, and the overall market environment. The market is driven by increasing prevalence of cataracts and rise in geriatric population, growing technological advances in cataract surgery devices, rise in number of cataract procedures.
The study was conducted using an objective combination of primary and secondary information including inputs from key participants in the industry. The report contains a comprehensive market size data, segment with regional analysis and vendor landscape in addition to an analysis of the key companies. Reports have historic and forecast data.
| Market Scope | |
|---|---|
| Base Year | 2026 |
| End Year | 2030 |
| Series Year | 2026-2030 |
| Growth Momentum | Accelerate |
| YOY 2026 | 6.1% |
| CAGR | 6.5% |
| Incremental Value | $2637.9 mn |
Technavio's global cataract surgery devices market is segmented as below:
By Product
- Intraocular lens (IOLs)
- Phacoemulsification devices
- Ophthalmic viscosurgical devices (OVDs)
- Femtosecond lasers
By End-User
- Hospitals and clinics
- Ophthalmology centers
By Application
- Nuclear sclerotic
- Posterior sub capsular
- Cortical cataracts
- Others
Geography
- North America
- US
- Canada
- Mexico
- Europe
- Germany
- UK
- France
- Italy
- Spain
- The Netherlands
- Russia
- Asia
- Rest of World (ROW)
- Rest of World (ROW)
This study identifies the rising medical tourism for low-cost cataract surgery as one of the prime reasons driving the global cataract surgery devices market growth during the next few years. Also, increasing access to cataract surgery in emerging markets and availability of advanced and premium iol implants will lead to sizable demand in the market.
The report on the global cataract surgery devices market covers the following areas:
- Global cataract surgery devices market sizing
- Global cataract surgery devices market forecast
- Global cataract surgery devices market industry analysis
The robust vendor analysis is designed to help clients improve their market position, and in line with this, this report provides a detailed analysis of several leading global cataract surgery devices market vendors that include Abbott Laboratories, AbbVie Inc., Alcon Inc., Bausch Health Companies Inc., Carl Zeiss AG, CRISTALENS, EssilorLuxottica, HOYA CORP., Johnson and Johnson Services, Lenstec Inc., Metall Zug AG, Mitsui Chemicals Inc., NIDEK Co. Ltd., Oertli Instrumente AG, Rayner, ROWIAK GmbH, SIFI SPA, STAAR Surgical Co., Topcon Corp., Ziemer Ophthalmic Systems. Also, the global cataract surgery devices market analysis report includes information on upcoming trends and challenges that will influence market growth. This is to help companies strategize and leverage all forthcoming growth opportunities.
The publisher presents a detailed picture of the market by the way of study, synthesis, and summation of data from multiple sources by an analysis of key parameters such as profit, pricing, competition, and promotions. It presents various market facets by identifying the key industry influencers. The data presented is comprehensive, reliable, and a result of extensive primary and secondary research. The market research reports provide a complete competitive landscape and an in-depth vendor selection methodology and analysis using qualitative and quantitative research to forecast accurate market growth.
Table of Contents
1 Executive Summary
- 1.1 Market overview
- Executive Summary - Chart on Market Overview
- Executive Summary - Data Table on Market Overview
- Executive Summary - Chart on Global Market Characteristics
- Executive Summary - Chart on Market by Geography
- Executive Summary - Chart on Market Segmentation by Product
- Executive Summary - Chart on Market Segmentation by End-user
- Executive Summary - Chart on Market Segmentation by Application
- Executive Summary - Chart on Incremental Growth
- Executive Summary - Data Table on Incremental Growth
- Executive Summary - Chart on Company Market Positioning
2 Technavio Analysis
- 2.1 Analysis of price sensitivity, lifecycle, customer purchase basket, adoption rates, and purchase criteria
- Analysis of price sensitivity, lifecycle, customer purchase basket, adoption rates, and purchase criteria
- 2.2 Criticality of inputs and Factors of differentiation
- Chart on Overview on criticality of inputs and factors of differentiation
- 2.3 Factors of disruption
- Chart on Overview on factors of disruption
- 2.4 Impact of drivers and challenges
- Chart on Impact of drivers and challenges in 2025 and 2030
3 Market Landscape
- 3.1 Market ecosystem
- Chart on Parent Market
- Data Table on - Parent Market
- 3.2 Market characteristics
- Chart on Market characteristics analysis
- 3.3 Value chain analysis
- Chart on Value chain analysis
4 Market Sizing
- 4.1 Market definition
- Data Table on Offerings of companies included in the market definition
- 4.2 Market segment analysis
- Market segments
- 4.3 Market size 2025
- 4.4 Market outlook: Forecast for 2025-2030
- Chart on Global - Market size and forecast 2025-2030 ($ million)
- Data Table on Global - Market size and forecast 2025-2030 ($ million)
- Chart on Global Market: Year-over-year growth 2025-2030 (%)
- Data Table on Global Market: Year-over-year growth 2025-2030 (%)
5 Historic Market Size
- 5.1 Global Cataract Surgery Devices Market 2020 - 2024
- Historic Market Size - Data Table on Global Cataract Surgery Devices Market 2020 - 2024 ($ million)
- 5.2 Product segment analysis 2020 - 2024
- Historic Market Size - Product Segment 2020 - 2024 ($ million)
- 5.3 End-user segment analysis 2020 - 2024
- Historic Market Size - End-user Segment 2020 - 2024 ($ million)
- 5.4 Application segment analysis 2020 - 2024
- Historic Market Size - Application Segment 2020 - 2024 ($ million)
- 5.5 Geography segment analysis 2020 - 2024
- Historic Market Size - Geography Segment 2020 - 2024 ($ million)
- 5.6 Country segment analysis 2020 - 2024
- Historic Market Size - Country Segment 2020 - 2024 ($ million)
6 Qualitative Analysis
- 6.1 The AI impact on Global Cataract Surgery Devices Market
7 Five Forces Analysis
- 7.1 Five forces summary
- Five forces analysis - Comparison between 2025 and 2030
- 7.2 Bargaining power of buyers
- Bargaining power of buyers - Impact of key factors 2025 and 2030
- 7.3 Bargaining power of suppliers
- Bargaining power of suppliers - Impact of key factors in 2025 and 2030
- 7.4 Threat of new entrants
- Threat of new entrants - Impact of key factors in 2025 and 2030
- 7.5 Threat of substitutes
- Threat of substitutes - Impact of key factors in 2025 and 2030
- 7.6 Threat of rivalry
- Threat of rivalry - Impact of key factors in 2025 and 2030
- 7.7 Market condition
- Chart on Market condition - Five forces 2025 and 2030
8 Market Segmentation by Product
- 8.1 Market segments
- Chart on Product - Market share 2025-2030 (%)
- Data Table on Product - Market share 2025-2030 (%)
- 8.2 Comparison by Product
- Chart on Comparison by Product
- Data Table on Comparison by Product
- 8.3 Intraocular lens (IOLs) - Market size and forecast 2025-2030
- Chart on Intraocular lens (IOLs) - Market size and forecast 2025-2030 ($ million)
- Data Table on Intraocular lens (IOLs) - Market size and forecast 2025-2030 ($ million)
- Chart on Intraocular lens (IOLs) - Year-over-year growth 2025-2030 (%)
- Data Table on Intraocular lens (IOLs) - Year-over-year growth 2025-2030 (%)
- 8.4 Phacoemulsification devices - Market size and forecast 2025-2030
- Chart on Phacoemulsification devices - Market size and forecast 2025-2030 ($ million)
- Data Table on Phacoemulsification devices - Market size and forecast 2025-2030 ($ million)
- Chart on Phacoemulsification devices - Year-over-year growth 2025-2030 (%)
- Data Table on Phacoemulsification devices - Year-over-year growth 2025-2030 (%)
- 8.5 Ophthalmic viscosurgical devices (OVDs) - Market size and forecast 2025-2030
- Chart on Ophthalmic viscosurgical devices (OVDs) - Market size and forecast 2025-2030 ($ million)
- Data Table on Ophthalmic viscosurgical devices (OVDs) - Market size and forecast 2025-2030 ($ million)
- Chart on Ophthalmic viscosurgical devices (OVDs) - Year-over-year growth 2025-2030 (%)
- Data Table on Ophthalmic viscosurgical devices (OVDs) - Year-over-year growth 2025-2030 (%)
- 8.6 Femtosecond lasers - Market size and forecast 2025-2030
- Chart on Femtosecond lasers - Market size and forecast 2025-2030 ($ million)
- Data Table on Femtosecond lasers - Market size and forecast 2025-2030 ($ million)
- Chart on Femtosecond lasers - Year-over-year growth 2025-2030 (%)
- Data Table on Femtosecond lasers - Year-over-year growth 2025-2030 (%)
- 8.7 Market opportunity by Product
- Market opportunity by Product ($ million)
- Data Table on Market opportunity by Product ($ million)
9 Market Segmentation by End-user
- 9.1 Market segments
- Chart on End-user - Market share 2025-2030 (%)
- Data Table on End-user - Market share 2025-2030 (%)
- 9.2 Comparison by End-user
- Chart on Comparison by End-user
- Data Table on Comparison by End-user
- 9.3 Hospitals and clinics - Market size and forecast 2025-2030
- Chart on Hospitals and clinics - Market size and forecast 2025-2030 ($ million)
- Data Table on Hospitals and clinics - Market size and forecast 2025-2030 ($ million)
- Chart on Hospitals and clinics - Year-over-year growth 2025-2030 (%)
- Data Table on Hospitals and clinics - Year-over-year growth 2025-2030 (%)
- 9.4 Ophthalmology centers - Market size and forecast 2025-2030
- Chart on Ophthalmology centers - Market size and forecast 2025-2030 ($ million)
- Data Table on Ophthalmology centers - Market size and forecast 2025-2030 ($ million)
- Chart on Ophthalmology centers - Year-over-year growth 2025-2030 (%)
- Data Table on Ophthalmology centers - Year-over-year growth 2025-2030 (%)
- 9.5 Market opportunity by End-user
- Market opportunity by End-user ($ million)
- Data Table on Market opportunity by End-user ($ million)
10 Market Segmentation by Application
- 10.1 Market segments
- Chart on Application - Market share 2025-2030 (%)
- Data Table on Application - Market share 2025-2030 (%)
- 10.2 Comparison by Application
- Chart on Comparison by Application
- Data Table on Comparison by Application
- 10.3 Nuclear sclerotic - Market size and forecast 2025-2030
- Chart on Nuclear sclerotic - Market size and forecast 2025-2030 ($ million)
- Data Table on Nuclear sclerotic - Market size and forecast 2025-2030 ($ million)
- Chart on Nuclear sclerotic - Year-over-year growth 2025-2030 (%)
- Data Table on Nuclear sclerotic - Year-over-year growth 2025-2030 (%)
- 10.4 Posterior sub capsular - Market size and forecast 2025-2030
- Chart on Posterior sub capsular - Market size and forecast 2025-2030 ($ million)
- Data Table on Posterior sub capsular - Market size and forecast 2025-2030 ($ million)
- Chart on Posterior sub capsular - Year-over-year growth 2025-2030 (%)
- Data Table on Posterior sub capsular - Year-over-year growth 2025-2030 (%)
- 10.5 Cortical cataracts - Market size and forecast 2025-2030
- Chart on Cortical cataracts - Market size and forecast 2025-2030 ($ million)
- Data Table on Cortical cataracts - Market size and forecast 2025-2030 ($ million)
- Chart on Cortical cataracts - Year-over-year growth 2025-2030 (%)
- Data Table on Cortical cataracts - Year-over-year growth 2025-2030 (%)
- 10.6 Others - Market size and forecast 2025-2030
- Chart on Others - Market size and forecast 2025-2030 ($ million)
- Data Table on Others - Market size and forecast 2025-2030 ($ million)
- Chart on Others - Year-over-year growth 2025-2030 (%)
- Data Table on Others - Year-over-year growth 2025-2030 (%)
- 10.7 Market opportunity by Application
- Market opportunity by Application ($ million)
- Data Table on Market opportunity by Application ($ million)
11 Customer Landscape
- 11.1 Customer landscape overview
- Analysis of price sensitivity, lifecycle, customer purchase basket, adoption rates, and purchase criteria
12 Geographic Landscape
- 12.1 Geographic segmentation
- Chart on Market share by geography 2025-2030 (%)
- Data Table on Market share by geography 2025-2030 (%)
- 12.2 Geographic comparison
- Chart on Geographic comparison
- Data Table on Geographic comparison
- 12.3 North America - Market size and forecast 2025-2030
- Chart on North America - Market size and forecast 2025-2030 ($ million)
- Data Table on North America - Market size and forecast 2025-2030 ($ million)
- Chart on North America - Year-over-year growth 2025-2030 (%)
- Data Table on North America - Year-over-year growth 2025-2030 (%)
- Chart on Regional Comparison - North America
- Data Table on Regional Comparison - North America
- 12.3.1 US - Market size and forecast 2025-2030
- Chart on US - Market size and forecast 2025-2030 ($ million)
- Data Table on US - Market size and forecast 2025-2030 ($ million)
- Chart on US - Year-over-year growth 2025-2030 (%)
- Data Table on US - Year-over-year growth 2025-2030 (%)
- 12.3.2 Canada - Market size and forecast 2025-2030
- Chart on Canada - Market size and forecast 2025-2030 ($ million)
- Data Table on Canada - Market size and forecast 2025-2030 ($ million)
- Chart on Canada - Year-over-year growth 2025-2030 (%)
- Data Table on Canada - Year-over-year growth 2025-2030 (%)
- 12.3.3 Mexico - Market size and forecast 2025-2030
- Chart on Mexico - Market size and forecast 2025-2030 ($ million)
- Data Table on Mexico - Market size and forecast 2025-2030 ($ million)
- Chart on Mexico - Year-over-year growth 2025-2030 (%)
- Data Table on Mexico - Year-over-year growth 2025-2030 (%)
- 12.4 Europe - Market size and forecast 2025-2030
- Chart on Europe - Market size and forecast 2025-2030 ($ million)
- Data Table on Europe - Market size and forecast 2025-2030 ($ million)
- Chart on Europe - Year-over-year growth 2025-2030 (%)
- Data Table on Europe - Year-over-year growth 2025-2030 (%)
- Chart on Regional Comparison - Europe
- Data Table on Regional Comparison - Europe
- 12.4.1 Germany - Market size and forecast 2025-2030
- Chart on Germany - Market size and forecast 2025-2030 ($ million)
- Data Table on Germany - Market size and forecast 2025-2030 ($ million)
- Chart on Germany - Year-over-year growth 2025-2030 (%)
- Data Table on Germany - Year-over-year growth 2025-2030 (%)
- 12.4.2 UK - Market size and forecast 2025-2030
- Chart on UK - Market size and forecast 2025-2030 ($ million)
- Data Table on UK - Market size and forecast 2025-2030 ($ million)
- Chart on UK - Year-over-year growth 2025-2030 (%)
- Data Table on UK - Year-over-year growth 2025-2030 (%)
- 12.4.3 France - Market size and forecast 2025-2030
- Chart on France - Market size and forecast 2025-2030 ($ million)
- Data Table on France - Market size and forecast 2025-2030 ($ million)
- Chart on France - Year-over-year growth 2025-2030 (%)
- Data Table on France - Year-over-year growth 2025-2030 (%)
- 12.4.4 Italy - Market size and forecast 2025-2030
- Chart on Italy - Market size and forecast 2025-2030 ($ million)
- Data Table on Italy - Market size and forecast 2025-2030 ($ million)
- Chart on Italy - Year-over-year growth 2025-2030 (%)
- Data Table on Italy - Year-over-year growth 2025-2030 (%)
- 12.4.5 Spain - Market size and forecast 2025-2030
- Chart on Spain - Market size and forecast 2025-2030 ($ million)
- Data Table on Spain - Market size and forecast 2025-2030 ($ million)
- Chart on Spain - Year-over-year growth 2025-2030 (%)
- Data Table on Spain - Year-over-year growth 2025-2030 (%)
- 12.4.6 The Netherlands - Market size and forecast 2025-2030
- Chart on The Netherlands - Market size and forecast 2025-2030 ($ million)
- Data Table on The Netherlands - Market size and forecast 2025-2030 ($ million)
- Chart on The Netherlands - Year-over-year growth 2025-2030 (%)
- Data Table on The Netherlands - Year-over-year growth 2025-2030 (%)
- 12.4.7 Russia - Market size and forecast 2025-2030
- Chart on Russia - Market size and forecast 2025-2030 ($ million)
- Data Table on Russia - Market size and forecast 2025-2030 ($ million)
- Chart on Russia - Year-over-year growth 2025-2030 (%)
- Data Table on Russia - Year-over-year growth 2025-2030 (%)
- 12.5 Asia - Market size and forecast 2025-2030
- Chart on Asia - Market size and forecast 2025-2030 ($ million)
- Data Table on Asia - Market size and forecast 2025-2030 ($ million)
- Chart on Asia - Year-over-year growth 2025-2030 (%)
- Data Table on Asia - Year-over-year growth 2025-2030 (%)
- Chart on Regional Comparison - Asia
- Data Table on Regional Comparison - Asia
- 12.5.1 China - Market size and forecast 2025-2030
- Chart on China - Market size and forecast 2025-2030 ($ million)
- Data Table on China - Market size and forecast 2025-2030 ($ million)
- Chart on China - Year-over-year growth 2025-2030 (%)
- Data Table on China - Year-over-year growth 2025-2030 (%)
- 12.5.2 Japan - Market size and forecast 2025-2030
- Chart on Japan - Market size and forecast 2025-2030 ($ million)
- Data Table on Japan - Market size and forecast 2025-2030 ($ million)
- Chart on Japan - Year-over-year growth 2025-2030 (%)
- Data Table on Japan - Year-over-year growth 2025-2030 (%)
- 12.5.3 India - Market size and forecast 2025-2030
- Chart on India - Market size and forecast 2025-2030 ($ million)
- Data Table on India - Market size and forecast 2025-2030 ($ million)
- Chart on India - Year-over-year growth 2025-2030 (%)
- Data Table on India - Year-over-year growth 2025-2030 (%)
- 12.5.4 South Korea - Market size and forecast 2025-2030
- Chart on South Korea - Market size and forecast 2025-2030 ($ million)
- Data Table on South Korea - Market size and forecast 2025-2030 ($ million)
- Chart on South Korea - Year-over-year growth 2025-2030 (%)
- Data Table on South Korea - Year-over-year growth 2025-2030 (%)
- 12.5.5 Indonesia - Market size and forecast 2025-2030
- Chart on Indonesia - Market size and forecast 2025-2030 ($ million)
- Data Table on Indonesia - Market size and forecast 2025-2030 ($ million)
- Chart on Indonesia - Year-over-year growth 2025-2030 (%)
- Data Table on Indonesia - Year-over-year growth 2025-2030 (%)
- 12.5.6 Thailand - Market size and forecast 2025-2030
- Chart on Thailand - Market size and forecast 2025-2030 ($ million)
- Data Table on Thailand - Market size and forecast 2025-2030 ($ million)
- Chart on Thailand - Year-over-year growth 2025-2030 (%)
- Data Table on Thailand - Year-over-year growth 2025-2030 (%)
- 12.5.7 Singapore - Market size and forecast 2025-2030
- Chart on Singapore - Market size and forecast 2025-2030 ($ million)
- Data Table on Singapore - Market size and forecast 2025-2030 ($ million)
- Chart on Singapore - Year-over-year growth 2025-2030 (%)
- Data Table on Singapore - Year-over-year growth 2025-2030 (%)
- 12.6 Rest of World (ROW) - Market size and forecast 2025-2030
- Chart on Rest of World (ROW) - Market size and forecast 2025-2030 ($ million)
- Data Table on Rest of World (ROW) - Market size and forecast 2025-2030 ($ million)
- Chart on Rest of World (ROW) - Year-over-year growth 2025-2030 (%)
- Data Table on Rest of World (ROW) - Year-over-year growth 2025-2030 (%)
- Chart on Regional Comparison - Rest of World (ROW)
- Data Table on Regional Comparison - Rest of World (ROW)
- 12.6.1 Australia - Market size and forecast 2025-2030
- Chart on Australia - Market size and forecast 2025-2030 ($ million)
- Data Table on Australia - Market size and forecast 2025-2030 ($ million)
- Chart on Australia - Year-over-year growth 2025-2030 (%)
- Data Table on Australia - Year-over-year growth 2025-2030 (%)
- 12.6.2 UAE - Market size and forecast 2025-2030
- Chart on UAE - Market size and forecast 2025-2030 ($ million)
- Data Table on UAE - Market size and forecast 2025-2030 ($ million)
- Chart on UAE - Year-over-year growth 2025-2030 (%)
- Data Table on UAE - Year-over-year growth 2025-2030 (%)
- 12.6.3 Brazil - Market size and forecast 2025-2030
- Chart on Brazil - Market size and forecast 2025-2030 ($ million)
- Data Table on Brazil - Market size and forecast 2025-2030 ($ million)
- Chart on Brazil - Year-over-year growth 2025-2030 (%)
- Data Table on Brazil - Year-over-year growth 2025-2030 (%)
- 12.6.4 South Africa - Market size and forecast 2025-2030
- Chart on South Africa - Market size and forecast 2025-2030 ($ million)
- Data Table on South Africa - Market size and forecast 2025-2030 ($ million)
- Chart on South Africa - Year-over-year growth 2025-2030 (%)
- Data Table on South Africa - Year-over-year growth 2025-2030 (%)
- 12.6.5 Saudi Arabia - Market size and forecast 2025-2030
- Chart on Saudi Arabia - Market size and forecast 2025-2030 ($ million)
- Data Table on Saudi Arabia - Market size and forecast 2025-2030 ($ million)
- Chart on Saudi Arabia - Year-over-year growth 2025-2030 (%)
- Data Table on Saudi Arabia - Year-over-year growth 2025-2030 (%)
- 12.6.6 Turkey - Market size and forecast 2025-2030
- Chart on Turkey - Market size and forecast 2025-2030 ($ million)
- Data Table on Turkey - Market size and forecast 2025-2030 ($ million)
- Chart on Turkey - Year-over-year growth 2025-2030 (%)
- Data Table on Turkey - Year-over-year growth 2025-2030 (%)
- 12.7 Market opportunity by geography
- Market opportunity by geography ($ million)
- Data Tables on Market opportunity by geography ($ million)
13 Drivers, Challenges, and Opportunity
- 13.1 Market drivers
- Increasing prevalence of cataracts and rise in geriatric population
- Growing technological advances in cataract surgery devices
- Rise in number of cataract procedures
- 13.2 Market challenges
- High cost of cataract surgeries and insufficient insurance coverage
- Device limitations and complications of cataract surgery devices
- Lack of awareness among people about eye disorders
- 13.3 Impact of drivers and challenges
- Impact of drivers and challenges in 2025 and 2030
- 13.4 Market opportunities
- Rising medical tourism for low-cost cataract surgery
- Increasing access to cataract surgery in emerging markets
- Availability of advanced and premium IOL implants
14 Competitive Landscape
- 14.1 Overview
- 14.2 Competitive Landscape
- Overview on criticality of inputs and factors of differentiation
- 14.3 Landscape disruption
- Overview on factors of disruption
- 14.4 Industry risks
- Impact of key risks on business
15 Competitive Analysis
- 15.1 Companies profiled
- Companies covered
- 15.2 Company ranking index
- Company ranking index
- 15.3 Market positioning of companies
- Matrix on companies position and classification
- 15.4 Alcon Inc.
- Alcon Inc. - Overview
- Alcon Inc. - Business segments
- Alcon Inc. - Key news
- Alcon Inc. - Key offerings
- Alcon Inc. - Segment focus
- SWOT
- 15.5 Bausch Health Companies Inc.
- Bausch Health Companies Inc. - Overview
- Bausch Health Companies Inc. - Business segments
- Bausch Health Companies Inc. - Key news
- Bausch Health Companies Inc. - Key offerings
- Bausch Health Companies Inc. - Segment focus
- SWOT
- 15.6 Carl Zeiss AG
- Carl Zeiss AG - Overview
- Carl Zeiss AG - Product / Service
- Carl Zeiss AG - Key news
- Carl Zeiss AG - Key offerings
- SWOT
- 15.7 EssilorLuxottica
- EssilorLuxottica - Overview
- EssilorLuxottica - Business segments
- EssilorLuxottica - Key news
- EssilorLuxottica - Key offerings
- EssilorLuxottica - Segment focus
- SWOT
- 15.8 HOYA CORP.
- HOYA CORP. - Overview
- HOYA CORP. - Business segments
- HOYA CORP. - Key offerings
- HOYA CORP. - Segment focus
- SWOT
- 15.9 Johnson and Johnson Services
- Johnson and Johnson Services - Overview
- Johnson and Johnson Services - Business segments
- Johnson and Johnson Services - Key news
- Johnson and Johnson Services - Key offerings
- Johnson and Johnson Services - Segment focus
- SWOT
- 15.10 Lenstec Inc.
- Lenstec Inc. - Overview
- Lenstec Inc. - Product / Service
- Lenstec Inc. - Key offerings
- SWOT
- 15.11 Metall Zug AG
- Metall Zug AG - Overview
- Metall Zug AG - Business segments
- Metall Zug AG - Key offerings
- Metall Zug AG - Segment focus
- SWOT
- 15.12 Mitsui Chemicals Inc.
- Mitsui Chemicals Inc. - Overview
- Mitsui Chemicals Inc. - Business segments
- Mitsui Chemicals Inc. - Key offerings
- Mitsui Chemicals Inc. - Segment focus
- SWOT
- 15.13 NIDEK Co. Ltd.
- NIDEK Co. Ltd. - Overview
- NIDEK Co. Ltd. - Business segments
- NIDEK Co. Ltd. - Key offerings
- NIDEK Co. Ltd. - Segment focus
- SWOT
- 15.14 Oertli Instrumente AG
- Oertli Instrumente AG - Overview
- Oertli Instrumente AG - Product / Service
- Oertli Instrumente AG - Key offerings
- SWOT
- 15.15 Rayner
- Rayner - Overview
- Rayner - Product / Service
- Rayner - Key offerings
- SWOT
- 15.16 SIFI SPA
- SIFI SPA - Overview
- SIFI SPA - Product / Service
- SIFI SPA - Key offerings
- SWOT
- 15.17 STAAR Surgical Co.
- STAAR Surgical Co. - Overview
- STAAR Surgical Co. - Product / Service
- STAAR Surgical Co. - Key offerings
- SWOT
- 15.18 Topcon Corp.
- Topcon Corp. - Overview
- Topcon Corp. - Business segments
- Topcon Corp. - Key offerings
- Topcon Corp. - Segment focus
- SWOT
16 Appendix
- 16.1 Scope of the report
- Market definition
- Objectives
- Notes and caveats
- 16.2 Inclusions and exclusions checklist
- Inclusions checklist
- Exclusions checklist
- 16.3 Currency conversion rates for US$
- Currency conversion rates for US$
- 16.4 Research methodology
- Research methodology
- 16.5 Data procurement
- Information sources
- 16.6 Data validation
- Data validation
- 16.7 Validation techniques employed for market sizing
- Validation techniques employed for market sizing
- 16.8 Data synthesis
- Data synthesis
- 16.9 360 degree market analysis
- 360 degree market analysis
- 16.10 List of abbreviations
- List of abbreviations