|
시장보고서
상품코드
1837071
분광학 시장 : 제품 유형, 기술, 용도, 최종 용도별 - 세계 예측(2025-2032년)Spectroscopy Market by Product Type, Technology, Application, End Use - Global Forecast 2025-2032 |
||||||
분광학 시장은 2032년까지 CAGR 6.97%로 239억 6,000만 달러로 성장할 것으로 예측됩니다.
| 주요 시장 통계 | |
|---|---|
| 기준 연도 2024년 | 139억 7,000만 달러 |
| 추정 연도 2025년 | 149억 5,000만 달러 |
| 예측 연도 2032 | 239억 6,000만 달러 |
| CAGR(%) | 6.97% |
본 Executive Summary의 기초와 목적 분광분석의 동향, 이해관계자의 동기, 의사결정자의 전략적 배경을 정리합니다.
이 요약은 실험실, 현장, 산업 환경 전반에 걸친 분광학의 현재 궤적과 의사결정 요인을 이해하기 위한 기초를 확립합니다. 기술 개발, 운영상의 제약, 규제 영향, 그리고 장비 제조업체, 소프트웨어 개발자, 서비스 제공업체, 기관 최종사용자에게 중요한 조달 역학이 통합되어 있습니다. 이 책은 기술 리더와 상업 전략 담당자가 역량 격차 및 기회 창구에 대한 투자를 신속하게 조정할 수 있도록 실용적인 영향에 우선순위를 두고 있습니다.
이 책에서는 분광학을 단순한 분석 기기가 아닌 기기, 데이터 파이프라인, 그리고 사람의 전문 지식이 상호작용하는 통합된 생태계로 보고 있습니다. 새로운 워크플로는 실험실급 장비와 현장용 센서 및 고급 데이터 분석을 결합하여 일상적인 운영과 장기적인 자본 계획 모두에 변화를 가져옵니다. 따라서 이해관계자들은 전략 목표를 정의할 때 정확도, 처리량, 이식성, 라이프사이클 지원 간의 트레이드오프를 평가해야 합니다.
마지막으로, 서론에서는 대상 독자층과 이후 섹션에서 사용할 분석 접근법을 명확히 하고 있습니다. 또한, 독자들이 인사이트를 조달 사양서, R&D 우선순위, 규제 준수 계획, 공급업체와의 계약 전략에 반영할 수 있도록 증거를 해석하는 방법과 권장 사항을 구성하는 방법에 대한 기대치를 제시합니다. 전체적으로 기술 및 상업 팀의 효과적인 의사결정을 지원하는 실용적인 인텔리전스에 초점을 맞추고 있습니다.
진화하는 기술 패러다임, 규제 압력, 새로운 상업적 모델이 분광학의 역량과 경쟁 우위를 재정의하다
기술의 발전, 사용자의 기대치 변화, 엄격한 규제 및 환경 요구 사항으로 인해 분광학은 급속한 변화의 시기를 맞이하고 있습니다. 장비의 소형화, 검출기 감도 향상, 하이브리드 분석 접근방식은 실험실 수준의 능력을 현장 및 니어라인 상황으로 확장하여 실시간 의사결정 요구와 전통적인 집중 분석 사이의 간극을 메우고 있습니다. 그 결과, 운영팀은 견고성과 모듈식 업그레이드 경로를 겸비한 장비를 우선순위에 두게 되었습니다.
데이터 처리의 병렬 개발은 워크플로우를 재구성하고 있습니다. 클라우드 네이티브 아키텍처, 엣지 컴퓨팅, 머신러닝은 파일럿 프로젝트에서 인간의 해석을 확장하고, 일상적인 분석을 자동화하며, 이상 징후를 빠르게 감지할 수 있는 프로덕션급 솔루션으로 발전하고 있습니다. 동시에 Software-Defined Instrumentation과 오픈 API는 기기 제어와 다운스트림 분석을 긴밀하게 통합하여 환경 모니터링 및 공정 제어와 같은 복잡한 애플리케이션을 위한 턴키 솔루션을 실현합니다.
상업적으로는 서비스, 소프트웨어 구독 및 통합 지원 제공을 통한 지속적인 수익원을 중시하는 새로운 비즈니스 모델이 등장하고 있습니다. 이러한 변화로 인해 벤더들은 장비 판매에 분석, 컨설팅, 장기 유지보수 계약을 번들로 제공하게 되었습니다. 규제 압력과 진화하는 표준은 공급업체와 최종사용자가 추적 및 검증 워크플로우를 채택하도록 동기를 부여하고, 조달 표준을 형성하고, 문서화, 재현성, 공급업체가 지원하는 인증 서비스에 중점을 두도록 유도합니다.
2025년 중 미국 관세가 분광학 분야 전반의 장비 공급망, 조달, 연구 투자에 미치는 누적적 영향
2025년 동안 시행된 미국 관세의 누적된 영향은 기술 채택의 근본적인 원동력을 바꾸지 않으면서도 조달 계획, 공급업체 선택, 공급망 아키텍처에 측정 가능한 변화를 가져왔습니다. 특정 수입 부품 및 하위 조립품에 대한 관세 인상은 많은 장비 제조업체의 조달 비용을 증가시켜 조달 전략과 계약 조건을 재평가하도록 유도했습니다. 이에 대응하기 위해 일부 공급업체는 공급업체 다변화와 지역화를 가속화하여 노출을 줄이고 납기를 준수하기 위해 노력했습니다.
이러한 관세 중심의 비용 압박은 보다 보수적인 재고 전략과 조달팀과 설계 엔지니어의 긴밀한 협력으로 이어졌습니다. 일부 벤더들은 관세가 부과되는 부품을 국내 조달 대체품이나 모듈화된 조립품으로 대체하기 위해 장비를 재설계하여 무역 정책 변동에 대한 장기적인 노출을 줄이는 것을 전술적 우선순위로 삼고 있습니다. 또한, 서비스 제공업체는 예비 부품의 물류 비용 상승과 특정 수입 부품의 리드 타임 연장을 반영하여 가격 책정 및 보증 모델을 조정했습니다.
중요한 것은 이러한 정책 환경 하에서 기업들은 단순히 가격에만 주목하는 것이 아니라, 총소유비용과 라이프사이클 및 지원 체계를 재검토하게 되었다는 점입니다. 그 결과, 공급업체와 사용자 간의 관계가 강화되고, 장기 서비스 계약, 현지 수리 능력, 유효한 교체 부품이 조달 결정의 중심이 되었습니다. 이러한 조정은 회복력을 향상시켰지만, 많은 이해관계자들에게는 단기적으로 자본과 운영의 절충이 필요하게 되었습니다.
제품 유형, 기술 플랫폼, 용도, 최종 용도 부문이 어떻게 분광기 조달을 형성하는지를 보여주는 세분화 기반 인사이트
세분화는 다양한 사용자 요구와 기술 선택이 분광학 환경에서 어떻게 상호 작용하는지 해석할 수 있는 실용적인 렌즈를 제공합니다. 제품 유형에 따라 장비는 핵심 하드웨어 플랫폼, 서비스는 컨설팅 및 교육, 유지보수 및 지원, 소프트웨어는 데이터 분석 및 장비 제어로 나뉩니다. 이러한 제품 구분은 조달 팀이 장비와 서비스 계약 및 분석 구독을 번들로 묶어 운영 배포와 인수 후 가치 실현을 위한 통합 솔루션을 만드는 데 중요합니다.
자주 묻는 질문
목차
제1장 서문
제2장 조사 방법
제3장 주요 요약
제4장 시장 개요
제5장 시장 인사이트
제6장 미국 관세의 누적 영향 2025
제7장 AI의 누적 영향 2025
제8장 분광학 시장 : 제품 유형별
- 기기
- 서비스
- 컨설팅과 트레이닝
- 유지관리와 지원
- 소프트웨어
- 데이터 분석
- 계기 제어
제9장 분광학 시장 : 기술별
- 원자 흡광
- 화염
- 흑연로
- 수소화물 생성
- 적외선
- 원적외선
- 중적외선
- 근적외선
- 질량 분석
- 전기분무 이온화
- 매트릭스 지원 레이저 탈착 이온화
- 비행 시간
- 삼중 사중극자
- 핵자기공명
- 고해상도
- 저해상도
- 라만
- 공초점
- 분산형
- 푸리에 변환
- 자외선 가시광선
- 더블 빔
- 싱글 빔
- X선 광전자
제10장 분광학 시장 : 용도별
- 정성 분석
- 정량 분석
- 연구개발
제11장 분광학 시장 : 최종 용도별
- 학술 연구와 정부 조사
- 화학 및 석유화학
- 환경 시험
- 식품 및 음료
- 의약품과 바이오테크놀러지
제12장 분광학 시장 : 지역별
- 아메리카
- 북미
- 라틴아메리카
- 유럽, 중동 및 아프리카
- 유럽
- 중동
- 아프리카
- 아시아태평양
제13장 분광학 시장 : 그룹별
- ASEAN
- GCC
- EU
- BRICS
- G7
- NATO
제14장 분광학 시장 : 국가별
- 미국
- 캐나다
- 멕시코
- 브라질
- 영국
- 독일
- 프랑스
- 러시아
- 이탈리아
- 스페인
- 중국
- 인도
- 일본
- 호주
- 한국
제15장 경쟁 구도
- 시장 점유율 분석, 2024
- FPNV 포지셔닝 매트릭스, 2024
- 경쟁 분석
- Thermo Fisher Scientific Inc.
- Agilent Technologies, Inc.
- Shimadzu Corporation
- PerkinElmer, Inc.
- Bruker Corporation
- Waters Corporation
- Malvern Panalytical Ltd.
- Hitachi High-Tech Corporation
- JEOL Ltd.
- HORIBA, Ltd.
The Spectroscopy Market is projected to grow by USD 23.96 billion at a CAGR of 6.97% by 2032.
| KEY MARKET STATISTICS | |
|---|---|
| Base Year [2024] | USD 13.97 billion |
| Estimated Year [2025] | USD 14.95 billion |
| Forecast Year [2032] | USD 23.96 billion |
| CAGR (%) | 6.97% |
Foundations and purpose of this executive summary framing spectroscopy trends, stakeholder motivations, and the strategic context for decision-makers
This executive summary establishes the foundation for understanding current trajectories and decision levers within spectroscopy across laboratories, field deployments, and industrial environments. It synthesizes technological developments, operational constraints, regulatory influences, and procurement dynamics that matter to equipment manufacturers, software developers, service providers, and institutional end users. The narrative prioritizes practical implications so technical leaders and commercial strategists can rapidly align investments with capability gaps and opportunity windows.
The introduction frames spectroscopy not merely as a set of analytical instruments but as an integrated ecosystem in which instruments, data pipelines, and human expertise interact. Emerging workflows combine laboratory-grade instrumentation with field-capable sensors and advanced data analytics, altering both day-to-day operations and long-term capital planning. Consequently, stakeholders must evaluate trade-offs between accuracy, throughput, portability, and lifecycle support when defining strategic objectives.
Finally, the introduction clarifies the intended audience and the analytical approach used in the subsequent sections. It sets expectations for how evidence is interpreted and how recommendations are structured, ensuring readers can translate insights into procurement specifications, R&D priorities, regulatory compliance plans, and vendor engagement strategies. Throughout, the focus remains on actionable intelligence that supports effective decision-making across technical and commercial teams.
Evolving technological paradigms, regulatory pressures, and new commercial models that are redefining spectroscopy capabilities and competitive advantage
Spectroscopy is undergoing a period of rapid transformation driven by converging technological advances, shifting user expectations, and more rigorous regulatory and environmental requirements. Instrument miniaturization, improved detector sensitivity, and hybrid analytical approaches now extend laboratory-grade capabilities into field and near-line contexts, closing the gap between real-time decision needs and traditional centralized analysis. As a result, operations teams increasingly prioritize instruments that combine robustness with modular upgrade paths.
Parallel developments in data handling are reshaping workflows. Cloud-native architectures, edge computing, and machine learning are maturing from pilot projects into production-grade solutions that augment human interpretation, automate routine analyses, and accelerate anomaly detection. At the same time, software-defined instrumentation and open APIs permit tighter integration between instrument control and downstream analytics, enabling turnkey solutions for complex applications such as environmental monitoring and process control.
Commercially, new business models are emerging that emphasize recurring revenue streams through services, software subscriptions, and integrated support offerings. This change encourages vendors to bundle instrument sales with analytics, consulting, and long-term maintenance agreements. Regulatory pressures and evolving standards further incentivize vendors and end users to adopt traceability and validation workflows, which shape procurement criteria and place a premium on documentation, reproducibility, and vendor-supported qualification services.
Cumulative effects of United States tariffs during 2025 on instrument supply chains, procurement, and research investments across the spectroscopy sector
The cumulative impact of United States tariffs implemented during 2025 has created measurable shifts in procurement planning, supplier selection, and supply chain architecture without altering the underlying drivers of technological adoption. Increased duties on certain imported components and subassemblies raised procurement costs for many instrument manufacturers, prompting re-evaluation of sourcing strategies and contract terms. In response, several suppliers accelerated supplier diversification and regionalization efforts to mitigate exposure and preserve delivery timelines.
These tariff-driven cost pressures translated into more conservative inventory strategies and closer collaboration between procurement teams and design engineers. For some vendors, redesigning instruments to substitute tariffed components with domestically sourced alternatives or modularized assemblies became a tactical priority, as this reduced long-term exposure to trade policy volatility. Additionally, service providers adjusted pricing and warranty models to reflect higher spare-parts logistics costs and extended lead times for certain imported components.
Importantly, the policy environment prompted firms to reassess total cost of ownership and life-cycle support arrangements rather than simply focusing on headline instrument price. This resulted in strengthened vendor-user relationships where long-term service contracts, local repair capabilities, and validated replacement parts became central to procurement decisions. Collectively, these adjustments improved resilience but also required near-term capital and operational trade-offs for many stakeholders.
Segmentation-driven insights showing how product types, technology platforms, applications, and end-use sectors converge to shape spectroscopy procurement
Segmentation offers a practical lens to interpret how different user requirements and technology choices interact across the spectroscopy landscape. Based on product type, instruments remain the core hardware platform while services encompass consulting and training plus maintenance and support, and software divides into data analysis and instrument control. These product distinctions matter because procurement teams often bundle instruments with service agreements and analytics subscriptions, creating integrated solutions that address both operational deployment and post-acquisition value realization.
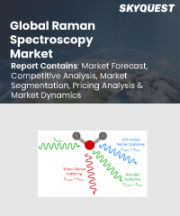
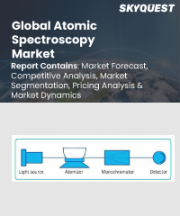
Based on technology, modalities span atomic absorption, infrared, mass spectrometry, nuclear magnetic resonance, Raman, ultraviolet-visible, and X-ray photoelectron techniques. Within atomic absorption, Flame, Graphite Furnace, and Hydride Generation subtypes serve distinct sensitivity and matrix requirements. Infrared methodologies break down into Far Infrared, Mid Infrared, and Near Infrared approaches, each suited to particular molecular fingerprints and sample types. Mass spectrometry contains electrospray ionization, matrix-assisted laser desorption ionization, time-of-flight, and triple quadrupole techniques that vary by ionization chemistry and analytical throughput. Nuclear magnetic resonance differentiates high-resolution and low-resolution systems, while Raman includes confocal, dispersive, and Fourier transform variants. Ultraviolet-visible systems offer double beam and single beam options for differing precision and cost profiles.
Based on application, workflows focus on qualitative analysis, quantitative analysis, and research and development, with each application imposing distinct validation and throughput constraints. Based on end use, stakeholders include academic and government research, chemical and petrochemical, environmental testing, food and beverage, and pharmaceuticals and biotechnology, and each end-use sector brings unique regulatory and operational expectations that influence procurement specifications and service requirements. Understanding these segmentation layers helps vendors and buyers align product configurations, service offerings, and support models to real operational need.
Regional dynamics across the Americas, Europe Middle East & Africa, and Asia-Pacific that shape technology adoption, supply resilience, and service delivery
Regional dynamics exert a strong influence on technology adoption, supplier strategies, and service delivery patterns, and understanding these differences is essential to building resilient supply chains and effective go-to-market plans. In the Americas, purchasers balance high expectations for technical support with a preference for rapid deployment and local repair capabilities; this region often drives demand for field-capable systems and integrated analytics that shorten time to actionable results. Investment in domestic service networks and localized spare-parts distribution tends to be a priority as organizations optimize uptime and compliance.
Within Europe, Middle East & Africa, regulatory harmonization, cross-border logistics complexity, and diverse end-user sophistication levels create a mosaic of procurement behavior. Western European laboratories frequently prioritize validated workflows and full documentation, while emerging markets across the broader region focus on cost-effective, robust platforms and training partnerships. Service models that combine remote diagnostics with on-site qualification are increasingly valuable across this geography.
Asia-Pacific exhibits rapid uptake of both high-end laboratory instruments and compact field analyzers driven by industrial expansion, environmental monitoring mandates, and significant investments in pharmaceutical and food safety infrastructure. Regional manufacturing capability in some Asia-Pacific markets supports both local OEM growth and export-oriented supply chains, but it also creates competitive pressure that influences pricing and innovation cycles. Across all regions, cross-border collaboration, local regulatory regimes, and talent availability determine the shape of adoption curves and service expectations.
Competitive intelligence on leading companies advancing instrumentation, software analytics, and service offerings for spectroscopy with focus on partnerships and partnerships
Leading companies in the spectroscopy space differentiate through integrated value propositions that combine instrumentation excellence, robust software ecosystems, and scalable service offerings. Competitive dynamics now reward firms that deliver not only high-performance optics and detectors but also intuitive user interfaces, validated analytics, and predictable lifecycle support. Strategic partnerships, co-development agreements with academic institutions, and targeted acquisitions of niche software vendors enable firms to close capability gaps rapidly and to present end-to-end solutions to complex end users.
Companies that maintain flexible manufacturing footprints and robust supplier relationships can respond more effectively to trade policy shifts and component shortages. At the same time, those that invest in modular instrument architectures allow users to upgrade sensing and computing subsystems without wholesale replacement. This headroom for incremental improvement supports longer equipment lifecycles and reduces resistance to higher upfront pricing when offset by lower long-term operational costs.
Service leadership is a differentiator. Firms that combine proactive remote monitoring, expedited spare-parts logistics, and comprehensive training programs strengthen customer retention and create recurring revenue opportunities. Transparency in product roadmaps, certification programs for application workflows, and accessible validation protocols further solidify vendor credibility with regulated end users and institutional buyers.
Actionable recommendations turning technical trends, procurement challenges, and regulatory signals into strategic priorities for spectroscopy leaders
Leaders should align strategy across four pragmatic dimensions: capability, procurement resilience, customer experience, and regulatory readiness. First, invest selectively in technologies that expand application reach while preserving backward compatibility with installed bases; modular instrument designs and software upgradeability reduce friction for existing customers and lower switching barriers for new ones. Second, diversify supply sources and qualify secondary suppliers early to reduce exposure to trade disruptions and tariff fluctuations, pairing supplier diversification with inventory optimization to balance cost and responsiveness.
Third, build stronger recurring-revenue service models that integrate analytics subscriptions, managed support, and training programs. This approach not only stabilizes revenue but also deepens customer relationships and provides a channel for iterative product improvement through usage data. Fourth, embed regulatory and validation workflows into product and service development so that end users can more rapidly demonstrate compliance and reproducibility; provide comprehensive documentation, validation kits, and training modules to ease customer adoption.
Operationally, prioritize investments in digital tools that enable remote diagnostics, predictive maintenance, and secure data exchange, and foster alliances with software partners to accelerate analytics deployment. Taken together, these recommendations reduce procurement risk, increase customer lifetime value, and position firms to capture demand as spectroscopy use cases diversify.
Transparent research methodology describing data sources, analytical approaches, validation steps, and quality controls used to ensure rigorous results
The research methodology combines multiple evidence streams to produce robust, reproducible insights. Primary inputs include structured interviews with procurement specialists, laboratory managers, and R&D leaders; technical validations conducted in controlled environments; and de-identified usage telemetry from instrument fleets where available. Supplementary inputs encompass peer-reviewed literature, standards and guidance documents, and vendor technical whitepapers that clarify functional trade-offs and performance baselines.
Analytical approaches integrate qualitative synthesis with comparative feature mapping and risk assessment frameworks. Validation steps include cross-referencing interview findings with observed procurement behavior and technical test results, while sensitivity checks ensure that conclusions remain stable across plausible variations in supply chain conditions and regulatory scenarios. Quality controls include independent peer review of technical interpretations and replication of key instrument performance observations by certified laboratories.
These methodological choices prioritize transparency and traceability. Each analytical claim is supported by source annotations and, where appropriate, by technical appendices detailing test conditions, instrumentation parameters, and data-processing workflows. This structure enables readers to reproduce critical analyses and to adapt the approach to their own organizational contexts.
Conclusion synthesizing implications for suppliers, end users, and policy makers and highlighting strategic priorities for spectroscopy stakeholders
In conclusion, spectroscopy stands at an inflection point where technical innovation, shifting procurement dynamics, and regulatory expectations intersect to redefine how analytics are procured, deployed, and supported. Instrument manufacturers that embrace modularity, open software architectures, and robust service ecosystems will be better positioned to capture diverse end-user needs. End users who prioritize total cost of ownership, supplier resilience, and integrated analytics will realize faster time to insight and improved operational continuity.
Policy makers and standards bodies play a constructive role by clarifying validation expectations and supporting harmonized approaches to data integrity and traceability. These efforts lower barriers for cross-border collaboration and accelerate adoption of next-generation spectroscopy applications in environmental monitoring, pharmaceuticals, and industrial process control. Looking ahead, continued convergence between hardware performance and software intelligence will create differentiated value for organizations that can integrate analytics into decision-making workflows.
Overall, stakeholders must take a holistic view that balances near-term operational resilience with longer-term investments in capability expansion. By focusing on modularity, service integration, and validated analytics, organizations can adapt to evolving technical and policy landscapes while maintaining high standards of scientific rigor and operational performance.
Table of Contents
1. Preface
- 1.1. Objectives of the Study
- 1.2. Market Segmentation & Coverage
- 1.3. Years Considered for the Study
- 1.4. Currency & Pricing
- 1.5. Language
- 1.6. Stakeholders
2. Research Methodology
3. Executive Summary
4. Market Overview
5. Market Insights
- 5.1. Integration of artificial intelligence and machine learning for real-time spectral data interpretation and anomaly detection
- 5.2. Expansion of portable and handheld Raman spectroscopy devices for on-site environmental monitoring and rapid detection
- 5.3. Development of compact mid-infrared quantum cascade laser spectroscopy systems for high-sensitivity gas analysis
- 5.4. Advancements in benchtop nuclear magnetic resonance spectrometers with cryogen-free technology reducing operational costs
- 5.5. Adoption of hyphenated techniques combining chromatography and mass spectrometry for comprehensive molecular profiling in clinical diagnostics
- 5.6. Emergence of hyperspectral imaging coupled with deep learning for precision agriculture and crop health assessment
6. Cumulative Impact of United States Tariffs 2025
7. Cumulative Impact of Artificial Intelligence 2025
8. Spectroscopy Market, by Product Type
- 8.1. Instruments
- 8.2. Services
- 8.2.1. Consulting And Training
- 8.2.2. Maintenance And Support
- 8.3. Software
- 8.3.1. Data Analysis
- 8.3.2. Instrument Control
9. Spectroscopy Market, by Technology
- 9.1. Atomic Absorption
- 9.1.1. Flame
- 9.1.2. Graphite Furnace
- 9.1.3. Hydride Generation
- 9.2. Infrared
- 9.2.1. Far Infrared
- 9.2.2. Mid Infrared
- 9.2.3. Near Infrared
- 9.3. Mass Spectrometry
- 9.3.1. Electrospray Ionization
- 9.3.2. Matrix Assisted Laser Desorption Ionization
- 9.3.3. Time Of Flight
- 9.3.4. Triple Quadrupole
- 9.4. Nuclear Magnetic Resonance
- 9.4.1. High Resolution
- 9.4.2. Low Resolution
- 9.5. Raman
- 9.5.1. Confocal
- 9.5.2. Dispersive
- 9.5.3. Fourier Transform
- 9.6. Ultraviolet Visible
- 9.6.1. Double Beam
- 9.6.2. Single Beam
- 9.7. X Ray Photoelectron
10. Spectroscopy Market, by Application
- 10.1. Qualitative Analysis
- 10.2. Quantitative Analysis
- 10.3. Research And Development
11. Spectroscopy Market, by End Use
- 11.1. Academic And Government Research
- 11.2. Chemical And Petrochemical
- 11.3. Environmental Testing
- 11.4. Food And Beverage
- 11.5. Pharmaceuticals And Biotechnology
12. Spectroscopy Market, by Region
- 12.1. Americas
- 12.1.1. North America
- 12.1.2. Latin America
- 12.2. Europe, Middle East & Africa
- 12.2.1. Europe
- 12.2.2. Middle East
- 12.2.3. Africa
- 12.3. Asia-Pacific
13. Spectroscopy Market, by Group
- 13.1. ASEAN
- 13.2. GCC
- 13.3. European Union
- 13.4. BRICS
- 13.5. G7
- 13.6. NATO
14. Spectroscopy Market, by Country
- 14.1. United States
- 14.2. Canada
- 14.3. Mexico
- 14.4. Brazil
- 14.5. United Kingdom
- 14.6. Germany
- 14.7. France
- 14.8. Russia
- 14.9. Italy
- 14.10. Spain
- 14.11. China
- 14.12. India
- 14.13. Japan
- 14.14. Australia
- 14.15. South Korea
15. Competitive Landscape
- 15.1. Market Share Analysis, 2024
- 15.2. FPNV Positioning Matrix, 2024
- 15.3. Competitive Analysis
- 15.3.1. Thermo Fisher Scientific Inc.
- 15.3.2. Agilent Technologies, Inc.
- 15.3.3. Shimadzu Corporation
- 15.3.4. PerkinElmer, Inc.
- 15.3.5. Bruker Corporation
- 15.3.6. Waters Corporation
- 15.3.7. Malvern Panalytical Ltd.
- 15.3.8. Hitachi High-Tech Corporation
- 15.3.9. JEOL Ltd.
- 15.3.10. HORIBA, Ltd.