
|
시장보고서
상품코드
1574315
AIT 방지 시장(2024-2029년)Global AIT Prevention Market: 2024-2029 |
||||||
| 주요 통계 | |
|---|---|
| 2024년에서 기업의 AIT 비용 총액 : | 21억 달러 |
| 2029년에서 기업의 AIT 비용 총액 : | 9억 2,900만 달러 |
| 2024-2029년 AIT 트래픽 감소율 : | 53% |
| 예측 기간 : | 2024-2029년 |
이 조사 스위트는 향후 5년 동안 크게 변화할 AIT 방지 시장에 대한 상세하고 인사이트 있는 분석을 제공합니다. 이동통신사 및 AIT 방지 벤더와 같은 이해관계자들은 향후 5년간 AIT 및 모바일 메시지 사기 시장이 어떻게 진화할 것인지, 그리고 AI의 영향과 경쟁 환경의 진화를 이해할 수 있습니다.
이 제품군에는 AIT 트래픽, 미래 감소에 대한 데이터에 대한 액세스, 예방 시장의 최신 동향과 기회를 파악할 수 있는 인사이트 있는 연구 등 개별적으로 구매할 수 있는 몇 가지 옵션이 포함되어 있습니다. 또한 AIT 예방 분야의 18개 선도기업에 대한 광범위한 분석을 포함한 자료도 포함되어 있습니다.
주요 특징
- 시장 역학: AIT 방지 시장의 주요 동향, 시장 이슈가 시장에 미치는 영향, FaaS(Fraud-as-a-Service)의 복잡성, AIT 화이트리스트, 모니터링, 차단 등 AIT 방지를 위한 벤더의 개입을 평가합니다. 또한 주요 60개국의 AIT 방지 시장의 현재 상황과 향후 성장에 대한 지역별 성장률 분석도 포함되어 있습니다.
- 주요 요점 및 전략적 제안: AIT 방지 시장의 주요 발전 기회와 조사 결과에 대한 상세한 분석과 함께 AIT 방지 벤더, 규제 당국 및 네트워크 사업자를 위한 주요 전략적 제안을 제공합니다.
- 벤치마크 산업 예측 : 불법 A2P SMS 트래픽 및 손실에 대한 기업, 이동통신사, 모바일 가입자 손실에 대한 5년 예측 데이터베이스를 제공합니다.
- Juniper Research의 경쟁 리더보드: 18개 AIT 대응 벤더의 능력과 역량을 평가하고, 시장 실적, 매출, 미래 사업 전망 등의 기준으로 벤더를 평가합니다.
샘플 뷰
시장 데이터 & 예측 리포트 :
시장 동향 & 전략 리포트 :
시장 데이터 & 예측 리포트
본 조사 스위트에는 40개의 표와 18,200개 이상의 데이터 포인트로 구성된 종합적인 5년 예측 데이터세트에 대한 액세스가 포함되어 있습니다. 이 조사 제품군에는 다음과 같은 지표가 포함되어 있습니다. :
- 연간 A2P SM 총 전송 건수
- 불법 A2P SMS 총 건수
- 불법 SMS로 인한 총 손실액
이러한 지표는 다음과 같은 주요 시장에 대해 제공됩니다. :
- 이동통신사 손실
- 기업 손실
- 모바일 가입자 손실
Juniper Research의 Interactive Forecast Excel에는 다음과 같은 기능이 있습니다. :
- 통계 분석 : 데이터 기간 중 모든 지역과 국가에 대해 표시되는 특정 지표를 검색할 수 있는 것이 장점입니다. 그래프를 쉽게 수정하고 클립보드로 내보낼 수 있습니다.
- 국가별 데이터 툴: 이 툴에서는 예측 기간 중 모든 지역 및 국가의 지표를 볼 수 있습니다. 검색창을 통해 표시되는 지표를 좁힐 수 있습니다.
- 국가별 비교 툴: 특정 국가를 선택하여 비교할 수 있습니다. 이 툴에는 그래프를 내보내는 기능이 포함되어 있습니다.
- What-if 분석 : 5개의 대화형 시나리오를 통해 사용자는 예측의 전제조건과 비교할 수 있습니다.
목차
시장 동향·전략
제1장 주요 포인트·전략적 권장사항
제2장 향후 시장 전망
- AIT 사기 : 서론
- 사기의 영향
- AIT 방지
- A2P 비용의 상승
- AIT의 복잡성
- AI와 AIT
- FaaS(Fraud-as-a-Service)
- SMS를 개입시킨 기타 사기 행위
제3장 에코시스템 분석
- 에코시스템 분석 : 서론
- AIT 삭감 벤더
- 모바일 오퍼레이터
- 메시징 애그리게이터
- CPaaS 프로바이더
- SMS 사기
제4장 국가별 준비 지수
- 국가별 준비 지수 : 서론
- 중점 시장
- 성장 시장
- 포화 시장
- 신흥 시장
경쟁 리더보드
제1장 JuniperResearch : 경쟁 리더보드
제2장 벤더 개요
- AIT 부정 방지 벤더 개요
- Arkose Labs
- BICS
- CM.com
- GMS(Global Message Services)
- Infobip
- LANCK Telecom
- LINK Mobility
- Mavenir Systems
- Mitto
- Monty Mobile
- Route Mobile
- Sinch
- Subex
- Syniverse
- Tata Communications
- Telesign
- Twilio
- VOX Solutions
- Juniper Research Leaderboard : 조사 방법
- 제한과 해석
데이터 & 예측
제1장 A2P SMS 사기 시장의 개요
- A2P SMS 사기 시장의 예측 : 서론
- 부정 A2P SMS 총수
- 부정 SMS에 의한 총손실액
제2장 오퍼레이터 손실 : 시장 예측·주요 포인트
- 오퍼레이터 손실
- 예측 방법
- A2P 그레이 루트 메시지 연간 총수
- 그레이 루트 트래픽에 의한 오퍼레이터의 매출 기회 손실
제3장 기업의 손실 : 시장 예측·주요 포인트
- 기업의 손실
- 예측 방법
- AIT 및 SMS 트랏싱에 의한 A2P SMS 트래픽
- AIT 및 SMS 트랏싱 기업에 대한 총 비용
제4장 모바일 가입자 손실 : 시장 예측·주요 포인트
- 모바일 가입자 손실
- 예측 방법
- 모바일 가입자 손실로 연결될 가능성이 있는 A2P SMS 트래픽의 시도 합계
- 모바일 가입자에게 손실을 가져온 A2P SMS 트래픽의 합계
- 부정 A2P SMS에 의한 모바일 가입자의 총손실액
제5장 SMS 방화벽 지출 : 시장 예측·주요 포인트
- SMS 방화벽
- 예측 방법
- SMS 방화벽에 의해 처리된 A2P SMS 트래픽 합계
- SMS 방화벽에 대한 통신 오퍼레이터 총지출
| KEY STATISTICS | |
|---|---|
| Total AIT cost to enterprises in 2024: | $2.1bn |
| Total AIT cost to enterprises in 2029: | $929m |
| 2024 to 2029 AIT traffic decline: | 53% |
| Forecast period: | 2024-2029 |
Overview
Our "AIT Prevention" research suite provides a detailed and insightful analysis of a market set for significant change over the next five years. It enables stakeholders from mobile operators and AIT prevention vendors to understand how the market for AIT and mobile messaging fraud will evolve over the next five years, as well as the impact of AI and the evolving competitive environment.
The AIT prevention market suite includes several different options that can be purchased separately, including access to data mapping of the traffic and future decline of AIT, and an insightful study uncovering the latest trends and opportunities within the prevention market. Additionally, it includes a document containing an extensive analysis of the 18 market leaders in the AIT prevention space. The coverage can also be purchased as a full research suite, which contains all these elements and includes a substantial discount.
Collectively, they provide a critical tool for understanding this rapidly emerging market; allowing AIT prevention vendors and operators to identify key approaches to shape their future strategy. This research suite's unparalleled coverage makes it an incredibly useful resource for projecting the future of such an uncertain and fast-moving market.
Key Features
- Market Dynamics: Insights into key trends and market impacts resulting from challenges within the AIT prevention market. This research addresses challenges posed by fraudulent players utilising AI within AIT fraud and the complexities presented with FaaS (Fraud-as-a-Service). This research then assesses vendor intervention in AIT prevention, such as whitelisting, monitoring and blocking AIT. This AIT prevention research also includes a regional market growth rate analysis on the current development and future growth of AIT prevention across 60 key countries.
- Key Takeaways & Strategic Recommendations: In-depth analysis of key development opportunities and findings within the AIT prevention market, accompanied by key strategic recommendations for AIT prevention vendors, regulators and network operators.
- Benchmark Industry Forecasts: Five-year forecast databases are provided for fraudulent A2P SMS traffic and losses, split by enterprise, mobile operator and mobile subscriber losses.
- Juniper Research Competitor Leaderboard: Key player capability and capacity assessment for 18 AIT prevention vendors via the Juniper Research Competitor Leaderboard; scoring these vendors on criteria such as market performance, revenue and future business prospects.
SAMPLE VIEW
Market Data & Forecasting Report:

The numbers tell you what's happening, but our written report details why, alongside the methodologies.
Market Trends & Strategies Report:

A comprehensive analysis of the current market landscape, alongside strategic recommendations.
Market Data & Forecasting Report
The market-leading research suite for the Mobile Messaging market includes access to a comprehensive five-year forecast dataset comprising 40 tables and over 18,200 datapoints. Metrics in the research suite include:
- Total A2P SMS Sent per Annum
- Total Fraudulent A2P SMS
- Total Losses to Fraudulent SMS
These metrics are provided for the following key market verticals:
- Mobile Operator Losses
- Enterprise Losses
- Mobile Subscriber Losses
Juniper Research Interactive Forecast Excel contains the following functionality:
- Statistics Analysis: Users benefit from the ability to search for specific metrics, displayed for all regions and countries across the data period. Graphs are easily modified and can be exported to the clipboard.
- Country Data Tool:This tool lets users look at metrics for all regions and countries in the forecast period. Users can refine the metrics displayed via a search bar.
- Country Comparison Tool: Users can select and compare specific countries. The ability to export graphs is included in this tool.
- What-if Analysis: Here, users can compare forecast metrics against their own assumptions via 5 interactive scenarios.
Market Trends & Strategies Report
This trends analysis report examines the "AIT Prevention" market landscape in detail; assessing market trends and factors shaping the evolution of this rapidly changing fraudulent activity. The essential strategy report delivers a comprehensive analysis of the strategic opportunities for AIT prevention providers; addressing key verticals and developing challenges, and how stakeholders must navigate these. It also includes evaluation of key country-level opportunities for AIT prevention growth.
Competitor Leaderboard Report
The Competitor Leaderboard report provides a detailed evaluation and market positioning for 18 leading vendors in the AIT prevention space. The vendors are positioned as established leaders, leading challengers, or disruptors and challengers based on capacity and capability assessments:
|
|
This competitive analysis document is centred around the Juniper Research Competitor Leaderboard, a vendor positioning tool that provides an at-a-glance view of the competitive landscape in a market; backed by a robust methodology.
Table of Contents
Market Trends & Strategies
1. Key Takeaways and Strategic Recommendations
- 1.1. Key Takeaways and Strategic Recommendations
2. Future Market Outlook
- 2.1. Introduction to AIT Fraud
- Figure 2.1: AIT Fraud Infographic
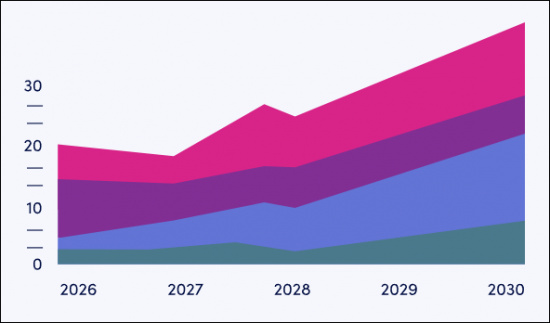
- Figure 2.2: Total Revenue Loss to AIT and SMS Trashing ($m), Split by 8 Key Regions, 2024, $2.1 billion
- Figure 2.3: Total AIT and SMS Trashing A2P SMS Traffic (m), Split by 8 Key Regions, 2024-2029
- 2.2. Impact of Fraud
- i. Enterprises
- Figure 2.4: Total AIT and SMS Trashing A2P SMS Traffic (m), Split by 8 Key Regions, 2020-2023
- ii. Mobile Operators
- iii. Consumers
- i. Enterprises
- 2.3. AIT Prevention
- 2.4. Rising A2P Costs
- Figure 2.5: Average Cost per A2P SMS ($), Split by 8 Key Regions, 2024-2029
- 2.5. Complexities of AIT
- 2.6. AI and AIT
- 2.7. FaaS (Fraud-as-a-Service)
- Figure 2.6: FaaS Elements Infographic
- 2.8. Additional Forms of Fraud over SMS
- i. SMS Phishing
- Figure 2.7: SMS Phishing Infographic
- Figure 2.8: Total Mobile Subscriber Losses Attributable to Fraudulent A2P SMS ($m), Split by 8 Key Regions, 2024-2029
- ii. Grey Routes
- Figure 2.9: Lost Operator Revenue Opportunity due to Grey Route Traffic ($m), Split by 8 Key Regions, 2024-2029
- iii. Premium Rate SMS
- iv. ATO
- v. SMS Trashing
- i. SMS Phishing
3. Ecosystem Analysis
- 3.1. Introduction to Ecosystem Analysis
- 3.1.1. AIT Mitigation Vendors
- 3.1.2. Mobile Operators
- 3.1.3. Messaging Aggregators
- 3.1.4. CPaaS Providers
- 3.2. SMS Fraud
- Figure 3.1: SMS Fraud Ecosystem Infographic
4. Country Readiness Index
- 4.1. Introduction to Country Readiness Index
- Figure 4.1: AIT/SMS Fraud Country Readiness Index Regional Definitions
- Table 4.2: Juniper Research Country Readiness Index Scoring Criteria: AIT/SMS Fraud Prevention
- Figure 4.3: Juniper Research Country Readiness Index: AIT/SMS Fraud Prevention
- Table 4.4: AIT/SMS Fraud Prevention Country Readiness Index: Market Segments
- 4.2. Focus Markets
- Figure 4.5: Total Losses to A2P SMS Fraud ($m), Split by 8 Focus Markets, 2024
- i. High GDP
- Figure 4.6: Average Mobile Subscriber Loss per Successful Fraudulent A2P SMS ($), Split by Eight Focus Markets, 2024-2029
- ii. High Mobile Subscriber User Base
- Figure 4.7: Mobile Subscribers (m), Split by Eight Focus Markets, 2024-2029
- iii. Gaps in Regulation
- 4.3. Growth Markets
- i. Increasing Mobile Subscribers
- Figure 4.8: Total Mobile Subscribers (m), Split by Growth Markets, 2024-2029
- ii. Pakistan
- iii. Nigeria
- i. Increasing Mobile Subscribers
- 4.4. Saturated Markets
- i. West Europe
- Figure 4.9: Total A2P SMS Traffic (m), Split by Eight Saturated Markets, 2024-2029
- ii. Hong Kong, Israel, New Zealand and Qatar
- Figure 4.10: Total Mobile Subscribers (m), Split by Four Saturated Markets, 2024
- i. West Europe
- 4.5. Developing Markets
- Figure 4.11: Total Losses to A2P SMS Fraud ($m), Split by Developing Markets, 2024
- i. GDP per Capita
- ii. Mobile Subscribers
- Table 4.12: Juniper Research's Country Readiness Index Heatmap: North America
- Table 4.13: Juniper Research's Country Readiness Index Heatmap: Latin America
- Table 4.14: Juniper Research's Country Readiness Index Heatmap: West Europe
- Table 4.15: Juniper Research's Country Readiness Index Heatmap: Central & East Europe
- Table 4.16: Juniper Research's Country Readiness Index Heatmap: Far East & China
- Table 4.17: Juniper Research's Country Readiness Index Heatmap: Indian Subcontinent
- Table 4.18: Juniper Research's Country Readiness Index Heatmap: Rest of Asia Pacific
- Table 4.19: Juniper Research's Country Readiness Index Heatmap: Africa & Middle East
Competitor Leaderboard
1. Juniper Research Competitor Leaderboard
- 1.1. Why Read This Report
- Table 1.1: Juniper Research Competitor Leaderboard: Vendors & Product Portfolio
- Figure 1.2: Juniper Research Competitor Leaderboard: AIT Fraud Prevention
- Table 1.3: Juniper Research Competitor Leaderboard: Vendors
- Table 1.4: Juniper Research Competitor Leaderboard Heatmap: AIT Fraud Prevention Vendors
2. Vendor Profiles
- 2.1. AIT Fraud Prevention Vendor Profiles
- 2.1.1. Arkose Labs
- i. Corporate Information
- ii. Geographical Spread
- iii. Key Clients & Strategic Partnerships
- iv. High-level View of Offering
- v. Juniper Research's View: Key Strengths & Strategic Opportunities
- 2.1.2. BICS
- i. Corporate Information
- Table 2.1: BICS' Select Financial Information (Euro-m), 2022 & 2023
- ii. Geographical Spread
- iii. Key Clients & Strategic Partnerships
- iv. High-level View of Offering
- v. Juniper Research's View: Key Strengths & Strategic Opportunities
- i. Corporate Information
- 2.1.3. CM.com
- i. Corporate Information
- Table 2.2: Acquisitions Made by CM.com, 2021-present
- Table 2.3: CM.com's Select Financial Information (Euro-m), 2022-2023
- ii. Geographical Spread
- iii. Key Clients & Strategic Partnerships
- iv. High-level View of Offering
- v. Juniper Research's View: Key Strengths & Strategic Opportunities
- i. Corporate Information
- 2.1.4. GMS (Global Message Services)
- i. Corporate Information
- ii. Geographical Spread
- iii. Key Clients & Strategic Partnerships
- iv. High-level View of Offering
- v. Juniper Research's View: Key Strengths & Strategic Opportunities
- 2.1.5. Infobip
- i. Corporate Information
- Table 2.4: Infobip's Acquisitions - April 2021 to Present
- ii. Geographical Spread
- iii. Key Clients & Strategic Partnerships
- iv. High-level View of Offering
- Figure 2.5: Infobip's Signals Solution
- v. Juniper Research's View: Key Strengths & Strategic Opportunities
- i. Corporate Information
- 2.1.6. LANCK Telecom
- i. Corporate Information
- ii. Geographical Spread
- iii. Key Clients & Strategic Partnerships
- iv. High-level View of Offering
- v. Juniper Research's View: Key Strengths and Strategic Opportunities
- 2.1.7. LINK Mobility
- i. Corporate Information
- ii. Geographical Spread
- iii. Key Clients & Strategic Partnerships
- iv. High-level View of Offering
- v. Juniper Research's View: Key Strengths & Strategic Opportunities
- 2.1.8. Mavenir Systems
- i. Corporate Information
- ii. Geographical Spread
- iii. Key Clients & Strategic Partnerships
- iv. High-level View of Offering
- Figure 2.6: Mavenir's Fraud and Security Suite
- v. Juniper Research's View: Key Strengths & Strategic Opportunities
- 2.1.9. Mitto
- i. Corporate Information
- ii. Geographical Spread
- iii. Key Clients & Strategic Partnerships
- iv. High-level View of Offering
- v. Juniper Research's View: Key Strengths & Strategic Opportunities
- 2.1.10. Monty Mobile
- i. Corporate Information
- ii. Geographical Spread
- iii. Key Clients & Strategic Partnerships
- iv. High-level View of Offering
- v. Juniper Research's View: Key Strengths & Strategic Opportunities
- 2.1.11. Route Mobile
- i. Corporate Information
- Table 2.7: Route Mobile's Annual Financial Information (Indian Rupee Cr), 2021-2023
- ii. Geographical Spread
- iii. Key Clients & Strategic Partnerships
- iv. High-level View of Offering
- Figure 2.8: Route Mobile's Route Shield Solution
- v. Juniper Research's View: Key Strengths & Strategic Opportunities
- i. Corporate Information
- 2.1.12. Sinch
- i. Corporate Information
- Table 2.9: Sinch's Recent Acquisitions, 2020-2021
- Table 2.10: Sinch's Select Financial Information ($m), 2021-2023
- ii. Geographical Spread
- iii. Key Clients & Strategic Partnerships
- iv. High-level View of Offering
- v. Juniper Research's View: Key Strengths & Strategic Opportunities
- i. Corporate Information
- 2.1.13. Subex
- i. Corporate Information
- Table 2.119: Subex's Financial Information ($m), 2022 and 2023
- ii. Geographical Spread
- iii. Key Clients & Strategic Partnerships
- iv. High-level View of Offering
- v. Juniper Research's View: Key Strengths & Strategic Opportunities
- i. Corporate Information
- 2.1.14. Syniverse
- i. Corporate Information
- ii. Geographical Spread
- iii. Key Clients & Strategic Partnerships
- iv. High-level View of Offering
- v. Juniper Research's View: Key Strengths & Strategic Opportunities
- 2.1.15. Tata Communications
- i. Corporate Information
- ii. Geographical Spread
- iii. Key Clients & Strategic Partnerships
- iv. High-level View of Offering
- v. Juniper Research's View: Key Strengths & Strategic Opportunities
- 2.1.16. Telesign
- i. Corporate Information
- ii. Geographical Spread
- iii. Key Clients & Strategic Partnerships
- iv. High-level View of Offering
- v. Juniper Research's View: Key Strengths & Strategic Opportunities
- 2.1.17. Twilio
- i. Corporate Information
- Table 2.1210: Twilio's Acquisitions, November 2019-present
- Table 2.1311: Twilio's Revenue ($m), 2021-2023
- ii. Geographical Spread
- iii. Key Clients & Strategic Partnerships
- iv. High-level View of Offering
- Figure 2.1412: Twilio's Verify SMS Fraud Insights Dashboard
- v. Juniper Research's View: Key Strengths & Strategic Opportunities
- i. Corporate Information
- 2.1.18. VOX Solutions
- i. Corporate Information
- ii. Geographical Spread
- iii. Key Clients & Strategic Partnerships
- iv. High-level View of Offering
- v. Juniper Research's View: Key Strengths & Strategic Opportunities
- 2.1.1. Arkose Labs
- 2.2. Juniper Research Leaderboard Methodology
- 2.3. Limitations & Interpretations
- Table 2.1513: Juniper Research Competitor Leaderboard Scoring Criteria: AIT Prevention Vendors
Data & Forecasting
1. A2P SMS Fraud Market Summary
- 1.1. Introduction to A2P SMS Fraud Market Forecasts
- Figure 1.1: Total Mobile Subscribers (m), Split by 8 Key Regions, 2024-2029
- 1.2. Total Fraudulent A2P SMS
- Figure & Table 1.2: Total Fraudulent A2P SMS (m), Split by 8 Key Regions, 2024-2029
- Table 1.3: Total Fraudulent A2P SMS (m), Split by Operator, Enterprise and Mobile Subscriber, 2024-2029
- 1.3. Total Losses to Fraudulent A2P SMS
- Figure & Table 1.4: Total Losses to Fraudulent A2P SMS ($m), Split by 8 Key Regions, 2024-2029
- Table 1.5: Total Losses to Fraudulent A2P SMS ($m), Split by Operator, Mobile Subscriber and Enterprise Losses, 2024-2029
2. Operator Losses: Market Forecasts & Key Takeaways
- 2.1. Operator Losses
- 2.1.1. Operator Losses Forecast Methodology
- i. Request for Information
- Figure 2.1: Operator Losses Forecast Methodology
- i. Request for Information
- 2.1.2. Total Number of A2P Grey Route Messages per Annum
- Figure & Table 2.2: Total Number of A2P Grey Route Messages per Annum (m), Split by 8 Key Regions, 2024-2029
- 2.1.3. Lost Operator Revenue Opportunity due to Grey Route Traffic
- Figure & Table 2.3: Lost Operator Revenue Opportunity due to Grey Route Traffic ($m), Split by 8 Key Regions, 2024-2029
- 2.1.1. Operator Losses Forecast Methodology
3. Enterprise Losses: Market Forecasts & Key Takeaways
- 3.1. Enterprise Losses
- 3.1.1. Forecast & Methodology
- Figure 3.1: Enterprise Losses Forecast Methodology
- 3.1.2. Total AIT and SMS Trashing A2P SMS Traffic
- Figure & Table 3.2: Total AIT and SMS Trashing A2P SMS Traffic (m), Split by 8 Key Regions, 2024-2029
- 3.1.3. Total Cost of AIT and SMS Trashing to Enterprises
- Figure & Table 3.3: Total Cost of AIT and SMS Trashing to Enterprises ($m), Split by 8 Key Regions, 2024-2029
- 3.1.1. Forecast & Methodology
4. Mobile Subscriber Losses: Market Forecasts & Key Takeaways
- 4.1. Mobile Subscriber Losses
- 4.1.1. Forecast & Methodology
- Figure 4.1: Mobile Subscriber Losses Forecast Methodology
- 4.1.2. Total A2P SMS Traffic Attributable to Mobile Subscriber Loss Attempts
- Figure & Table 4.2: Total A2P SMS Traffic Attributable to Mobile Subscriber Loss Attempts (m), Split by 8 Key Regions, 2024-2029
- 4.1.3. Total A2P SMS Traffic that Causes Mobile Subscriber Losses
- Figure & Table 4.3: Total A2P SMS Traffic that Causes Mobile Subscriber Losses (m), Split by 8 Key Regions, 2024-2029
- 4.1.4. Total Mobile Subscriber Losses Attributable to Fraudulent A2P SMS
- Figure & Table 4.4: Total Mobile Subscriber Losses Attributable to Fraudulent A2P SMS ($m), Split by 8 Key Regions, 2024-2029
- Table 4.5: Average Loss per Successful Fraudulent A2P SMS ($), Split by 8 Key Regions, 2024-2029
- 4.1.1. Forecast & Methodology
5. SMS Firewall Spend: Market Forecasts & Key Takeaways
- 5.1. SMS Firewalls
- 5.1.1. Forecast & Methodology
- Figure 5.1: SMS Firewalls Forecast Methodology
- 5.1.2. Total A2P SMS Traffic Handled by SMS Firewalls
- Figure & Table 5.2: Total A2P SMS Traffic Handled by SMS Firewalls (m), Split by 8 Key Regions, 2024-2029
- 5.1.3. Total Operator Spend on SMS Firewalls
- Figure & Table 5.3: Total Operator Spend on SMS Firewalls ($m), Split by 8 Key Regions, 2024-2029
- 5.1.1. Forecast & Methodology
