|
시장보고서
상품코드
1581327
CBDC(중앙은행 디지털화폐) 및 스테이블코인 시장(2024-2031년)Global CBDCs & Stablecoins Market: 2024-2031 |
||||||
"CBDC(중앙은행 디지털화폐) 거래수는 2031년 78억 건에 달할 전망"
| 주요 통계 | |
|---|---|
| 2024년 거래액 | 2,252억 달러 |
| 2031년 거래액 | 1조 6,000억 달러 |
| 2024년부터 2031년까지 시장 성장률 | 612% |
| 예측 기간 | 2024-2031년 |
본 조사 자료집은 진화하는 CBDC(중앙은행 디지털화폐) 및 스테이블코인 시장에 대한 상세하고 통찰력 있는 분석을 제공합니다. 중앙은행, 상업은행, 스테이블코인 발행사, 결제 서비스 제공업체 등 이해관계자들은 향후 성장, 주요 동향, 경쟁 환경을 파악할 수 있습니다. 여기에는 CBDC 개발 시 가능한 설계 옵션과 전 세계 각국의 디지털 통화 규제 프레임워크 현황에 대한 분석도 포함됩니다. 또한 도매 CBDC가 어떻게 통화 주권을 강화할 수 있는지, 소매 CBDC가 어떻게 금융 포용성을 높이고 은행 계좌가 없는 사람들의 디지털 금융 참여를 촉진할 수 있는지에 대해서도 논의합니다.
이 제품군에는 CBDC 및 스테이블코인 거래의 미래 성장을 매핑하는 데이터에 대한 액세스, 금융 시장의 최신 동향과 기회를 파악할 수 있는 통찰력 있는 연구 등 여러 옵션을 개별적으로 구매할 수 있는 옵션이 포함돼 있습니다. 또한, CBDC 분야의 14개 시장 리더에 대한 광범위한 분석도 포함되어 있습니다.
주요 특징
- 시장 역학 : CBDC 및 스테이블코인의 채택 촉진요인과 장벽, 주요 동향과 시장 확대 과제에 대한 인사이트, 국경 간 결제가 직면한 거래 비용 문제, CBDC 구축 시 상호운용성 통합의 중요성, 금융 시장에서 CBDC와 스테이블코인의 상호 작용 등을 다룹니다. 또한, 8개 주요 지역의 현재 발전 상황과 부문별 성장에 대한 국가별 준비도 지표를 통해 향후 전망도 제시합니다.
- 주요 요점 및 전략적 제언 : CBDC 및 스테이블코인 시장의 주요 발전 기회와 인사이트를 상세히 분석하고 이해관계자를 위한 전략적 제언을 제시합니다.
- 벤치마크 산업 예측 : CBDC 및 스테이블코인 데이터 세트에는 CBDC 및 스테이블코인에 대한 시장 규모 예측이 포함되어 있으며, 여기에는 이러한 결제 수단을 통해 얻을 수 있는 예상 총 절감액과 다양한 시장 부문의 거래 수 등이 포함됩니다.
- Juniper Research의 경쟁 리더보드 : CBDC 개발 업계 주요 기업의 시장 규모를 게시하고 14개 주요 CBDC 벤더의 역량을 평가합니다.
샘플 보기
시장 데이터 및 예측 보고서:

시장 동향 및 전략 보고서:

시장 데이터 및 예측 보고서
이 조사 제품군에는 95개의 표와 45,600개의 데이터 포인트에 대한 예측 데이터 세트에 대한 액세스가 포함되어 있습니다. 이 조사 제품군에는 다음과 같은 지표가 포함되어 있습니다.
- CBDC 시장의 총 거래수, 총 거래액, 총 저축액
- 스테이블코인 시장의 총 거래수, 총 거래액, 총 저축액
- CBDC 및 스테이블코인 시장 부문별 총 거래수 및 총 거래액:
- 국내 소비자 거래
- 국내 B2B 거래
- 크로스보더 소비자 거래
- 크로스보더 B2B 거래
Juniper Research Interactive Forecast Excel에는 다음과 같은 기능이 있습니다.
- 통계 분석 : 데이터 기간 동안 모든 지역과 국가에 대해 표시되는 특정 지표를 검색할 수 있습니다. 그래프를 쉽게 수정하고 클립보드로 내보낼 수 있습니다.
- 국가별 데이터 도구 : 이 도구에서는 예측 기간 동안 모든 지역 및 국가의 지표를 볼 수 있습니다. 검색창을 통해 표시되는 지표를 좁힐 수 있습니다.
- 국가별 비교 도구 : 특정 국가를 선택하여 비교할 수 있습니다. 이 도구에는 그래프를 내보내는 기능이 포함되어 있습니다.
- What-if 분석 : 5가지 대화형 시나리오를 통해 사용자는 예측의 가정과 비교할 수 있습니다.
목차
시장 동향·전략
제1장 중요 포인트·전략적 추천사항
- 중요 포인트
- 전략적 추천사항
제2장 시장 상황
- CBDC 및 스테이블코인의 역사
- 주요 동향과 촉진요인
- 스테이블코인 사용은 금융 정세에 큰 파괴적 영향을 미친다
- 디지털화폐를 이끄는 규제의 역할
- 신흥 국가는 rCBDC 개발로 가장 큰 이익을 얻는다
- 프라이버시 보호에 필요한 첨단 암호화 방식
- 스마트 계약은 경제를 어떻게 변화시킬 수 있을까?
제3장 부문 분석
- 소매 CBDC
- 도매 CBDC
- 스테이블코인
- 스테이블코인과 CBDC의 상호작용
제4장 국가별 준비 지수
- 국가별 준비 지수 : 소개
- 주목 시장
- 성장 시장
- 포화 시장
- 신흥 시장
경쟁 리더보드
제1장 Juniper Research 경쟁 리더보드
- 이 보고서를 읽어야 하는 이유
- CBDC 벤더 개요
- Accenture
- Bitt
- Consensys
- eCurrency
- EMTECH
- FIS
- Giesecke + Devrient
- IDEMIA
- Mastercard
- Nahmii
- R3
- Ripple
- Soramitsu
- Stellar
데이터·예측
제1장 시장 개요
- 조사 방법·가정
제2장 예측 개요
- CBDC 및 스테이블코인 총 거래수
- 스테이블코인과 CBDC 총 거래액
- CBDC 및 스테이블코인 총 저축액
제3장 CBDC : 시장 예측
- CBDC 총 거래수 : 주요 8개 지역별
- CBDC 총 거래수 : 시장 부문별
- CBDC 총 거래액 : 주요 8개 지역별
- CBDC 총 거래액 : 시장 부문별
- CBDC의 잠재적 총 저축액 : 주요 8개 지역별
- CBDC의 잠재적 총 저축액 : 시장 부문별
제4장 스테이블코인 : 시장 예측
- 스테이블코인 총 거래수 : 주요 8개 지역별
- 스테이블코인 총 거래수 : 시장 부문별
- 스테이블코인 총 거래액 : 주요 8개 지역별
- 스테이블코인 총 거래액 : 시장 부문별
- 스테이블코인의 잠재적 총 저축액 : 주요 8개 지역별
- 스테이블코인의 잠재적 총 저축액 : 시장 부문별
'CBDC Transaction Volume to Reach 7.8 Billion by 2031'
| KEY STATISTICS | |
|---|---|
| Transaction value in 2024: | $225.2bn |
| Transaction value in 2031: | $1.6tn |
| 2024 to 2031 market growth: | 612% |
| Forecast period: | 2024-2031 |
Overview
Our CBDCs (Central Bank Digital Currency) & Stablecoin research suite provides a detailed and insightful analysis of this evolving market; enabling stakeholders such as central banks, commercial banks, stablecoin issuers and payment service providers to understand future growth, key trends and the competitive environment. This includes an analysis of possible design choices in the development of CBDCs and the current state of digital currency regulatory frameworks around the globe. The report also discusses how wholesale CBDCs can strengthen monetary sovereignty and how retail CBDCs can increase financial inclusion and facilitate participation in digital finance among unbanked populations.
The suite includes several different options that can be purchased separately, including access to data mapping the future growth of CBDC & stablecoin transactions; an insightful study uncovering the latest trends and opportunities within the financial markets. It also includes a document containing extensive analysis of the 14 market leaders in the CBDC space. The coverage can also be purchased as a Full Research Suite, containing all of these elements, at a substantial discount.
Collectively, they provide a critical tool for understanding this rapidly emerging market; allowing stakeholders in the CBDC and stablecoins market to shape their future strategy. Its unparalleled coverage makes this research suite an incredibly useful resource for charting the future of such an uncertain and fast-growing market.
Key Features
- Market Dynamics: Insights into key trends and market expansion challenges within the CBDC & stablecoin market, including drivers and barriers for CBDC and stablecoin adoption. The report addresses the challenges that the cross-border payments sector faces regarding transaction costs; how incorporating interoperability is key when building CBDCs; and the interplay between CBDCs and stablecoins in financial markets. The research also features a Country Readiness Index on the current development and segment growth of the CBDC & stablecoins market across 8 key regions, as well as providing a future outlook.
- Key Takeaways & Strategic Recommendations: In-depth analysis of key development opportunities and findings within the CBDC & stablecoins market, accompanied by strategic recommendations for stakeholders.
- Benchmark Industry Forecasts: The CBDC & stablecoins dataset includes forecasts for total value of the CBDC & stablecoin market, including the total expected savings that can be gained using these payments method, and the transaction volume of various market segments.
- Juniper Research Competitor Leaderboard: Key market player capability and capacity assessment for 14 CBDC vendors, via the Juniper Research Competitor Leaderboard; featuring market size for major players in the CBDC development industry.
SAMPLE VIEW
Market Data & Forecasting Report:
The numbers tell you what's happening, but our written report details why, alongside the methodologies.
Market Trends & Strategies Report:
A comprehensive analysis of the current market landscape, alongside strategic recommendations.
Market Data & Forecasting Report
The market-leading research suite for the CBDCs and Stablecoin market includes access to the full set of forecast data of 95 tables and 45,600 datapoints. Metrics in the research suite include:
- Total Transaction Volume, Value, and Savings Received from the CBDC Market
- Total Transaction Volume, Value, and Savings Received from the Stablecoin Market
- Total Transaction Volume and Value of the CBDC and Stablecoin Market, Split by the following Market Segments:
- Domestic Consumer Transactions
- Domestic B2B Transactions
- Cross-border Consumer Transactions
- Cross-Border B2B Transactions
Juniper Research Interactive Forecast Excel contains the following functionality:
- Statistics Analysis: Users benefit from the ability to search for specific metrics, displayed for all regions and countries across the data period. Graphs are easily modified and can be exported to the clipboard.
- Country Data Tool: This tool lets users look at metrics for all regions and countries in the forecast period. Users can refine the metrics displayed via a search bar.
- Country Comparison Tool: Users can select and compare specific countries. The ability to export graphs is included in this tool.
- What-if Analysis: Here, users can compare forecast metrics against their own assumptions, via five interactive scenarios.
Market Trends & Strategies Report
This report examines the CBDC & Stablecoin market landscape in detail; assessing trends and factors shaping the evolution of this rapidly growing market. The report delivers comprehensive analysis of the strategic opportunities for CBDC vendors; addressing key verticals and developing challenges, and highlighting how stakeholders should navigate these. It also includes evaluation of key country-level opportunities for stakeholders in the CBDC & stablecoins market.
Competitor Leaderboard Report
The Competitor Leaderboard report provides a detailed evaluation and market positioning for 14 leading vendors in the CBDC space. The vendors are positioned as established leaders, leading challengers, or disruptors and challengers, based on capacity and capability assessments:
|
|
This document is centred around the Juniper Research Competitor Leaderboard; a vendor positioning tool that provides an at-a-glance view of the competitive landscape in a market, backed by a robust methodology.
Table of Contents
Market Trends & Strategies
1. Key Takeaways & Strategic Recommendations
- 1.1. Key Takeaways
- 1.2. Strategic Recommendations
2. Market Landscape
- 2.1. Introduction
- 2.2. History of CBDCs and Stablecoins
- 2.3. Key Trends and Drivers
- 2.3.1. Stablecoin Use has an Outsized Disruptive Impact on the Financial Landscape
- 2.3.2. The Role of Regulations in Guiding Digital Currencies
- 2.3.3. Emerging Nations Have the Most to Gain from Developing rCBDCs
- 2.3.4. Advanced Cryptographic Methods Necessary to Preserve Privacy
- 2.3.5. How Could Smart Contracts Transform the Economy?
- i. Subscriptions
- ii. Liquidity Management
- iii. DvP (Delivery Versus Payment)
- iv. (PVP) Payment Versus Payment
- v. M2M (Machine-to-Machine) Payments
3. Segment Analysis
- 3.1. Retail CBDCs
- Figure 3.1: The Status of Retail CBDCs Worldwide as of September 2024
- 3.1.1. Why Develop a Retail CBDC?
- Figure 3.2: Potential Goals of Retail CBDC Development
- 3.1.2. Potential Goals/Motives of CBDC Development
- i. Geopolitics
- ii. Enhance Cross-border Payments
- iii. Financial Inclusion in the Digital Economy
- iv. Retaining Monetary Sovereignty
- Figure 3.3: Design Principles for a Digital Pound
- 3.1.3. High-level Technological Analysis: Design Choices for CBDCs
- 3.1.4. What Are the Potential Barriers to Adoption?
- Figure 3.4: CBDC Features Compared to Physical Cash
- 3.2. Wholesale CBDCs
- Figure 3.5: Status of Wholesale CBDCs Worldwide as of September 2024
- 3.2.1. The Evolution of Wholesale Payment Systems
- Figure 3.6: How Wholesale Bank Payments Happen Today
- i. What Are the Inefficiencies in this System?
- 3.2.2. How Can Wholesale CBDCs Address This?
- Figure 3.7: Objectives of Wholesale CBDC Development
- 3.2.3. Current wCBDC Cross-border Projects
- Figure 3.8: The Project Agora Platform
- 3.2.4. Alternatives to Wholesale CBDC Development
- 3.3. Stablecoins
- 3.3.1. Key Actors in the Stablecoin Market
- i. What Are the Use Cases of Stablecoins?
- Figure 3.9: Use Cases for Stablecoins
- ii. What Are Future Use Cases for Stablecoins?
- i. What Are the Use Cases of Stablecoins?
- 3.3.1. Key Actors in the Stablecoin Market
- 3.4. The Interplay Between Stablecoins and CBDCs
4. Country Readiness Index
- 4.1. Introduction to the Country Readiness Index
- Figure 4.1: CBDC and Stablecoin Country Readiness Index Regional Definitions
- Figure 4.2: Juniper Research Country Readiness Index Scoring Criteria: CBDC and Stablecoins
- Figure 4.3: Juniper Research Country Readiness Index: Global CBDC and Stablecoin Market
- Figure 4.4: CBDC and Stablecoin Country Readiness Index: Market Segments
- 4.1.1. Focus Market
- i. The Strength of BRICS
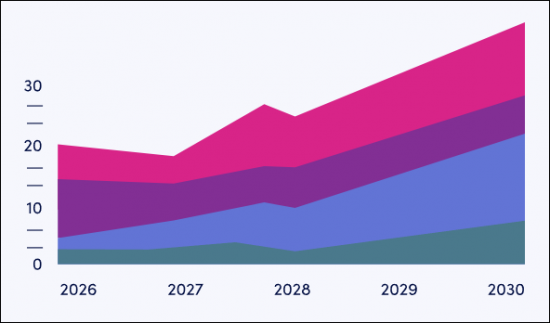
- Figure 4.5: Total CBDC & Stablecoin Market Value per Annum ($m), Split by Seven Key Markets, 2024-2031
- ii. West Europe and the Digital Euro
- iii. Japan
- iv. The US
- v. China
- i. The Strength of BRICS
- 4.1.2. Growth Market
- Figure 4.6: Total Value of CBDCs and Stablecoins in Growth Markets, ($m), By Country 2024-2031
- i. Prioritising Wholesale over Retail CBDC Development
- 4.1.3. Saturated Markets
- Figure 4.7: Saturated Markets' CBDC & Stablecoin Market Value, ($m), By Country, 2024-2031
- i. Heavy Restrictions on Cryptocurrency
- 4.1.4. Developing Markets
- Figure 4.8: CBDC & Stablecoin Market Value in Six Developing Markets, ($m), By Country, 2024-2031
- i. Restrictive Legislation
- ii. Gaps in Technological Infrastructure
- iii. Adequate Alternative Financial Systems
- Table 4.9: Juniper Research's Country Readiness Index Heatmap: North America
- Table 4.10: Juniper Research's Country Readiness Index Heatmap: Latin America
- Table 4.11: Juniper Research's Country Readiness Index Heatmap: West Europe
- Table 4.12: Juniper Research's Country Readiness Index Heatmap: Central & East Europe
- Table 4.13: Juniper Research's Country Readiness Index Heatmap: Far East & China
- Table 4.14: Juniper Research's Country Readiness Index Heatmap: Indian Subcontinent
- Table 4.15: Juniper Research's Country Readiness Index Heatmap: Rest of Asia Pacific
- Table 4.16: Juniper Research's Country Readiness Index Heatmap: Africa & Middle East
Competitor Leaderboard
1. Juniper Research Competitor Leaderboard
- 1.1. Why Read This Report?
- Table 1.1: Juniper Research Competitor Leaderboard CBDC Vendor Product Portfolio
- Figure 1.2: Juniper Research Leaderboard: CBDC Vendors
- Table 1.3: Juniper Research Leaderboard: CBDC Vendor Positioning
- Figure 1.4: Juniper Research Leaderboard Heatmap: CBDC Vendors
- 1.2. CBDC Vendor Profiles
- 1.2.1. Accenture
- i. Corporate
- ii. Geographic Spread
- iii. Key Clients and Strategic Partnerships
- iv. High-level View of Offerings
- v. Juniper Research's View: Key Strengths and Strategic Partnerships
- 1.2.2. Bitt
- i. Corporate
- ii. Geographic Spread
- iii. Key Clients & Strategic Partnerships
- iv. High-level View of Offerings
- v. Juniper Research's View: Key Strengths & Strategic Development Opportunities
- 1.2.3. Consensys
- i. Corporate
- ii. Geographic Spread
- iii. Key Clients & Strategic Partnerships
- iv. High-level View of Offerings
- v. Juniper Research's View: Key Strengths & Strategic Development Opportunities
- 1.2.4. eCurrency
- i. Corporate
- ii. Geographic Spread
- iii. Key Clients & Strategic Partnerships
- iv. High-level View of Offerings
- Figure 1.5: Use Cases for eCurrency DSC3
- v. Juniper Research's View: Key Strengths & Strategic Development Opportunities
- 1.2.5. EMTECH
- i. Corporate
- ii. Geographic Spread
- iii. Key Clients & Strategic Partnerships
- iv. High-level View of Offerings
- Figure 1.6: The Features and Benefits of the Beyond Cash
- v. Juniper Research Key Strengths and Strategic Opportunities
- 1.2.6. FIS
- i. Corporate
- ii. Geographic Spread
- iii. Key Clients and Strategic Partnerships
- iv. High-level View of Offerings
- v. Juniper Research's View: Key Strengths & Strategic Development Opportunities
- 1.2.7. Giesecke + Devrient
- vi. Corporate
- vii. Geographic Spread
- viii. Key Clients & Strategic Partnerships
- ix. High-level View of Offerings
- x. Juniper Research's View: Key Strengths & Strategic Opportunities
- 1.2.8. IDEMIA
- i. Corporate
- ii. Geographical Spread
- iii. Key Clients & Strategic Partnerships
- iv. High-level View of Offerings
- v. Juniper Research's View: Key Strengths & Strategic Recommendations
- 1.2.9. Mastercard
- i. Corporate
- Table 1.7: Mastercard Revenue ($m), 2022-2023
- ii. Geographical Spread
- iii. Key Clients & Strategic Partnerships
- iv. High-level View of Offerings
- Figure 1.8: Mastercard's CBDC Sandbox Architecture
- v. Juniper Research's View: Key Strengths & Strategic Recommendations
- i. Corporate
- 1.2.10. Nahmii
- i. Corporate
- ii. Geographic Spread
- iii. Key Clients & Strategic Partnerships
- iv. High-level View of Offerings
- v. Juniper Research's View: Key Strengths & Strategic Development Opportunities
- 1.2.11. R3
- i. Corporate
- ii. Geographic Spread
- iii. Key Clients & Strategic Partnerships
- iv. High-level View of Offerings
- v. Juniper Research's View: Key Strengths and Strategic Recommendations
- 1.2.12. Ripple
- i. Corporate
- ii. Geographic Spread
- iii. Key Clients & Strategic Partnerships
- iv. High-level View of Offerings
- v. Juniper Research's View: Key Strengths & Strategic Development
- 1.2.13. Soramitsu
- i. Corporate
- ii. Geographic Spread
- iii. Key Clients & Strategic Partnerships
- iv. High-level View of Offerings
- v. Juniper Research's View: Key Strengths & Strategic Recommendations
- 1.2.14. Stellar
- i. Corporate
- ii. Geographic Spread
- iii. Key Clients & Strategic Partnerships
- iv. High-level View of Offerings
- v. Juniper Research's View: Key Strengths & Strategic Opportunities
- 1.2.1. Accenture
Data & Forecasting
1. Market Overview
- 1.1. Introduction
- 1.2. Methodology & Assumptions
- Figure 1.1: Consumer Domestic CBDCs/Stablecoins Methodology
- Figure 1.2: Consumer Cross-border CBDCs/Stablecoins Methodology
- Figure 1.3: B2B Domestic CBDCs/Stablecoins Methodology
- Figure 1.4: B2B Cross-border CBDCs/Stablecoins Methodology
2. Forecast Summary
- 2.1. Total Volume of CBDC and Stablecoin Transactions
- Figure & Table 2.1: Total Number of Transactions Using Stablecoins and CBDCs (m), Split by Stablecoins and CBDCs, 2024-2031
- 2.2. Total Value of Stablecoin & CBDC Transactions
- Figure & Table 2.2: Total Value of Stablecoin and CBDC Transactions ($bn), Split by 8 Key Regions, 2024-2031
- 2.3. Potential Savings from CBDC and Stablecoin Use
- Figure & Table 2.3: Total Savings Achieved Using Stablecoins and CBDCs ($m), Split by 8 Key Regions, 2024-2031
3. CBDCs: Market Forecast
- 3.1. Total Number of CBDC Transactions
- Figure & Table 3.1: Total Number of Transactions Using CBDC (m), Split by 8 Key Regions, 2024-2031
- 3.2. Total Number of CBDC Transactions
- Figure & Table 3.2: Total Number of CBDC Transactions (m), Split by Segment, 2024-2031
- 3.3. Total Value of CBDC Transactions
- Figure & Table 3.3: Total Value of CBDC Transactions ($bn), Split by 8 Key Regions, 2024-2031
- 3.4. Total Value of CBDC Transactions
- Figure & Table 3.4: Total Value of CBDC Transactions, ($bn), Split by Segment, 2024-2031
- 3.5. Total Potential Savings Achieved Using CBDCs ($m)
- Figure & Table 3.5: Total Savings Achieved Using CBDCs ($m), Split by 8 Key Regions, 2024-2031
- 3.6. Total Potential Savings Achieved Using CBDCs
- Figure & Table 3.6: Total Savings Achieved Using CBDCs ($m), Split by Segment, 2024-2031
4. Stablecoins: Market Forecast
- 4.1. Total Number of Stablecoin Transactions
- Figure & Table 4.1: Total Number of Transactions Using Stablecoins (m), Split 8 Key Regions, 2024-2031
- 4.2. Total Number of Stablecoin Transactions
- Figure & Table 4.2: Total Number of Transactions Using Stablecoins (m), Split Segment, 2024-2031
- 4.3. Total Value of Stablecoin Transactions
- Figure & Table 4.3: Total Value of Stablecoin Transactions ($bn), Split by 8 Key Regions, 2024-2031
- 4.4. Total Value of Stablecoin Transactions
- Figure & Table 4.4: Total Value of Stablecoin Transactions, ($m), Split by Segment, 2024-2031
- 4.5. Total Potential Savings Achieved Using Stablecoins ($m)
- Figure & Table 4.5: Total Savings Achieved Using Stablecoins ($m), Split by 8 Key Regions, 2024-2031
- 4.6. Total Potential Savings Achieved Using Stablecoins ($m)
- Figure & Table 4.6: Total Savings Achieved Using Stablecoins ($m), Split by Segment, 2024-2031