


|
시장보고서
상품코드
1627226
네트워크 토큰화 시장(2025-2029년)Global Network Tokenisation Market: 2025-2029 |
||||||
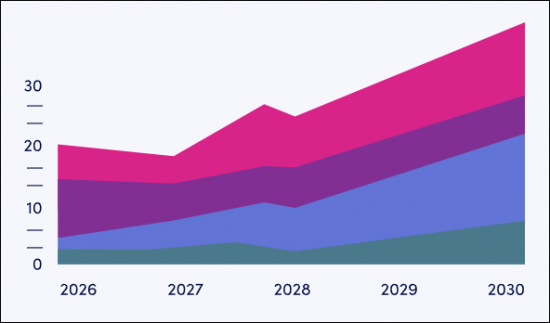
2029년 네트워크 토큰화 트랜잭션은 전 세계 5,740억 건에 달할 전망
| 주요 통계 | |
|---|---|
| 2025년 네트워크 토큰화 총 수익 : | 41억 달러 |
| 2029년 네트워크 토큰화 총 수익 | 89억 달러 |
| 2025년부터 2029년까지 시장 성장률 : | 117.3% |
| 예측 기간 : | 2024-2029년 |
이 조사 제품군은 네트워크 토큰화를 둘러싼 생태계에 대한 포괄적이고 상세한 분석을 제공하여 가맹점, 결제 게이트웨이, 토큰 서비스 제공업체, 토큰 수요자 등 이해관계자들이 향후 성장, 주요 동향, 경쟁 환경을 이해할 수 있도록 돕습니다. 본 제품군에는 네트워크 토큰화의 장점, Click to Pay가 E-Commerce 분야에 미치는 영향, 네트워크 토큰화를 선도하는 지역 평가 등이 포함되어 있습니다.
또한, 이 제품군에는 네트워크 토큰화의 향후 성장 기회를 매핑한 데이터, 금융 시장의 최신 동향과 기회를 파악할 수 있는 통찰력 있는 조사, 네트워크 토큰화를 주도하는 12명의 시장 리더에 대한 광범위한 분석 자료 등 개별적으로 구매할 수 있는 몇 가지 옵션도 포함되어 있습니다. 을 포함하여 몇 가지 개별 구매 옵션이 포함되어 있습니다.
이 보고서는 빠르게 발전하는 네트워크 토큰화 시장을 이해하고 이해관계자들이 효과적인 미래 전략을 수립하는 데 필수적인 자료가 될 것입니다. 종합적인 인사이트와 광범위한 조사 대상을 바탕으로 한 이 조사 자료는 급성장하는 시장을 탐색하고 계획하는 데 유용한 도구로 활용될 수 있습니다.
주요 특징
- 시장 역학 : 네트워크 토큰화 도입 촉진 요인 및 장벽 등 주요 시장 동향과 시장 확대 과제에 대한 인사이트를 제공합니다. 보고서는 네트워크 토큰화가 결제 경험에 미치는 영향, 네트워크 토큰화가 IoT 결제를 촉진하는 데 있어 네트워크 토큰화의 역할, 네트워크 토큰화가 구독 비즈니스와 같은 산업 부문에 미치는 영향의 차이 등을 다루고 있습니다. 또한, 주요 8개 지역의 현재 발전 상황과 성장 부문에 대한 국가별 준비도 지수 및 향후 전망도 함께 수록했습니다.
- 주요 요점 및 전략적 제안 : 네트워크 토큰화 시장의 주요 발전 기회와 통찰력을 상세히 분석하고, 이해관계자를 위한 전략적 제안을 제시합니다.
- 벤치마크 산업 예측 : 네트워크 토큰화 데이터 세트에는 네트워크 토큰화 시장 규모와 네트워크 토큰의 프로비저닝 및 관리로 인한 총 수익을 포함한 네트워크 토큰화 시장 규모와 다양한 시장 부문의 트랜잭션 수에 대한 예측이 포함되어 있습니다.
- Juniper Research의 경쟁 리더보드 : 주요 기업의 시장 규모를 게재하고, 12개의 네트워크 토큰화 벤더의 역량을 평가합니다.
샘플보기
시장 데이터 및 예측 보고서
시장 동향 및 전략 보고서
시장 데이터 & 예측 보고서
이 조사 제품군에는 43개의 표와 15,480개의 데이터 포인트에 대한 예측 데이터세트에 대한 액세스가 포함되어 있습니다. 이 조사 제품군에는 다음과 같은 지표가 포함되어 있습니다:
- 네트워크 토큰화 시장의 총 거래, 토큰, 수익
- 네트워크 토큰화 시장의 총 거래 및 수익 : 아래 분류별
- NFC 모바일 결제
- 원격 모바일 결제
- 원격 PC 및 데스크톱 결제
- IoT 결제
목차
시장 동향·전략
제1장 중요 포인트와 전략적 추천사항
- 중요 포인트
- 전략적 추천사항
제2장 시장 상황
- 네트워크 토큰화 프로세스 : 주요 관계자
- PCI 토큰화와 네트워크 토큰화
- 구독 경제의 네트워크 토큰
- 일회용 토큰
- 사기에 대한 대처
- 도입 장벽
- 규제의 영향
- 네트워크 토큰화의 이점
제3장 부문 분석
- E-Commerce
- 모바일 결제
- NFC 모바일 거래
- IoT 토큰화
제4장 국가별 준비 지수
- 국가별 준비 지수 : 소개
- 중점 시장
- 성장 시장
- 신흥 시장
경쟁 리더보드
제1장 경쟁 리더보드
제2장 기업 개요
- 네트워크 토큰화 벤더 개요
- Adyen
- Carta Worldwide
- Fiserv
- G+D
- IDEMIA Secure Transactions
- IXOPAY
- Pagos
- PayPal Braintree
- Spreedly
- Thales
- VGS
- Worldpay
- 평가 방법
데이터 & 예측
제1장 시장 개요
제2장 시장 개요
- 네트워크 토큰화 거래 총수
- 네트워크 토큰 연간 사용 총수
- 네트워크 토큰화 연간 수익
제3장 E-Commerce 토큰화
- 거래 총수
- 토큰 연간 사용 총수
- 토큰 프로비저닝에 의한 연간 수익
- 네트워크 토큰 관리에 의한 연간 수익
제4장 원격 모바일 결제 네트워크 토큰화
- 거래 총수
- 토큰 연간 사용 총수
- 토큰 프로비저닝에 의한 연간 수익
- 네트워크 토큰 관리에 의한 연간 수익
제5장 NFC 모바일 네트워크 토큰화
- 거래 총수
- 토큰 연간 사용 총수
- 토큰 프로비저닝에 의한 연간 수익
- 네트워크 토큰 관리에 의한 연간 수익
제6장 IoT 네트워크 토큰화
- 거래 총수
- 토큰 연간 사용 총수
- 토큰 프로비저닝에 의한 연간 수익
- 네트워크 토큰 관리에 의한 연간 수익
'Network Tokenised Transactions to Reach 574 Billion Globally in 2029'
| KEY STATISTICS | |
|---|---|
| Total network tokenisation revenue in 2025: | $4.1bn |
| Total network tokenisation revenue in 2029: | $8.9bn |
| 2025 to 2029 market growth: | 117.3% |
| Forecast period: | 2024-2029 |
Overview
Our "Network Tokenisation" research suite provides a comprehensive and in-depth analysis of the ecosystem surrounding network tokenisation, enabling stakeholders such as merchants, payment gateways, token service providers and token requestors to understand future growth, key trends and the competitive environment. The report includes an assessment of the benefits of network tokenisation, the impact of Click to Pay on the eCommerce sector, and the regions which are leading network tokenisation.
The suite includes several different options that can be purchased separately, including access to data mapping the future growth of network tokenisation, an insightful study uncovering the latest trends and opportunities within the financial markets, and a document containing extensive analysis of the 12 market leaders facilitating network tokenisation. The coverage can also be purchased as a Full Research Suite, containing all these elements, at a substantial discount.
This report serves as an essential resource for understanding the rapidly evolving network tokenisation market, empowering stakeholders to shape effective future strategies. With its comprehensive insights and extensive coverage, this research suite is an invaluable tool for navigating and planning in a fast-growing landscape.
Key Features
- Market Dynamics: Insights into key trends and market expansion challenges within the network tokenisation market, including drivers and barriers for network tokenisation adoption. The report addresses the impact that network tokenisation can have on the checkout experience; the role that network tokenisation plays in facilitating IoT payments; and the differential impact that network tokens can have on industry segments such as subscription businesses. The research also features a Country Readiness Index on the current development and segment growth of the network tokenisation market across eight key regions, as well as providing a future outlook.
- Key Takeaways & Strategic Recommendations: In-depth analysis of key development opportunities and findings within the network tokenisation market, accompanied by strategic recommendations for stakeholders.
- Benchmark Industry Forecasts: The network tokenisation dataset includes forecasts for total value of the network tokenisation market, including the total revenue to be gained through provisioning and managing network tokens, and the transaction volume of various market segments.
- Juniper Research Competitor Leaderboard: Key market player capability and capacity assessment for 12 network tokenisation vendors, via the Juniper Research Competitor Leaderboard; featuring market size for major players in the network token platform market.
SAMPLE VIEW
Market Data & Forecasting Report

The numbers tell you what's happening, but our written report details why, alongside the methodologies.
Market Trends & Strategies Report

A comprehensive analysis of the current market landscape, alongside strategic recommendations.
Market Data & Forecasting Report
The market-leading research suite for the "Network Tokenisation" market includes access to the full set of forecast data of 43 tables and 15,480 datapoints. Metrics in the research suite include:
- Total Transaction Volume, Tokens, and Revenue Received from the Network Token Market
- Total Transaction Volume and Revenue of the Network Tokenisation Market, Split by the Following Market Segments:
- NFC Mobile Payments
- Remote Mobile Payments
- Remote PC and Desktop Payments
- IoT Payments
Juniper Research's Interactive Forecast Excel contains the following functionality:
- Statistics Analysis: Users benefit from the ability to search for specific metrics, displayed for all regions and countries across the data period. Graphs are easily modified and can be exported to the clipboard.
- Country Data Tool: This tool lets users look at metrics for all regions and countries in the forecast period. Users can refine the metrics displayed via a search bar.
- Country Comparison Tool: Users can select and compare specific countries. The ability to export graphs is included in this tool.
- What-if Analysis: Here, users can compare forecast metrics against their own assumptions, via five interactive scenarios.
Market Trends & Strategies Report
This report examines the "Network Tokenisation" market landscape in depth; assessing trends and factors shaping the evolution of this rapidly growing market. The report delivers comprehensive analysis of the strategic opportunities for payment processors and network tokenisation platforms; addressing key verticals such as eCommerce, in-store, and IoT use of network tokens. This report also includes evaluation of key country-level opportunities for stakeholders in the network tokenisation market.
Competitor Leaderboard Report
The Competitor Leaderboard report provides a detailed evaluation and market positioning for 12 leading vendors in the "Network Tokenisation" space. The vendors are positioned as established leaders, leading challengers, or disruptors and challengers, based on capacity and capability assessments:
|
|
This document is centred around the Juniper Research Competitor Leaderboard; a vendor positioning tool that provides an at-a-glance view of the competitive landscape in a market, backed by a robust methodology.
Table of Contents
Market Trends & Strategies
1. Key Takeaways & Strategic Recommendations
- 1.1. Key Takeaways
- 1.2. Strategic Recommendations
2. Market Landscape
- 2.1. Introduction
- 2.1.1. A Timeline of Network Tokenisation
- 2.2. Process of Network Tokenisation: Key Actors
- Figure 2.1: The Process of Network Token Provisioning and Use
- 2.3. PCI Tokenisation vs Network Tokenisation
- Figure 2.2: Comparison of PCI Tokens and Merchant Tokens
- 2.4. Network Tokens in a Subscription Economy
- 2.5. Single-use Tokens
- 2.6. Addressing Fraud
- Figure 2.3: Total Value of Fraudulent Digital Good Transactions ($m), Split across 8 Key Regions, 2024-2029
- 2.7. Barriers to Adoption
- 2.8. Regulatory Effects
- i. Payment Services Directive (PSD)2/PSD3
- 2.8. Benefits of Network Tokenisation
3. Segment Analysis
- 3.1. Introduction
- 3.2. eCommerce
- Figure 3.1: Total eCommerce Transaction Value ($m), Split by 8 Key Regions, 2024-2029
- Figure 3.2: Mastercard Click to Pay
- Figure 3.3: Click to Pay Implementation Ecosystem
- 3.2.2. Mobile Payments
- Figure 3.4: Total Number of Remote Mobile Transactions (m), 2024-2029, Split by 8 Key Regions
- 3.2.3. NFC Mobile Transactions
- Figure 3.5: NFC Retail Transaction Volume, 2024-2029, Split by 8 Key Regions
- 3.3. IoT Tokenisation
4. Country Readiness Index
- 4.1. Introduction to Country Readiness Index
- Figure 4.1: Network Tokenisation Country Readiness Index: Regional Definitions
- Table 4.2: Juniper Research Country Readiness Scoring Index: Network Tokenisation
- Figure 4.3: Juniper Research Country Readiness Index: Network Tokenisation
- Table 4.4: Network Tokenisation Country Readiness Index: Market Segments
- 4.2. Focus Market
- Figure 4.5: Total Number of Network Tokenised Transactions (m), Split by Top Countries, 2024-2029
- i. Emerging Markets with Rapid Digital Payment Adoption
- ii. Developed Economies with Strong eCommerce Markets
- 4.2.2. Investment in Fraud Detection and Prevention
- i. India
- 4.3. Growth Market
- Figure 4.6: Total Network Tokenisation Revenue ($m) for Notable Growth Markets, 2024-2029
- i.Growth in Card Penetration
- 4.4. Saturated Market
- Figure 4.7: Network Tokenisation Revenue ($m) from Nine Notable Saturated Markets, 2024-2029
- i. High Card Penetration
- ii. Opportunities: IoT
- 4.5. Developing Markets
- i. Cash Reliance
- Figure 4.8: Total Network Tokenisation Revenue ($m) for Notable Developing Markets, 2024-2029
- ii. Leapfrogging of Cards
- Table 4.9: Juniper Research's Country Readiness Index Heatmap: North America
- Table 4.10: Juniper Research's Country Readiness Index Heatmap: Latin America
- Table 4.11: Juniper Research's Country Readiness Index Heatmap: West Europe
- Table 4.12: Juniper Research's Country Readiness Index Heatmap: Central & Eastern Europe
- Table 4.13: Juniper Research's Country Readiness Index Heatmap: Far East & China
- Table 4.14: Juniper Research's Country Readiness Index Heatmap: Indian Subcontinent
- Figure 4.15: Juniper Research's Country Readiness Index Heatmap: Rest of Asia Pacific
- Table 4.16: Juniper Research's Country Readiness Index Heatmap: Africa & Middle East
- i. Cash Reliance
Competitor Leaderboard
1. Competitor Leaderboard
- 1.1. Why Read This Report
- Figure 1.1: Juniper Research Competitor Leaderboard Vendors: Network Tokenisation
- Figure 1.2: Juniper Research Competitor Leaderboard: Network Tokenisation
- Figure 1.3: Juniper Research Competitor Leaderboard: Network Tokenisation Vendor Ranking
- Table 1.4: Juniper Research Competitor Leaderboard Network Tokenisation - Heatmap
2. Company Profiles
- 2.1. Network Tokenisation Vendor Profiles
- 2.1.1. Adyen
- i. Corporate
- Table 2.1: Adyen's Revenue and Growth, ( Euro billion), 2021-2023
- ii. Geographical Spread
- iii. Key Clients & Strategic Partnerships
- iv. High-level View of Offerings
- v. Juniper Research's View: Key Strengths & Strategic Opportunities
- i. Corporate
- 2.1.2. Carta Worldwide
- i. Corporate
- ii. Geographical Spread
- iii. Key Clients & Strategic Partnerships
- Figure 2.2: Carta Worldwide Fintech Customers
- iv. High-level View of Offerings
- v. Juniper Research's View: Key Strengths & Strategic Opportunities
- 2.1.3. Fiserv
- i. Corporate
- Figure 2.3: Fiserv's Financial Information Snapshot ($b)
- ii. Geographical Spread
- iii. Key Clients & Strategic Partnerships
- iv. High-level View of Offerings
- Figure 2.4: Fiserv's Role in Tokenisation
- v. Juniper Research's View: Key Strengths & Strategic Opportunities
- i. Corporate
- 2.1.4. G+D
- i. Corporate
- ii. Geographical Spread
- iii. Key Clients & Strategic Partnerships
- iv. High-level View of Offerings
- Figure 2.5: Visualisation of G+D Convego Service Broker
- v. Juniper Research's View: Key Strengths & Strategic Opportunities
- 2.1.5. IDEMIA Secure Transactions
- i. Corporate
- ii. Geographical Spread
- iii. Key Clients & Strategic Partnerships
- iv. High-level View of Offerings
- v. Juniper Research's View: Key Strengths & Strategic Opportunities
- 2.1.6. IXOPAY
- i. Corporate
- ii. Geographical Spread
- iii. Key Clients & Strategic Partnerships
- iv. High-level View of Offerings
- Figure 2.6: How IXOPAY's platform works
- v. Juniper Research's View: Key Strengths & Strategic Opportunities
- 2.1.7. Pagos
- i. Corporate
- ii. Geographical Spread
- iii. Key Clients & Strategic Partnerships
- iv. High-level View of Offerings
- Figure 2.7: Pagos' Visualise, Analyse, Detect, Act, Repeat!
- v. Juniper Research's View: Key Strengths & Strategic Opportunities
- 2.1.8. PayPal Braintree
- i. Corporate
- ii. Geographical Spread
- iii. Key Clients & Strategic Partnerships
- iv. High-level View of Offerings
- Figure 2.8: Braintree Direct Product
- v. Juniper Research's View: Key Strengths & Strategic Opportunities
- 2.1.9. Spreedly
- i. Corporate
- ii. Geographical Spread
- iii. Key Clients & Strategic Partnerships
- iv. High-level View of Offerings
- v. Juniper Research's View: Key Strengths & Strategic Opportunities
- 2.1.10. Thales
- i. Corporate
- Figure 2.9: Thales' Financial Snapshot ($ Euro), FY 2023-2022
- ii. Geographical Spread
- iii. Key Clients & Strategic Partnerships
- iv. High-level View of Offerings
- v. Juniper Research's View: Key Strengths & Strategic Opportunities
- i. Corporate
- 2.1.11. VGS
- i. Corporate
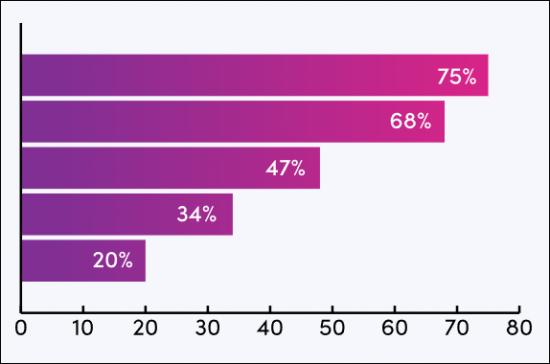
- Founded in 2015 as Very Good Security, VGS is a cloud-based tokenisation platform built to facilitate payments across channels and comply with PCI standards. As part of the VGS mission to protect the world's sensitive data, VGS provides large banks, aspiring fintechs, and growing merchants with a universal token vault. VGS provides solutions for Fortune 500 companies and as a result has 4 billion tokens held globally, 30 million annual interactions, and stores 70% all US cards.
- ii. Geographic Spread
- iii. Key Clients & Strategic Opportunities
- iv. High-level View of Offerings
- v. Juniper Research's View: Key Strengths & Strategic Opportunities
- i. Corporate
- 2.1.12. Worldpay
- i. Corporate
- ii. Geographical Spread
- iii. Key Clients & Strategic Partnerships
- iv. High-level View of Offerings
- v. Juniper Research's View: Key Strengths & Strategic Opportunities
- 2.1.1. Adyen
- 2.2. Juniper Research Leaderboard Assessment Methodology
- 2.2.1. Limitations & Interpretations
- Table 2.10: Juniper Research Leaderboard Assessment Criteria: Network Tokenisation
- 2.2.1. Limitations & Interpretations
Data & Forecasting
1. Market Overview
- 1.1. Introduction
- 1.2. Methodology & Assumptions
- Figure 1.1. eCommerce Network Tokenisation Methodology
- Figure 1.2. Mobile Payment Network Tokenisation Methodology
- Figure 1.3. IoT Network Tokenisation Methodology
- Figure 1.4:NFC Mobile Network Tokenisation Methodology
2. Market Summary
- 2.1. Total Number of Network Tokenised Transactions
- Figure & Table 2.1: Total Volume of Network Tokenised Transactions (m), Split 8 Key Regions, 2024-2029
- 2.1.1. Total Number of Network Tokens in Use per Annum
- Figure & Table 2.2: Total Network Tokens Used per Annum (m), Split by 8 Key Regions, 2024-2029
- 2.1.2. Total Network Tokenisation Revenue per Annum ($m)
- Figure 2.3: Total Network Tokenisation Revenue per Annum, ($m), Split across Key Regions, 2024-2029
3. eCommerce Tokenisation
- 3.1.1. Total Volume of eCommerce Network Tokenisation Transactions
- Figure & Table 3.1: Total Number of PC eCommerce Network Tokenised Transactions (m), Split by 8 Key Regions, 2024-2029
- 3.1.2. Total Number of eCommerce Network Tokens in Use per Annum
- Figure & Table 3.2: Number of PC eCommerce Network Tokens in Use (m), Split by 8 Key Regions, 2024-2029
- 3.1.3. Revenue from eCommerce Network Token Provisioning per Annum
- Figure & Table 3.3: Revenue from eCommerce Network Token Provisioning per Annum ($m), Split by 8 Key Regions, 2024-2029
- 3.1.4. Revenue from eCommerce Network Token Management per Annum
- Figure & Table 3.4: Revenue for eCommerce Network Token Management per Annum ($m), Split by 8 Key Regions, 2024-2029
4. Remote Mobile Payments Network Tokenisation
- 4.1.1. Total Volume of Remote Mobile Payments Network Tokenised Transactions
- Figure & Table 4.1: Total Remote Mobile Payments Network Tokenised Transactions (m), Split by 8 Key Regions, 2024-2029
- 4.1.2. Total Number of Mobile Network Tokens in Use per Annum
- Figure & Table 4.2: Total Number of Mobile Network Tokens in Use per Annum (m), Split by 8 Key Regions, 2024-2029
- 4.1.3. Revenue from Mobile Payment Network Token Provisioning per Annum
- Figure &Table 4.3: Mobile Payment Network Token Provisioning Revenue ($m), Split by 8 Key Regions, 2024-2029
- 4.1.4. Revenue from Mobile Payment Network Token Management per Annum
- Figure & Table 4.4: Mobile Payment Network Token Management Revenue ($m), Split by 8 Key Regions, 2024-2029
5. NFC Mobile Network Tokenisation
- 5.1.1. Total Number of NFC Mobile Network Tokenised Transactions
- Figure & Table 5.1: Total Number of NFC Mobile Network Tokenised Transactions (m), Split by 8 Key Regions, 2024-2029
- 5.1.2. Total Number of NFC Mobile Network Tokens in Use
- Figure & Table 5.2: Total Number of NFC Mobile Network Tokens in Use (m), Split by 8 Key Regions, 2024-2029
- 5.1.3. Revenue from NFC Mobile Network Token Provisioning per Annum
- Figure & Table 5.3: Revenue from NFC Mobile Network Provisioning per Annum ($m), Split by 8 Key Regions, 2024-2029
- 5.1.4. Revenue from NFC Network Token Management per Annum
- Figure & Table 5.4: Revenue from NFC Network Token Management ($m), Split by 8 Key Regions, 2024-2029
6. IoT Network Tokenisation
- 6.1.1. Total Number of IoT Network Tokenised Transactions
- Figure & Table 6.1: Total Number of IoT Network Tokenised Transactions (m), Split by 8 Key Regions, 2024-2029
- 6.1.2. Total Number of IoT Network Tokens in Use
- Figure & Table 6.2: Total Number of Network Tokens in Use (m), Split by 8 Key Regions, 2024-2029
- 6.1.3. Total Revenue from IoT Network Token Provisioning per Annum
- Figure & Table 6.3: Total Revenue from IoT Network Provisioning per annum (m), Split by 8 Key Regions, 2024-2029
- 6.1.4. Revenue from IoT Network Token Management per Annum
- Figure & Table 6.4: Revenue from IoT Network Token Management ($m), Split 8 Key Regions, 2024-2029
(주말 및 공휴일 제외)


