|
시장보고서
상품코드
1686672
거래 감시 시스템 시장(2025-2029년)Global Trade Surveillance Systems Market: 2025-2029 |
||||||
'규제 강화 가운데 거래 감시 시스템 지출액은 2029년 49억 달러에 이를 전망'
| 주요 통계 | |
|---|---|
| 총 지출액(2025년) | 27억 달러 |
| 총 지출액(2029년) | 49억 달러 |
| 시장 성장률(2025-2029년) | 85% |
| 예측 기간 | 2025-2029년 |
이 조사 보고서는 진화하는 시장의 현재 상태를 자세히 분석합니다. 이 설문조사에서는 금융시장 및 컴플라이언스 분야의 주요 동향을 평가하고, 컴플라이언스 팀에 영향을 미치는 주요 촉진요인 및 과제(컴플라이언스 비용 상승, 시장 변동성 및 복잡성 증가, 벤더에 의한 AI 및 기타 차세대 기술 채용 상황 등)를 정리했습니다. 또한 본 보고서에서는 Juniper Research의 거래 감시 시스템의 경쟁 리더보드에서 벤더 16개사를 자리 매김하고 그 제품과 위치를 능력에 비추어 평가했습니다. 이 보고서는 거래 모니터링 시스템 시장을 이해하는 중요한 도구로, 거래 모니터링 시스템 분야공급업체가 향후 전략을 수립하는 데 도움이 됩니다.
또한 본 조사에서는 시장의 업계 벤치마크 예측을 다음 부문별, 주요 8개 지역별, 61개국별로 제공합니다.
- 대기업 금융 기관(세계 규모의 은행 및 대형 증권 회사)
- 중견 금융 기관(지역 규모의 은행 및 자산 운용 회사)
- 소규모 금융기관(비스포크 거래회사 및 개인 브로커)
- 기타(거래소, 규제 기관)
주요 특징
- 시장 역학 : 새로운 규제로 인한 과제에 대한 대응, 시장 횡단적이고 플랫폼 횡단적인 모니터링에 대한 수요 증가, 컴플라이언스 팀의 부담 경감 등 거래 감시 시스템 시장의 주요 동향 및 시장 과제에 대한 인사이트를 제공합니다. 또한 거래 감시 시스템이 중점적으로 검지해야 할 시장 남용의 주요 분야에 초점을 맞추어 금융범죄의 현상을 평가했습니다. 또한 이 보고서에는 부문 분석이 포함되어 있으며 대기업, 중견, 중소 금융 기관 및 거래소 및 규제 기관과 같은 거래 모니터링 시스템을 사용하는 기타 비즈니스에 대해 시장을 나눕니다.
- 주요 요점 및 전략적 제안 : 거래 모니터링 시스템 시장에서 주요 발전 기회와 지식을 상세하게 분석하고 거래 모니터링 기술의 리더와 같은 이해관계자에게 전략적 제안을 제공합니다.
- 벤치마크 업계 예측 : 타사 거래 감시 시스템을 이용하는 기업의 총수, 제3자 거래 감시 시스템에 대한 총 지출을 산업별, 사업 규모별로 정리한 종합적인 데이터 및 예측을 제공합니다.
- Juniper Research의 경쟁 리더보드 : 거래 모니터링 시스템 공급업체 16개 기업의 능력을 평가하고 거래 모니터링 시스템 분야의 주요 기업 시장 규모를 게시합니다.
시장 데이터 및 예측
설문조사 제품군에는 37개의 테이블과 13,500개 이상의 데이터 포인트를 포함한 예측 데이터 세트에 대한 액세스가 포함되어 있습니다. 설문조사 스위트에는 다음 측정 항목이 포함됩니다.
- 타사 거래 감시 시스템을 이용하는 총 기업 수
- 타사 거래 감시 시스템에 대한 총 지출액
지표는 다음 기업에 대해 제공됩니다.
- 대기업 금융 기관(세계 규모의 은행 및 대형 증권 회사)
- 중견 금융 기관(지역 규모의 은행 및 자산 운용 회사)
- 소규모 금융기관(비스포크 거래회사 및 개인 브로커)
- 기타(거래소, 거래소, 규제 기관)
Juniper Research의 대화형 예측(Excel)에는 다음과 같은 기능이 있습니다.
- 통계 분석 : 데이터 기간 동안 모든 지역 및 국가에 대해 표시되며 특정 측정항목을 검색할 수 있습니다. 그래프는 쉽게 수정할 수 있으며 클립보드로 내보낼 수 있습니다.
- 국가별 데이터 도구 : 예측 기간 동안 모든 지역 및 국가 측정항목을 볼 수 있습니다. 검색창에 표시되는 측정항목을 필터링할 수 있습니다.
- 국가별 비교 도구 : 국가를 선택하고 비교할 수 있습니다. 이 도구에는 그래프 내보내기 기능이 포함되어 있습니다.
SAMPLE VIEW
시장 동향 PDF 보고서

현재 시장 상황을 종합적으로 분석하고 전략적 권장 사항 및 예측 워크스루를 게재
목차
제1장 중요 포인트 및 전략적 권장 사항
- 중요 포인트
- 전략적 권장 사항
제2장 거래 감시 시스템 시장 : 요약
- 서문
- 거래 감시 시스템의 경위
- 현재 상황
- 규제 상황
- 금융 상품 시장 지침 II(MiFID II)
- 유럽연합 시장 남용 규제(EU MAR)
- 영국 시장 남용 규제(UK MAR)
- 도드-프랭크 월스트리트 개혁 및 소비자 보호법(도드-프랭크법)
- 규칙 15c3-5
- 새로운 알고리즘 거래 규칙
- 금융상품거래법(FIEA)
- 싱가포르 통화청(MAS)
- 금융범죄의 포트레이트
- 시장 남용의 유형
- 가격조작
- 순환거래
- 내부 정보의 악용
- 거래 기반 돈세탁(TBML)
- 가격에 미치는 영향
- 부적절한 주문 처리
- 오해를 초래하는 행위
- 시장 남용의 유형
- 성장 촉진요인
- 규제 압력
- 기술 혁신
- 시장의 복잡성
- 데이터 거버넌스
- 과제
- 오검지
- 컴플라이언스 팀에 압력
- 크로스 제품 감시
제3장 부문 분석
- 부문 분석
- 대기업 금융기관
- 중규모 금융기관
- 중소규모 금융기관
- 기타 사업
제4장 경쟁 리더보드
- 이 보고서를 읽어야 하는 이유
- 벤더 프로파일
- ACA Group
- Aquis Exchange
- b-next
- eflow Global
- Eventus Systems
- FIS
- Nasdaq
- Nexi Group
- NICE Actimize
- Scila
- Software AG
- SteelEye
- SymphonyAI Sensa
- Trading Technologies
- TradingHub
- Trapets
제5장 데이터 및 예측
- 조사 방법 및 전제
- 거래 감시 시스템 시장
- 거래 감시 시스템에 총 지출
- 대기업 금융 기관에 의한 타사 거래 감시 시스템에 대한 총 지출액
- 중규모 금융기관에 의한 타사 감시 시스템에 대한 총 지출액
- 중소규모 금융기관에 의한 타사 거래 감시 시스템에 대한 총 지출액
- 다른 기업에 의한 제3자의 거래 감시 시스템에 대한 총 지출액
'Trade Surveillance Systems Spend to Reach $4.9 Billion by 2029, Amid Escalating Regulatory Scrutiny'
| KEY STATISTICS | |
|---|---|
| Total spend in 2025: | $2.7bn |
| Total spend in 2029: | $4.9bn |
| Market growth 2025-2029: | 85% |
| Forecast period: | 2025-2029 |
Overview
Our "Trade Surveillance Systems" research report provides in-depth analysis of the state of this evolving market. The research evaluates key trends in the financial markets and compliance sectors, alongside the main drivers and challenges affecting compliance teams; such as the rising cost of compliance, increasing market volatility and complexity, and how vendors are adopting AI and other next-generation technologies. The report also positions 16 vendors across the Juniper Research Competitor Leaderboard for trade surveillance systems; assessed on their products and positioning against their capability and capacity. Collectively, the report provides a critical tool for understanding the trade surveillance systems market; enabling vendors in the trade surveillance systems space to shape their future strategy.
The research also provides industry benchmark forecasts for the market, split by the following segments, as well as by our 8 key regions and 61 countries:
- Large Financial Institutions (Global Banks and Major Brokerages)
- Medium Financial Institutions (Regional Banks and Asset Management Firms)
- Small Financial Institutions (Bespoke Trading Firms and Individual Brokers)
- Other Businesses (Trading & Exchange Venues and Regulatory Bodies)
Key Features
- Market Dynamics: Insights into key trends and market challenges within the trade surveillance systems market; addressing challenges posed by emerging regulations, increased demand for cross-market and cross-platform monitoring, and the reduction of workload on compliance teams. It also evaluates the state of the financial crime landscape; highlighting key areas of market abuse that trade surveillance systems should focus on detecting. The report includes a segment analysis, which has market splits for large, medium, and small financial institutions, and other businesses that use trade surveillance systems; such as trading and exchange venues, and regulatory bodies.
- Key Takeaways & Strategic Recommendations: In-depth analysis of key development opportunities and findings within the trade surveillance systems market, accompanied by strategic recommendations for stakeholders, such as leaders in trade surveillance technology.
- Benchmark Industry Forecasts: A suite of comprehensive data and forecasts highlighting the total number of businesses using third-party trade surveillance systems, and total spend on third-party trade surveillance systems, split by business sector and business size; covering large, medium, and small financial institutions, and other businesses, such as trading venues and regulators.
- Juniper Research Competitor Leaderboard: Key player capability and capacity assessment for 16 trade surveillance systems vendors, via the Juniper Research Competitor Leaderboard, featuring market size for major players in the trade surveillance systems sector.
- ACA Group
- Aquis
- b-next
- eflow
- Eventus Systems
- FIS
- Nasdaq
- Nexi Group
- NICE Actimize
- Scila
- Software AG
- SteelEye
- SymphonyAI
- Trading Technologies
- TradingHub
- Trapets
Market Data & Forecasts
The market-leading research suite for the "Trade Surveillance Systems" market includes access to the full set of forecast data, with 37 tables and over 13,500 datapoints. Metrics in the research suite include:
- Total Number of Businesses Using Third-party Trade Surveillance Systems
- Total Spend on Third-party Trade Surveillance Systems
Metrics are provided for the following businesses:
- Large Financial Institutions (Global Banks and Major Brokerages)
- Medium Financial Institutions (Regional Banks and Asset Management Firms)
- Small Financial Institutions (Bespoke Trading Firms and Individual Brokers)
- Other Businesses (Trading and Exchange Venues, and Regulatory Bodies)
Juniper Research Interactive Forecast Excel contains the following functionality:
- Statistics Analysis: Users benefit from the ability to search for specific metrics; displayed for all regions and countries across the data period. Graphs are easily modified and can be exported to the clipboard.
- Country Data Tool: This tool lets users look at metrics for all regions and countries in the forecast period. Users can refine the metrics displayed via a search bar.
- Country Comparison Tool: Users can select and compare countries. The ability to export graphs is included in this tool.
SAMPLE VIEW
Market Trends & Forecasts PDF Report
A comprehensive analysis of the current market landscape, alongside strategic recommendations and a walk-through of the forecasts.
Table of Contents
1. Key Takeaways & Strategic Recommendations
- 1.1. Key Takeaways
- 1.2. Strategic Recommendations
2. Trade Surveillance Systems Market Summary
- 2.1. Introduction
- 2.1.1. The History of Trade Surveillance Systems
- 2.1.2. The Current Landscape
- Figure 2.1: Global Spend on Third-party Trade Surveillance Systems ($m), 2024-2029, Split by 8 Key Regions: ($4.9 billion by 2029)
- Figure 2.2: How Do Trade Surveillance Systems Work?
- Figure 2.3: Trade Surveillance Systems - Solution Categories
- 2.1.3. Regulatory Landscape
- Figure 2.4: Key Global Market Abuse Regulations/Regulatory Bodies
- i. The Markets in Financial Instruments Directive II (MiFID II)
- ii. The European Union Market Abuse Regulation (EU MAR)
- iii. The UK Market Abuse Regulation (UK MAR)
- iv. Dodd-Frank Wall Street Reform and Consumer Protection Act (Dodd-Frank Act)
- v. Rule 15c3-5
- vi. New Algorithm Trading Rules
- vii. The Financial Instruments and Exchange Act (FIEA)
- viii. The Monetary Authority of Singapore (MAS)
- 2.2. Portrait of Financial Crime
- 2.2.1. Types of Market Abuse
- Figure 2.5: Types of Market Abuse
- i. Price Manipulation
- ii. Circular Trading
- iii. Misuse of Insider Knowledge
- iv. Trade-based Money Laundering (TBML)
- v. Price Influencing
- vi. Improper Order Handling
- vii. Misleading Conduct
- 2.2.1. Types of Market Abuse
- 2.3. Drivers
- 2.3.1. Regulatory Pressure
- 2.3.2. Technological Innovation
- 2.3.3. Market Complexity
- 2.3.4. Data Governance
- 2.4. Challenges
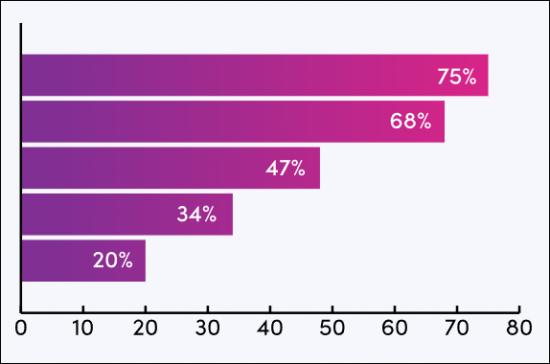
- 2.4.1. False Positives
- Figure 2.6: Acuiti Trade Surveillance Market Review Survey
- 2.4.2. Pressure On Compliance Teams
- 2.4.3. Cross-product Surveillance
- 2.4.1. False Positives
3. Segment Analysis
- 3.1. Segment Analysis
- Figure 3.1: Total Spend on Third-party Trade Surveillance Systems ($m), 2029, Split by Segment - $4.9 Billion
- 3.1.1. Large Financial Institutions
- Figure 3.2: Global Spend on Third-party Trade Surveillance Systems by Large ($m), 2024-2029
- 3.1.2. Medium-sized Financial Institutions
- Figure 3.3: Global Spend on Third-party Trade Surveillance Systems by Mediumsized FIs ($m), 2024-2029
- 3.1.3. Small-sized Financial Institutions
- Figure 3.4: Global Spend on Third-party Trade Surveillance Systems by Small FIs ($m), 2024-2029
- 3.1.4. Other Businesses
- Figure 3.5: Global Spend on Third-party Trade Surveillance Systems by Other Businesses ($m), 2024-2029
4. Competitor Leaderboard
- 4.1. Why Read This Report
- Figure 4.1: Juniper Research Competitor Leaderboard Vendors: Trade Surveillance Systems
- Figure 4.2: Juniper Research Competitor Leaderboard: Trade Surveillance Systems Vendors
- Figure 4.3: Juniper Research Competitor Leaderboard: Trade Surveillance Systems Vendors Ranking
- Table 4.4: Juniper Research Trade Surveillance Systems Market: Heatmap Results (Part 1 of 2)
- Table 4.5: Juniper Research Trade Surveillance Systems Market: Heatmap Results (Part 2 of 2)
- 4.2. Vendor Profiles
- 4.2.1. ACA Group
- i. Corporate
- ii. Geographical Spread
- iii. Key Clients & Strategic Partnerships
- iv. High-level View of Offerings
- v. Juniper Research's View: Key Strengths & Strategic Development Opportunities
- 4.2.2. Aquis Exchange
- i. Corporate
- Figure 4.6: Aquis' Financial Snapshot ($m), (Converted from GBP at 1.24)
- ii. Geographical Spread
- iii. Key Clients & Strategic Partnerships
- iv. High-level View of Offerings
- v. Juniper Research's View: Key Strengths & Strategic Development Opportunities
- i. Corporate
- 4.2.3. b-next
- i. Corporate
- ii. Geographical Spread
- iii. Key Clients & Strategic Partnerships
- iv. High-level View of Offerings
- v. Juniper Research's View: Key Strengths & Strategic Development Opportunities
- 4.2.4. eflow Global
- i. Corporate
- ii. Geographical Spread
- iii. Key Clients & Strategic Partnerships
- iv. High-level View of Offerings
- v. Juniper Research's View: Key Strengths & Strategic Development Opportunities
- 4.2.5. Eventus Systems
- i. Corporate
- ii. Geographical Spread
- iii. Key Clients & Strategic Partnerships
- iv. High-level View of Offerings
- v. Juniper Research's View: Key Strengths & Strategic Development Opportunities
- 4.2.6. FIS
- i. Corporate
- Figure 4.7: FIS Financial Snapshot ($m), 2021-2024
- ii. Geographical Spread
- iii. Key Clients & Strategic Partnerships
- iv. High-level View of Offerings
- v. Juniper Research's View: Key Strengths & Strategic Development Opportunities
- i. Corporate
- 4.2.7. Nasdaq
- i. Corporate
- ii. Geographical Spread
- iii. Key Clients & Strategic Partnerships
- iv. High-level View of Offerings
- v. Juniper Research's View: Key Strengths & Strategic Development Opportunities
- 4.2.8. Nexi Group
- i. Corporate
- Figure 4.8: Nexi Group's Financial Snapshot ($m) Converted from Euro at 1.05
- ii. Geographical Spread
- iii. Key Clients & Strategic Partnerships
- iv. High-level View of Offerings
- v. Juniper Research's View: Key Strengths & Strategic Development Opportunities
- i. Corporate
- 4.2.9. NICE Actimize
- i. Corporate
- Table 4.9: NICE Actimize's Financial Performance ($m), 2020-2023
- ii. Geographical Spread
- iii. Key Clients & Strategic Partnerships
- iv. High-level View of Offerings
- v. Juniper Research's View: Key Strengths & Strategic Development Opportunities
- i. Corporate
- 4.2.10. Scila
- i. Corporate
- ii. Geographical Spread
- iii. Key Clients & Strategic Partnerships
- iv. High-level View of Offerings
- v. Juniper Research's View: Key Strengths & Strategic Development Opportunities
- 4.2.11. Software AG
- i. Corporate
- Figure 4.10: Software AG's Financial Snapshot ($m), converted from Euro at 1.05
- ii. Geographical Spread
- iii. Key Clients & Strategic Partnerships
- iv. High-level View of Offerings
- Figure 4.11: Software AG's Market Surveillance
- v. Juniper Research's View: Key Strengths & Strategic Development Opportunities
- i. Corporate
- 4.2.12. SteelEye
- i. Corporate
- ii. Geographical Spread
- iii. Key Clients & Strategic Partnerships
- iv. High-level View of Offerings
- Figure 4.12: SteelEye's Scope of Data Sources for Archiving and Monitoring
- v. Juniper Research's View: Key Strengths & Strategic Development Opportunities
- 4.2.13. SymphonyAI Sensa
- i. Corporate
- Table 4.13: SymphonyAI Sensa's Investment Rounds, 2012-2015
- ii. Geographical Spread
- iii. Key Clients & Strategic Partnerships
- iv. High-level View of Offerings
- v. Juniper Research's View: Key Strengths & Strategic Development Opportunities
- i. Corporate
- 4.2.14. Trading Technologies
- i. Corporate
- ii. Geographical Spread
- iii. Key Clients & Strategic Partnerships
- iv. High-level View of Offerings
- Figure 4.14: Trading Technologies-R Trade Surveillance
- v. Juniper Research's View: Key Strengths & Strategic Development Opportunities
- 4.2.15. TradingHub
- i. Corporate
- ii. Geographical Spread
- iii. Key Clients & Strategic Partnerships
- iv. High-level View of Offerings
- v. Juniper Research's View: Key Strengths & Strategic Development Opportunities
- 4.2.16. Trapets
- i. Corporate
- ii. Geographical Spread
- iii. Key Clients & Strategic Partnerships
- iv. High-level View of Offerings
- v. Juniper Research's View: Key Strengths & Strategic Development Opportunities
- 4.2.1. ACA Group
5. Data & Forecast
- 5.1. Introduction
- 5.2. Methodology & Assumptions
- Figure 5.1: Trade Surveillance Systems Forecast Methodology - Financial Services (Large, Medium, and Small Financial Institutions)
- Figure 5.2: Trade Surveillance Systems Forecast Methodology - Other Businesses
- 5.3. Trade Surveillance Systems Market
- 5.3.1. Total Spend on Trade Surveillance Systems
- Figure & Table 5.3: Total Spend on Third-party Trade Surveillance Systems ($m), Split by 8 Key Regions, 2024-2029
- Table 5.4: Total Spend on Third-party Trade Surveillance Systems ($m), Split by Segment, 2024-2029
- 5.3.2. Total Spend on Third-party Trade Surveillance Systems by Large Financial Institutions
- Figure & Table 5.5: Total Spend on Third-party Trade Surveillance Systems by Large Financial Institutions ($m), 2024-2029
- 5.3.3. Total Spend on Third-party Surveillance Systems by Medium-sized Financial Institutions
- Figure & Table 5.6: Total Spend on Third-party Trade Surveillance Systems by Medium-sized Financial Institutions ($m), 2024-2029
- 5.3.4. Total Spend on Third-party Trade Surveillance Systems by Small-sized Financial Institutions
- Figure & Table 5.7: Total Spend on Third-party Trade Surveillance Systems by Small-sized Businesses ($m), Split by 8 Key Regions, 2024-2029
- 5.3.5. Total Spend on Third-party Trade Surveillance Systems by Other Businesses
- Figure & Table 5.8: Total Spend on Third-party Trade Surveillance Systems by Other Businesses ($m), Split by 8 Key Regions, 2024-2029
- 5.3.1. Total Spend on Trade Surveillance Systems
