|
시장보고서
상품코드
1719509
스마트 교통 관리 시장(2025-2030년)Global Smart Traffic Management Market: 2025-2030 |
||||||
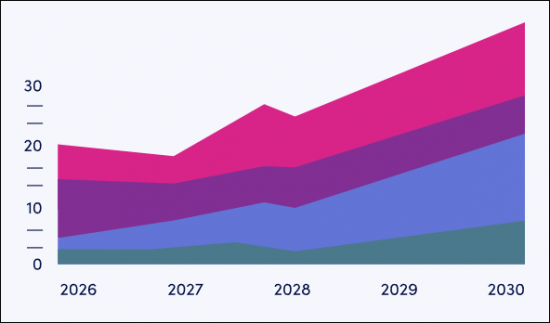
세계의 스마트 교통관리 시장은 지속가능성과 도시화로 성장해 2027년까지 200억 달러에 도달
| 주요 통계 | |
|---|---|
| 2025년 총 수익 | 148억 달러 |
| 2030년 총 수익 | 327억 달러 |
| 2025-2030년 시장 성장률 | 121% |
| 예측 기간 | 2025-2030년 |
본 조사 스위트는 진화를 계속하는 스마트 교통 관리 시장에 대해 상세하고 인사이트 있는 분석을 제공하고 있으며, 스마트 교통 관리 제공업체부터 규제 당국, 기술 벤더에 이르기까지 모든 관계자가 미래의 성장, 주요 트렌드, 경쟁환 경계를 이해하는 데 도움이 됩니다. 이 설문조사에는 주요 배포 모델을 평가하는 수익화 모델 분석이 포함되어 있으며 개인 네트워크 공급업체와 통신 사업자가 수익을 극대화하기 위한 전략적 제안을 제공합니다. 또한 Juniper Research의 Future Leaders 지수도 수록되어 있으며 지배적인 사업자에게 도전하는 신흥 스마트 교통 벤더를 검증하고 있습니다.
본 조사 제품군에는 향후 5년간의 스마트 교통 관리 시장 도입과 향후 성장을 매핑한 데이터에 대한 액세스 등 개별적으로 구입할 수 있는 몇 가지 옵션이 포함되어 있으며, 다음 스마트 교통 기술별로 나뉘어져 있습니다.
|
|
|
또한 스마트 교통 관리 솔루션에서 AI와 자동화 이용, 차량과 주변 환경을 연결하여 실시간 교통 관리를 가능하게 하는 V2X(Vehicle-to-Everything) 기술의 채용 증가 등 스마트 교통 관리 시장의 최신 동향과 사업 기회를 밝히는 인사이트가 풍부한 조사도 제공합니다.
주요 특징
- 주요 요점과 전략적 권장 사항 : 스마트 교통 관리 벤더, 기술 벤더, 규제 당국을 위한 주요 개발 기회, 주요 발전, 주요 전략적 권장 사항의 상세 분석을 제공합니다.
- 시장 전망 : 스마트 교통 관리 시장의 주요 촉진요인 및 과제를 통찰하고 통합의 복잡성과 예산의 제약이 가져오는 과제와 그 극복 방법을 다루고 있습니다. 스마트 교통 관리 벤더, 기술 기업, 규제 당국에 현재 시장 과제를 극복하기 위한 전략적 제안을 제공합니다.
- 벤치마크 업계 예측 : 총 수익, 전개된 스마트 교통 관리 시스템의 총수, 전개된 스마트 교통 관리 센서의 총수 등 스마트 교통 관리 시장 규모로 예측됩니다.
- Juniper Research의 경쟁 리더보드 : 주요 스마트 교통 관리 벤더 15사의 능력 평가, 주요 기업 시장 규모를 제공합니다.
샘플
시장 동향 및 전략 PDF 보고서

SAMPLE VIEW
시장 데이터 및 예측
시장 데이터 및 예측
설문 조사 제품군에는 82개의 표와 37,000개 이상의 데이터 포인트에 대한 예측 데이터 집합에 대한 액세스가 포함되어 있습니다.
- 도입된 스마트 교통 관리 시스템
- 도입된 스마트 교통 관리 센서
- 스마트 교통 관리 수익
- 스마트 교통 관리 시스템에 의한 정체 및 배출 비용 절감 규모
이 지표는 다음 주요 기술에 대해 제공됩니다.
- 스마트 고속도로
- 스마트 교차점
- 스마트 주차
예측은 또한 정체 및 배출 비용 절감의 합계를 다음과 같이 분류합니다.
- 혼잡 관리
- 배출 감축
Juniper Research의 대화형 예측(Excel)에는 다음과 같은 기능이 있습니다.
- 통계 분석 : 데이터 기간 동안 모든 지역 및 국가에 대해 표시되는 특정 측정항목을 검색할 수 있습니다. 그래프는 쉽게 변경할 수 있으며 클립보드로 내보낼 수 있습니다.
- 국가별 데이터 도구: 예측 기간 동안 모든 지역 및 국가 측정항목을 볼 수 있습니다. 검색창에 표시되는 측정항목을 필터링할 수 있습니다.
- 국가별 비교 도구: 특정 국가를 선택하고 비교할 수 있습니다. 이 도구에는 그래프를 내보내는 기능이 포함되어 있습니다.
- What-if 분석 : 5가지 대화형 시나리오를 통해 사용자는 예측 전제조건과 비교할 수 있습니다.
목차
시장 동향과 전략
제1장 중요 포인트와 전략적 제안
- 중요 포인트
- 전략적 제안
제2장 장래 시장 전망, 촉진요인, 과제
- 미래 시장 전망
- 성장 촉진요인
- 과제
- 동향
- 기술 분석
제3장 비즈니스 모델 분석
- 비즈니스 모델 분석
- 전개 모델
- On-Premise
- 클라우드 기반
- 엣지 베이스
- 하이브릿
- 모듈형
- 요약
- 전개 모델
제4장 퓨처 리더스 인덱스
- 벤더 프로파일
- AISP
- Asura Technologies
- Autilent
- Flow Labs
- GridMatrix
- NoTraffic
- Pushpak AI
- Simplifai Systems
- 평가 기법
- 제한과 해석
경쟁 리더보드
제1장 Juniper Research 경쟁 리더보드
제2장 기업 프로파일
- 벤더 프로파일
- AtkinsRealis
- Cubic Corporation
- Huawei Technologies
- IBM
- Indra Group
- INRIX
- Iteris
- Kapsch TrafficCom
- Miovision
- Q-Free
- Thales
- TomTom
- TransCore
- Transoft Solutions
- Umovity
- 평가 기법
- 관련 조사
데이터 및 예측
제1장 서론 및 조사 방법
제2장 시장 개요
- 스마트 교통 관리 시스템의 총 도입 수
- 스마트 교통 관리의 총 지출액
제3장 스마트 교차로
- 총 도입수
- 총 지출액
제4장 스마트 주차
- 총 도입수
- 총 지출액
제5장 스마트 고속도로
- 총 도입수
- 총 지출액
제6장 혼잡 관리
- 스마트 교통 관리 시스템에 의한 혼잡 관리 비용 절감액
제7장 배출 감축
- 스마트 교통 관리 시스템에 의한 배출 비용 절감액
'Smart Traffic Management Market Growth Fuelled by Sustainability & Urbanisation, Reaching $20 Billion by 2027'
| KEY STATISTICS | |
|---|---|
| Total revenue in 2025: | $14.8bn |
| Total revenue in 2030: | $32.7bn |
| 2025 to 2030 market growth: | 121% |
| Forecast period: | 2025-2030 |
Overview
Juniper Research's "Smart Traffic Management" research suite provides a detailed and insightful analysis of this progressing market; enabling stakeholders, from smart traffic management providers to regulators and technology vendors, to understand future growth, key trends and the competitive environment. The market-leading study includes monetisation model analysis that evaluates the key deployment models in the market; providing strategic recommendations for private network vendors and operators to maximise revenue. Additionally, it features Juniper Research's Future Leaders Index, which examines emerging smart traffic vendors who are challenging dominant players in the market. The coverage can also be purchased as a full research suite, containing all these elements and a substantial discount.
The research suite includes several different options that can be purchased separately, including access to data mapping the adoption and future growth of the smart traffic management market over the next five years, split by the following smart traffic technologies:
|
|
|
It also provides an insightful study uncovering the latest trends and opportunities within the smart traffic management market, including the use of AI and automation in smart traffic management solutions and the rising adoption of vehicle-to-everything (V2X) technologies that enable real-time traffic management by connecting vehicles to their surrounding environment. It also features an extensive analysis of the 15 market leaders in the smart traffic management space.
Collectively, these documents provide a critical tool for understanding this fast-evolving market. They allow smart traffic management vendors and operators to shape their future strategy and capitalise on future growth opportunities in digitally transforming regions. This research suite's extensive coverage makes it a valuable tool for navigating this rapidly growing market.
All report content is delivered in the English language.
Key Features
- Key Takeaways & Strategic Recommendations: In-depth analysis of key development opportunities, key findings and key strategic recommendations for smart traffic management vendors, technology vendors and regulators.
- Market Outlook: Insights into key drivers and market challenges within the smart traffic management market, addressing challenges posed by integration complexity and budget constraints and how these can be overcome. It also provides an analysis into the current and future trends in smart traffic management technology, providing strategic recommendations for smart traffic management vendors, technology companies and regulators, to overcome the current market challenges. It highlights the key monetisation opportunities for smart traffic management technologies, including data monetisation.
- Benchmark Industry Forecasts: The market size and forecast for the smart traffic management market, including total revenue, total smart traffic management systems deployed, and total number of deployed smart traffic management sensors. The forecast further breaks down total revenue and smart traffic management systems deployed by the three technology segments (smart intersections, smart parking and smart highways).
- Juniper Research Competitor Leaderboard: Key player capability and capacity assessment for 15 smart traffic management vendors via the Juniper Research Competitor Leaderboard; featuring smart traffic management market size for major players in the smart traffic management industry.
SAMPLE VIEW
Market Trends & Strategies PDF Report
A comprehensive analysis of the current market landscape, alongside strategic recommendations and a walk-through of the forecasts.
SAMPLE VIEW
Market Data & Forecasting

The numbers tell you what's happening, but our written report details why, alongside the methodologies.
Market Trends & Strategies
This report provides a detailed outlook for the market, assessing market trends and the factors shaping the evolution of this growing market. Technological developments, particularly in AI, have led to real-time traffic monitoring capabilities, enhancing traffic flows, increasing road safety, and reducing congestion and emissions from vehicles. It also evaluates challenges posed by older infrastructure and existing systems which have hindered modern solutions adoption, given the cost of enabling these to integrate with existing systems.
This report delivers an insightful analysis of the strategic opportunities for smart traffic management vendors and operators, as well as strategic recommendations to overcome emerging market challenges such as interoperability. It also includes an evaluation of key technology segment opportunities for smart traffic management vendors and operators, highlighting key markets with the highest growth potential.
Market Data & Forecasting
The market-leading research suite for the "Smart Traffic Management" market includes access to the full set of forecast data of 82 tables and over 37,000 datapoints. Metrics in the research suite include:
- Deployed Smart Traffic Management Systems
- Deployed Smart Traffic Management Sensors
- Smart Traffic Management Revenue
- Congestion & Emissions Cost Savings by Smart Traffic Management Systems
These metrics are provided for the following key technologies:
- Smart Highways
- Smart Intersections
- Smart Parking
The forecast further splits the total congestion and emissions cost savings by the following:
- Congestion Management
- Emissions Reduction
Juniper Research Interactive Forecast Excel contains the following functionality:
- Statistics Analysis: Users benefit from the ability to search for specific metrics, displayed for all regions and countries across the data period. Graphs are easily modified and can be exported to the clipboard.
- Country Data Tool: This tool lets users look at metrics for all regions and countries in the forecast period. Users can refine the metrics displayed via a search bar.
- Country Comparison Tool: Users can select and compare specific countries. The ability to export graphs is included in this tool.
- What-if Analysis: Here, users can compare forecast metrics against their own assumptions, via five interactive scenarios.
Competitor Leaderboard Report
The Competitor Leaderboard report provides a detailed evaluation and market positioning for 15 leading vendors in the smart traffic management space. The vendors are positioned as an established leader, leading challenger, or disruptor and challenger based on capacity and capability assessments:
|
|
This document is centred around the Juniper Research Competitor Leaderboard, a vendor positioning tool that provides an at-a-glance view of the competitive landscape in a market, backed by a robust methodology.
Table of Contents
Market Trends & Strategies
1. Key Takeaways and Strategic Recommendations
- 1.1. Key Takeaways
- 1.2. Strategic Recommendations
2. Future Market Outlook, Drivers and Challenges
- 2.1. Future Market Outlook
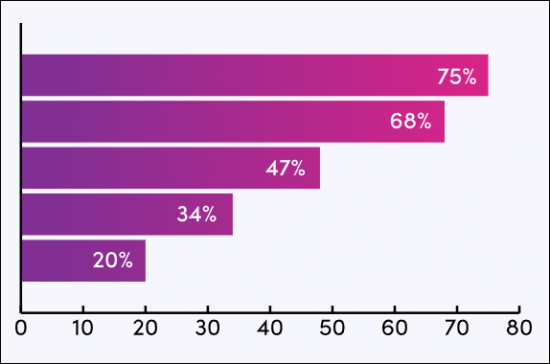
- Figure 2.1: Key Benefits of Smart Traffic Technology
- 2.1.1. Drivers
- i. Urbanisation and Population Growth
- ii. Technological Advancements
- iii. Government Investment
- iv. Environmental and Regulatory Pressures
- Figure 2.2: Total City Vehicle Emissions Cost Savings ($m), Split by 4 Key Countries, 2025-2030
- 2.1.2. Challenges
- i. Budget Constraints
- ii. Interoperability
- iii. Data Privacy and Cybersecurity Concerns
- 2.1.3. Trends
- i. Vehicle-to-Everything Communication
- Figure 2.3: Types of V2X
- ii. Multimodal Traffic Ecosystems
- iii. Connectivity
- i. Vehicle-to-Everything Communication
- 2.1.4. Technology Analysis
- i. Smart Intersections
- Figure 2.4: Total Number of Smart Intersections, Split by 8 Key Regions, 2025-2030
- Figure 2.5: Total Smart Intersection Spend ($m), Split by 5 Key Countries, 2025-2030
- ii. Smart Highways
- Figure 2.6: Total Length of Highways Converted to Smart Highways (km), Split by 8 Key Regions, 2025-2030
- iii. Smart Parking
- Figure 2.7: Total Smart Parking Spend ($m), Split by 8 Key Regions, 2025-2030
- iv. Summary
- Figure 2.8: Total Smart Traffic Management Spend ($m), Split by Sector, 2025-2030
- i. Smart Intersections
3. Business Model Analysis
- 3.1. Business Model Analysis
- 3.1.1. Deployment Models
- i. On-premises Deployment
- Table 3.1: Mitigation Strategies for On-premises Deployments
- ii. Cloud-based Deployment
- iii. Edge-based Deployments
- iv. Hybrid Deployments
- v. Modular Deployments
- vi. Summary
- i. On-premises Deployment
- 3.1.1. Deployment Models
4. Future Leaders Index
- 4.1. Why Read This Report
- Figure 4.1: Juniper Research Future Leaders Index: Smart Traffic Management Vendor Solutions
- Figure 4.2: Juniper Research Future Leaders Index: Smart Traffic Management Vendors
- Table 4.3: Juniper Research Smart Traffic Management Vendors Ranking
- Figure 4.4: Juniper Research Future Leaders Index Heatmap: Smart Traffic Management Vendors
- 4.2. Vendor Profiles
- 4.2.1. AISP
- i. Corporate
- ii. Geographical Spread
- iii. Key Clients and Strategic Partnerships
- iv. High-level View of Offerings
- v. Juniper Research's View: Key Strengths & Strategic Opportunities
- 4.2.2. Asura Technologies
- i. Corporate
- ii. Geographical Spread
- iii. Key Clients and Strategic Partnerships
- iv. High-level View of Offerings
- v. Juniper Research's View: Key Strengths & Strategic Opportunities
- 4.2.3. Autilent
- i. Corporate
- ii. Geographical Spread
- iii. Key Clients and Strategic Partnerships
- iv. High-level View of Offerings
- v. Juniper Research's View: Key Strengths & Strategic Opportunities
- 4.2.4. Flow Labs
- i. Corporate
- ii. Geographical Spread
- iii. Key Clients and Strategic Partnerships
- iv. High-level View of Offerings
- v. Juniper Research's View: Key Strengths & Strategic Opportunities
- 4.2.5. GridMatrix
- i. Corporate
- ii. Geographical Spread
- iii. Key Clients and Strategic Partnerships
- iv. High-level View of Offerings
- v. Juniper Research's View: Key Strengths & Strategic Opportunities
- 4.2.6. NoTraffic
- i. Corporate
- ii. Geographical Spread
- iii. Key Clients and Strategic Partnerships
- iv. High-level View of Offerings
- v. Juniper Research's View: Key Strengths & Strategic Opportunities
- 4.2.7. Pushpak AI
- i. Corporate
- ii. Geographical Spread
- iii. Key Clients and Strategic Partnerships
- iv. High-level View of Offerings
- v. Juniper Research's View: Key Strengths & Strategic Opportunities
- 4.2.8. Simplifai Systems
- i. Corporate
- ii. Geographical Spread
- iii. Key Clients and Strategic Partnerships
- iv. High-level View of Offerings
- v. Juniper Research's View: Key Strengths & Strategic Opportunities
- 4.2.1. AISP
- 4.3. Juniper Research Future Leaders Index Assessment Methodology
- 4.4. Limitations & Interpretations
- Figure 4.5: Juniper Research Future Leaders Index: Smart Traffic Management Services Criteria
Competitor Leaderboard
1. Juniper Research Competitor Leaderboard
- Why Read this Report
- Table 1.1: Juniper Research Competitor Leaderboard: Smart Traffic Management Providers: Product & Portfolio (Part 1)
- Table 1.1: Juniper Research Competitor Leaderboard: Smart Traffic Management Providers: Product & Portfolio (Part 2)
- Figure 1.2: Juniper Research Competitor Leaderboard: Smart Traffic Management Vendors
- Source: Juniper Research
- Table 1.3: Juniper Research Competitor Leaderboard: Vendor & Position
- Figure 1.4: Juniper Research Competitor Leaderboard Heatmap: Smart Traffic Management Vendors
2. Company Profiles
- 2.1. Vendor Profiles
- 2.1.1. AtkinsRealis
- i. Corporate Information
- Table 2.1: AtkinsRealis's Financial Summary ($m), 2022-2023
- ii. Geographical Spread
- iii. Key Clients & Strategic Partnerships
- iv. High-level View of Offerings
- v. Juniper Research's View: Key Strengths & Strategic Development Opportunities
- i. Corporate Information
- 2.1.2. Cubic Corporation
- i. Corporate Information
- ii. Geographical Spread
- iii. Key Clients & Strategic Partnerships
- iv. High-level View of Offerings
- v. Juniper Research's View: Key Strengths & Strategic Development Opportunities
- 2.1.3. Huawei Technologies
- i. Corporate Information
- Table 2.2: Huawei's Financial Information ($m), 2023-2024
- ii. Geographical Spread
- iii. Key Clients & Strategic Partnerships
- iv. High-level View of Offerings
- Figure 2.3: Diagram of Huawei's Intelligent Transportation System
- v. Juniper Research's View: Key Strengths & Strategic Development Opportunities
- i. Corporate Information
- 2.1.4. IBM
- i. Corporate Information
- Table 2.4: IBM's Financial Summary ($m), 2023-2024
- ii. Geographical Spread
- iii. Key Clients & Strategic Partnerships
- iv. High-level View of Offerings
- v. Juniper Research's View: Key Strengths & Strategic Development Opportunities
- i. Corporate Information
- 2.1.5. Indra Group
- i. Corporate Information
- Table 2.5: Indra's Financial Summary ($m), 2023-2024
- ii. Geographical Spread
- iii. Key Clients & Strategic Partnerships
- iv. High-level View of Offerings
- v. Juniper Research's View: Key Strengths & Strategic Development Opportunities
- i. Corporate Information
- 2.1.6. INRIX
- i. Corporate Information
- ii. Geographical Spread
- iii. Key Clients & Strategic Partnerships
- iv. High-level View of Offerings
- v. Juniper Research's View: Key Strengths & Strategic Development Opportunities
- 2.1.7. Iteris
- i. Corporate
- Table 2.6: Iteris's Financial Summary ($m), 2023-2024
- ii. Geographical Spread
- iii. Key Clients & Strategic Partnerships
- iv. High-level View of Offerings
- Figure 2.7: Diagram of Iteris's ClearMobility Platform
- v. Juniper Research's View: Key Strengths & Strategic Development Opportunities
- i. Corporate
- 2.1.8. Kapsch TrafficCom
- i. Corporate Information
- Table 2.8: Kapsch TrafficCom's Financial Summary ($m), 2023-2024
- ii. Geographical Spread
- iii. Key Clients & Strategic Partnerships
- iv. High-level View of Offerings
- v. Juniper Research's View: Key Strengths & Strategic Development Opportunities
- i. Corporate Information
- 2.1.9. Miovision
- i. Corporate
- ii. Geographical Spread
- iii. Key Clients & Strategic Partnerships
- iv. High-level View of Offerings
- v. Juniper Research's View: Key Strengths & Strategic Development Opportunities
- 2.1.10. Q-Free
- i. Corporate
- ii. Geographical Spread
- iii. Key Clients & Strategic Partnerships
- iv. High-level View of Offerings
- v. Juniper Research's View: Key Strengths & Strategic Development Opportunities
- 2.1.11. Thales
- i. Corporate Information
- Table 2.9: Thales's Financial Summary ($m), 2023-2024
- ii. Geographical Spread
- iii. Key Clients & Strategic Partnerships
- iv. High-level View of Offerings
- v. Juniper Research's View: Key Strengths & Strategic Development Opportunities
- i. Corporate Information
- 2.1.12. TomTom
- i. Corporate Information
- Table 2.10: TomTom's Financial Summary ($m), 2023-2024
- ii. Geographical Spread
- iii. Key Clients & Strategic Partnerships
- iv. High-level View of Offerings
- v. Juniper Research's View: Key Strengths & Strategic Development Opportunities
- i. Corporate Information
- 2.1.13. TransCore
- i. Corporate Information
- ii. Geographical Spread
- iii. Key Clients & Strategic Partnerships
- iv. High-level View of Offerings
- v. Juniper Research's View: Key Strengths & Strategic Development Opportunities
- 2.1.14. Transoft Solutions
- i. Corporate Information
- ii. Geographical Spread
- iii. Key Clients and Strategic Partnerships
- iv. High-level View of Offerings
- v. Juniper Research's View: Key Strengths & Strategic Development Opportunities
- 2.1.15. Umovity
- i. Corporate Information
- ii. Geographical Spread
- iii. Key Clients & Strategic Partnerships
- iv. High-level View of Offerings
- v. Juniper Research's View: Key Strengths & Strategic Development Opportunities
- 2.1.1. AtkinsRealis
- 2.2. Juniper Research Leaderboard Assessment Methodology
- 2.2.1. Limitation & Interpretations
- Table 2.11: Juniper Research Competitor Leaderboard Scoring Criteria: Smart Traffic Management Vendors
- 2.2.1. Limitation & Interpretations
- 2.3. Related Research
Data & Forecasting
1. Introduction and Methodology
- 1.1. Smart Traffic Management Market Summary and Future Outlook
- 1.2. Forecast Methodology
- Figure 1.1: Smart Intersections Methodology
- Figure 1.2: Smart Parking Methodology
- Figure 1.3: Smart Highway Forecast Methodology
- Figure 1.4: Congestion Management Forecast Methodology
- Figure 1.5: Emissions Reduction Forecast Methodology
2. Market Overview
- 2.1. Total Number of Deployed Smart Traffic Management Systems
- Figure and Table 2.1: Total Number of Deployed Smart Traffic Management Systems (m), Split by 8 Key Regions, 2025-2030
- 2.2. Total Smart Traffic Management Spend
- Figure and Table 2.2: Total Smart Traffic Management Spend ($m), Split by 8 Key Regions, 2025-2030
3. Smart Intersections
- 3.1. Total Number of Smart Intersections
- Figure and Table 3.1: Total Number of Smart Traffic Intersections (m), Split by 8 Key Regions, 2025-2030
- 3.1.1. Total Smart Intersection Spend
- Figure and Table 3.2: Total Smart Intersection Spend ($m), Split by 8 Key Regions, 2025-2030
4. Smart Parking
- 4.1. Total Number of Smart Parking Spaces
- Figure and Table 4.1: Total Smart Parking Spaces (m), Split by 8 Key Regions, 2025-2030
- 4.2. Total Smart Parking Spend
- Figure and Table 4.2: Total Smart Parking Spend ($m), Split by 8 Key Regions, 2025-2030
5. Smart Highways
- 5.1. Total Length of Highways Converted to Smart Highways
- Figure and Table 5.1: Total Length of Highways Converted to Smart Highways (km), Split by 8 Key Regions, 2025-2030
- 5.2. Total Smart Highway Spend
- Figure and Table 5.2: Total Smart Highway Spend ($m), Split by 8 Key Regions, 2025-2030
6. Congestion Management
- 6.1. Total Cost of Congestion Saved by Smart Traffic Management Systems
- Figure and Table 6.1: Total Cost of Congestion Saved by Smart Traffic Management Systems ($m), Split by 8 Key Regions, 2025-2030
7. Emissions Reduction
- 7.1. Total City Vehicle Emissions Cost Savings
- Figure and Table 7.1: Total City Vehicle Emissions Cost Savings ($m), Split by 8 Key Regions, 2025-2030
